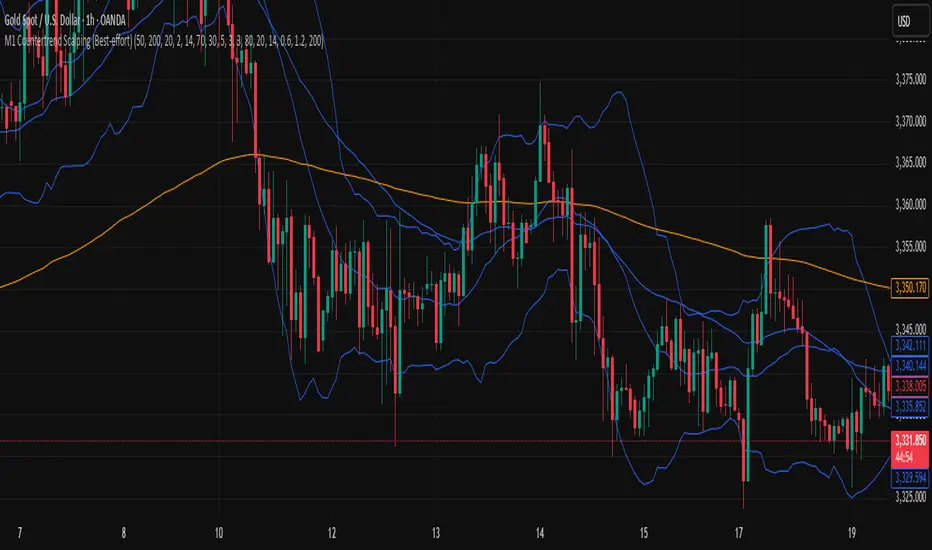
M1 Countertrend Scalping (Best-effort)M1 Countertrend Scalping (Best-effort)
M1 Countertrend Scalping (Best-effort)
ค้นหาในสคริปต์สำหรับ "纳斯达克指数期货cfd"
Range FinderRange Finder Strategy for TradingView
Overview
The Range Finder Strategy is a sophisticated trading system designed for forex and cryptocurrency markets, leveraging dynamic range detection, wick-based rejection patterns, and EMA confluence to execute high-probability trades. This strategy identifies key price ranges using pivot points and triggers trades when price rejects from these boundaries with significant wick formations, aligning with the broader market trend as confirmed by EMA crossovers. It incorporates robust risk management, customizable parameters, and visual aids for clear trade visualization, making it suitable for both manual and automated trading on platforms like Bitget via webhook alerts.
Strategy Components
1. Dynamic Range Detection
Pivot Points: The strategy identifies range boundaries using pivot highs and lows, calculated with a user-defined Pivot Length (default: 5 bars left/right). These pivots mark significant swing points, defining the upper (range high) and lower (range low) boundaries of the price range.
Visualization: The range high is plotted as an orange line, and the range low as a purple line, using a broken line style (plot.style_linebr) to show only confirmed pivot levels, providing a clear visual of the trading range.
2. Wick-Based Rejection Pattern
Wick Detection: The strategy looks for rejection candles at the range boundaries, characterized by significant wicks. A wick is considered valid if its size is at least the user-defined Wick to Body Ratio (default: 1.1, or 10% larger than the candle body).
Sell Signal: Triggered when the high exceeds the range high, the candle closes bearish (close < open), and the upper wick meets the ratio requirement.
Buy Signal: Triggered when the low falls below the range low, the candle closes bullish (close > open), and the lower wick meets the ratio requirement.
Purpose: These wicks indicate strong rejection at key levels, often signaling a reversal back into the range, providing high-probability entry points.
3. EMA Trend Confirmation
EMA Calculation: Uses two Exponential Moving Averages (EMAs) calculated on a user-selectable timeframe (default: 5-minute):
EMA 200: Long-term trend indicator (plotted in red).
EMA 50: Short-term trend indicator (plotted in green).
Crossover Logic:
A bullish trend is confirmed when the EMA 50 crosses above the EMA 200 (ema_trend_up = true).
A bearish trend is confirmed when the EMA 50 crosses below the EMA 200 (ema_trend_down = true).
Confluence Requirement: Trades are only executed when the wick rejection aligns with the EMA trend (e.g., sell signals require close < ema200 and bearish trend; buy signals require close > ema200 and bullish trend).
4. Risk Management
Position Sizing: Calculated based on the user-defined Account Balance (default: $10,000) and Risk Per Trade (default: 2%). The position size is determined as risk_amount / stop_distance, where stop_distance is derived from the Average True Range (ATR, default period: 14).
Stop Loss (SL): Set using an ATR-based multiplier (SL Multiplier, default: 9.0). For sells, SL is placed above the high; for buys, below the low.
Take Profit (TP): Set using an ATR-based multiplier (TP Multiplier, default: 6.0) scaled by the Risk:Reward Ratio (default: 6.0), ensuring a favorable reward-to-risk profile.
Example: For a $10,000 account with 2% risk, if ATR is 0.5, the position size is 400 units, with SL and TP dynamically adjusted to market volatility.
5. Trade Execution
Sell Entry: Triggered on a wick rejection above the range high, with bearish EMA confluence (ema_trend_down and close < ema200). Enters a short position with calculated SL and TP.
Buy Entry: Triggered on a wick rejection below the range low, with bullish EMA confluence (ema_trend_up and close > ema200). Enters a long position with calculated SL and TP.
Exit Logic: Uses strategy.exit to set SL and TP levels, closing trades when either is hit.
6. Visual Feedback
Lines and Labels: Upon trade entry, the strategy plots:
Red SL line and label (e.g., "SL: 123.45").
Green TP line and label (e.g., "TP: 120.00").
Entry line (red for sell, green for buy) labeled with "Sell (Range Rejection)" or "Buy (Range Rejection)".
Customization: Users can adjust the Line Length (default: 25 bars) for how long lines persist and Label Position (left or right) for optimal chart visibility.
7. Alert Conditions
Webhook Integration: Generates alerts for Bitget webhook integration, providing JSON-formatted messages with trade details (action, contracts, market position, size, price, symbol, and timestamp).
Usage: Traders can set up automated trading by connecting these alerts to trading bots or platforms supporting webhooks.

IFVG by Toño# IFVG by Toño - Pine Script Indicator
## Overview
This Pine Script indicator identifies and visualizes **Fair Value Gaps (FVG)** and **Inverted Fair Value Gaps (IFVG)** on trading charts. It provides advanced analysis of price inefficiencies and their subsequent inversions when mitigated.
## Key Features
### 1. Fair Value Gap (FVG) Detection
- **Bullish FVG**: Detected when `low > high ` (gap between current low and high of 2 bars ago)
- **Bearish FVG**: Detected when `high < low ` (gap between current high and low of 2 bars ago)
- Visual representation using colored rectangles (green for bullish, red for bearish)
### 2. Inverted Fair Value Gap (IFVG) Creation
- **IFVG Formation**: When a FVG gets mitigated (price fills the gap with candle body), an IFVG is created
- **Color Inversion**: The IFVG takes the opposite color of the original FVG
- Mitigated bullish FVG → Creates red (bearish) IFVG
- Mitigated bearish FVG → Creates green (bullish) IFVG
- **Mitigation Logic**: Uses only candle body (not wicks) to determine when a FVG is filled
### 3. Customizable Display Options
- **Show Normal FVG**: Toggle visibility of regular Fair Value Gaps
- **Show IFVG**: Toggle visibility of Inverted Fair Value Gaps
- **Smart FVG Display**: Even when "Show Normal FVG" is disabled, FVGs that are part of IFVGs remain visible
- **Extension Control**: Option to extend FVGs until they are mitigated
### 4. IFVG Extension Methods
- **Full Cross Method**: IFVG remains active until price completely crosses through it (including wicks)
- **Number of Bars Method**: IFVG remains active for a specified number of bars (1-100)
### 5. Visual Mitigation Signals
- **Cross Markers**: Shows X-shaped markers when IFVGs are mitigated
- Green cross above bar: Bearish IFVG mitigated
- Red cross below bar: Bullish IFVG mitigated
### 6. Comprehensive Alert System
- **IFVG Formation Alerts**: Notifications when new IFVGs are created
- **IFVG Mitigation Alerts**: Notifications when IFVGs are filled/mitigated
- **Separate Controls**: Individual toggles for bullish and bearish IFVG alerts
## How It Works
### Step-by-Step Process:
1. **FVG Detection**: Script continuously scans for 3-bar patterns that create price gaps
2. **FVG Tracking**: Each FVG is stored with its coordinates, type, and status
3. **Mitigation Monitoring**: Script watches for candle bodies that fill the FVG
4. **IFVG Creation**: Upon mitigation, creates an IFVG with opposite polarity at the same location
5. **IFVG Management**: Tracks and extends IFVGs according to chosen method
6. **Visual Updates**: Dynamically updates colors and visibility based on user settings
## Use Cases
- **Support/Resistance Analysis**: IFVGs often act as strong support/resistance levels
- **Market Structure Understanding**: Helps identify how market inefficiencies get filled and reversed
- **Entry/Exit Timing**: Can be used to time entries around IFVG formations or mitigations
- **Confluence Analysis**: Combine with other technical analysis tools for stronger signals
## Configuration Parameters
- **Colors**: Customizable colors for bullish/bearish FVGs and IFVGs
- **Extension**: Choose how long to display gaps on the chart
- **Alerts**: Full control over notification preferences
- **Visual Clarity**: Options to show/hide different gap types for cleaner charts
## Technical Specifications
- **Pine Script Version**: 5
- **Overlay**: True (displays directly on price chart)
- **Max Boxes**: 500 (supports up to 500 simultaneous gaps)
- **Performance**: Optimized array management for smooth operation
This indicator is particularly valuable for traders who use **Smart Money Concepts (SMC)** and **Inner Circle Trader (ICT)** methodologies, as it provides clear visualization of how institutional order flow creates and fills market inefficiencies.

OHLC Lines – Yesterday & Today (Minimalist Option)This indicator draws horizontal lines representing the Open, High, Low, and Close (OHLC) levels of yesterday and today directly on your chart. It automatically updates each day, showing only the lines for the previous day and the current day, keeping your chart clean and focused.
Features:
Display Yesterday’s OHLC levels.
Display Today’s OHLC levels.
Optional Minimalist Mode with customizable color, width, and line style.
Lines automatically update each day and remove old lines.
Fully customizable colors, visibility, and line width for each OHLC level.
Use Case:
Perfect for traders who want to monitor key daily price levels, identify support/resistance zones, or incorporate OHLC levels into intraday strategies.


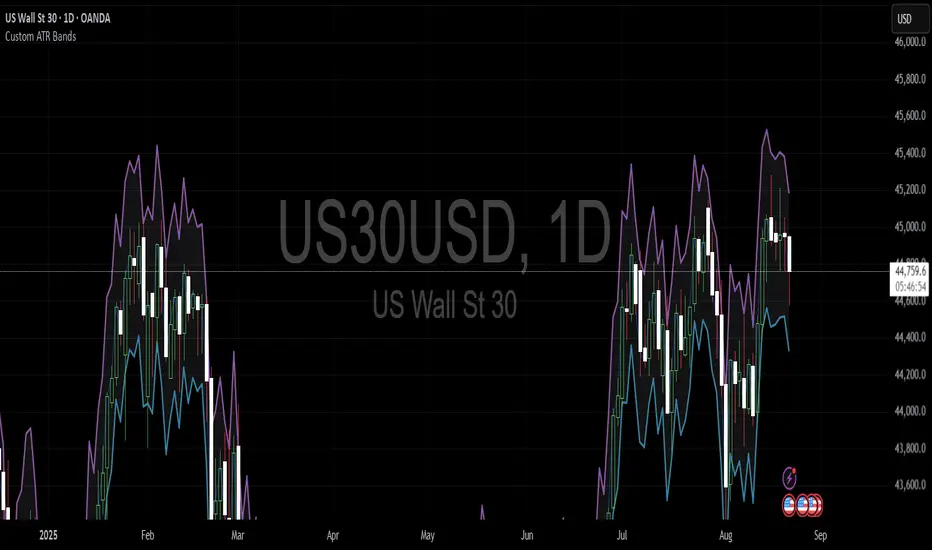
Custom ATR BandsThis indicator provides a customisable, easy to view band around the price, based on the ATR. The ATR length and multiplier can be adjusted.
Advanced RSI — Mark 4 RSI was introduced by J. Welles Wilder Jr. in 1978 in New Concepts in Technical Trading Systems. It measures the velocity of gains vs. losses on a bounded 0–100 scale and popularized the 14-period lookback with 70/30 guide rails for overbought/oversold. Over time, traders added variations (different lengths, thresholds, smoothing, adaptive levels), but the core idea stayed the same: momentum turns often precede price turns.
and i initially started to make minor adjustments for personal use like changing the default to 17 , and using Tradingviews official RSI which comes with a MA embedded. but it was not enough. especially the visuals.
so, for this public release Mark 4 i enhanced RSI by incorporating :
1. Dual-Length Fusion
Two RSI periods (default 17 + 21) blended then lightly smoothed (TEMA by default) → steadier
line without dulling turns.
2. Adaptive OB/OS (ATR-aware) for fewer whipsaws.
3. OB/OS alt solution:
Brief yellow segments appear only at local extremes (default: >72 tops, <32 bottoms) to
emphasize exhaustion without repainting the whole line.
4. Signals you can actually see
Triangle markers for:
Bullish: RSI crossing up through adaptive OS (and still <40 at the cross).
Bearish: RSI crossing down through adaptive OB (and still >60 at the cross).
“Strong Bull/Bear” background nudges appear when momentum is pushing beyond the
bands.
Optional Divergence Tags
and
Tiny diamonds to flag potential bullish/bearish divergences (look-back based).
Info Table (can be hidden)
my Fav feature i included 5 colorways with modern themes.(pls check under INPUTS)
and i made all that to make the indicator visualization look awesome on high end displays.
Credits & acknowledgment
Inspired by the original RSI by J. Welles Wilder Jr. (1978).
Built to be modern, focused, and comfortable for long sessions—especially on dark/OLED displays.
THIS INDICATOR IS MORE THAN ENOUGH BUT I DO HAVE PRIVATE INDICATORS WITH DIFFERENT LOGIC FUNCTIONS.
I'm open for feedback/collaboration.
drsamc.

> 50% Body Candle A script that give the number of ATR of a candle. Good to mesure how explosive a move is.

Krish.Tradess - FX market masterit will help you to identify market sessions and identify overlapping sessions in market. You can mark your trading
Three-Step 9:30 Range Scalping# Three-Step 9:30 Range Scalping Strategy Rules
## Step 1: Mark the Levels (9:30 AM)
- Wait for the **first 5-minute candle** starting at 9:30 AM EST to close
- Mark the **HIGH** and **LOW** of this candle
- Switch to **1-minute chart** for trading
## Step 2: Find Your Entry (Trade for 1 hour only: 9:30-10:30 AM)
### BREAK Entry
- Need: **Fair Value Gap (FVG)** + **ANY** of the 3 FVG candles closes outside the range
- FVG = Gap between candle wicks (3-candle pattern)
### TRAP Entry
- Need: Break outside range → Retest back inside → Close back outside again
### REVERSAL Entry
- Need: Failed break in one direction → Opposite FVG back into the range
## Step 3: Trade Management
### Stop Loss:
- **Break/Trap**: Low/High of first candle that closed outside the range
- **Reversal**: Low/High of first candle in the FVG pattern
### Take Profit:
- **Always 2:1 risk-to-reward ratio**
- If you risk $100, you make $200
## Key Rules:
- ✅ **Body close** outside range (not just wicks)
- ✅ Trade on **1-minute chart** only
- ✅ Only trade **first hour** (9:30-10:30 AM EST)
- ✅ **Fixed 2:1** take profit every time
- ✅ One strategy, stay consistent
**That's it. No complicated indicators, no higher timeframe bias, no guesswork.**

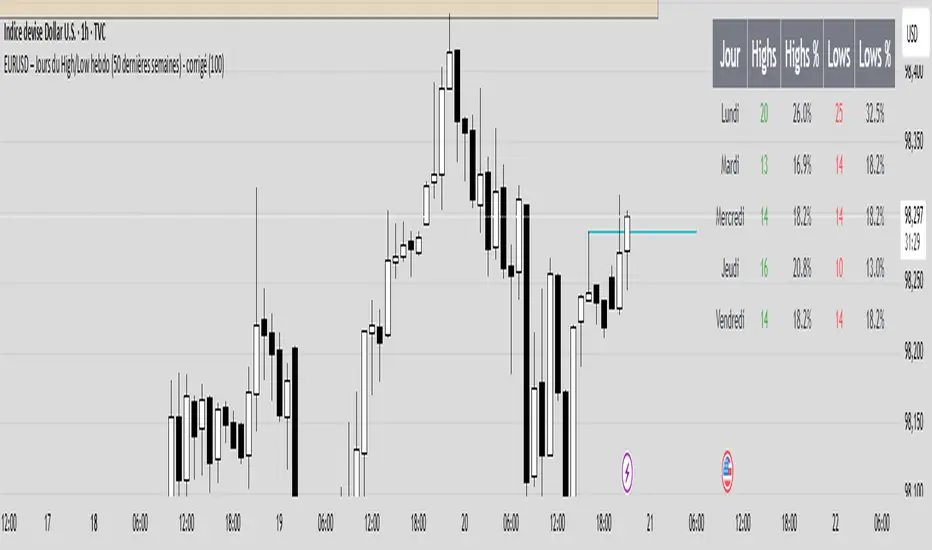
Weekly High/Low Day StatsThis TradingView Pine Script (v5) analyzes weekly highs and lows to identify on which day of the week (Monday → Friday) they most frequently occur.
🔎 How it works:
Tracks the weekly highest high and lowest low.
At the end of each week, it records the day of the week when the high and low were set.
Keeps historical data for the last 100 weeks (adjustable).
Displays a table showing:
How many times each day marked the weekly high or weekly low.
The corresponding percentage distribution.
🎯 Use case:
Helps traders understand the weekly timing tendency
Reveals which day is statistically more likely to set the weekly high or weekly low.
Useful for weekly planning and strategies that rely on market structure and timing (e.g., ICT concepts like the "High/Low of the Week").
Concentric Geometry – Invariant MetricsConcentric Geometry – Invariant Metrics
This indicator demonstrates the invariant concept of a concentric circle around a selected price range. By anchoring two points (A & B), it calculates a set of ratios and slopes that remain consistent under concentric scaling of price and time. These invariants include the raw slope (ΔP/N), concentric slope, π-adjusted ratios, and √2 offsets — all of which can be used to explore deeper geometric relationships in the market.
What has been demonstrated here is not an “out-of-the-box” trading system. Instead, the outputs provide the raw invariant metrics from which the trader must derive their own ratios and extensions. For example, price-to-bar ratio inputs are not fixed — they need to be derived from the invariants themselves, and experimenting with them is the key to uncovering harmonic alignments and scaling behaviors.
Key features include:
• Range & Bars Analysis – Price range (ΔP) and bar count (N) between anchors.
• Core Invariants – Midpoint, radius (price and bar units), upper/lower bounds.
• Linear Slope Metrics – ΔP/N and √2 concentric slope.
• π-Adjusted Price/Bar – Harmonic arc-length ratio.
• Circumference & Offsets – Circle circumference, √2 and 1/√2 offsets in price and bar units.
This tool is best suited for traders studying market geometry, W.D. Gann principles, harmonic ratios, or the geometric methods of Michael Jenkins. It does not generate buy/sell signals — instead, it equips the trader with building blocks for geometric exploration.
Key point: The trader must experiment with the ratios derived from these metrics. Playing with different price-to-bar relationships unlocks the true potential of concentric market geometry, whether applied to dynamic anchored VWAPs, concentric overlays, or Vesica Piscis structures.
Use it to:
• Compare slopes across swings
• Derive new ratios from invariant metrics
• Anchor dynamic anchored VWAPs to concentric nodes
• Explore concentric or Vesica Piscis overlays
• Support advanced geometric trading strategies

Opening Range BreakoutOpen Range Breakout (ORB) – Trading Strategy Documentation
Definition:
The Open Range Breakout (ORB) is a short-term trading strategy that identifies the price range established during the initial period of market opening (typically the first 15 to 60 minutes) and uses the high and low of that range as key reference levels for potential breakout entries.
Components:
Open Range High: The highest price traded during the defined opening period.
Open Range Low: The lowest price traded during the same period.
Breakout Trigger: A price move above the Open Range High or below the Open Range Low, signaling potential continuation momentum.
How It Works:
Define the Opening Period: Select a time window (e.g., 30 minutes) at market open to establish the initial range.
Identify Range Boundaries: Record the high and low prices during this period.
Monitor for Breakout: Watch for price to break and close above the Open Range High (bullish breakout) or below the Open Range Low (bearish breakout).
Enter Trade: Enter long on a confirmed break above the Open Range High, or short on a break below the Open Range Low. Entry may be triggered on a retest of the broken level or with volume confirmation.
Set Stop-Loss and Target:
Stop-loss: Placed just inside the open range (e.g., below the high for long, above the low for short).
Profit target: Based on volatility (e.g., ATR multiple) or support/resistance levels.
Key Assumptions:
Early price action reflects initial market sentiment.
A breakout from this range indicates strong directional momentum likely to continue.
Best Conditions:
High liquidity markets (e.g., major indices, large-cap stocks).
Volatile or news-driven trading sessions.
Used primarily in intraday trading.
Limitations:
Prone to false breakouts during low-volume or choppy markets.
Requires strict risk management due to reliance on timing and confirmation.
Conclusion:
The ORB strategy capitalizes on early market momentum by trading breakouts from the initial price range. Its effectiveness depends on precise range definition, timely execution, and disciplined risk control.

HTF POC with Zones & AlertsPlots a Point of Control (POC) per candle from a timeframe you choose (MTF). Because TradingView doesn’t expose true footprint data, the POC here is a proxy (choose: Body Mid, Range Mid, or Typical Price HLC3). The script draws the POC line and an optional POC zone (±% of that candle’s range), then alerts when price retests the zone (wick touches count).
Use it to:
Mark key levels inside candles that often act as magnets or reaction zones
Track retests of strong bars (imbalance) across higher timeframes
Add clean confluence with S/R, FVGs, or trend tools
Features: Selectable TF, zone width, extend lines/zones, historical caps, alerts, and info panel.
Note: This is an estimate of POC from OHLC, not real bid/ask volume. Use as context, not a standalone signal.

ADVANCED COSINE PROJECTION SYSTEM — LITE Mark3ACPS-Lite is a projection-based tool designed to visualize potential price paths using cosine-based similarity and stability analysis.
so, i have been working over multiple iterations to have a stable projection based on cosine principles and I've settled with a few stable algorithmic frameworks which works as: what i like to call : next generation leading indicators.
This indicator works well with any charting type like line/bar/candles etc. across ALL timeframes. (including seconds).
Basically this indicator projects a path towards the right.
Based on the trend the color of the projection updates on live refresh (depends on your timeframe of choice)
GREEN path projection for possible up trend
RED for bearish and yellow for sideways trend.
Technical : This indicator Aims to solve "DIRECTION" .
The idea was to to calculate angle between any given vectors : so if we translate it into the trading world : we are trying to determine direction (simplified explanation).
Pros : Scale Independent
meaning factors like flash crash , High impact movements (like NFP's) dont impact the projection logic in terms of Magnitude.
My model focuses on pattern similarity
example : in the previous instance of similar situation how did price react ?
therefore making a similar "COSINE" projection. (based on past "vector"/event)
on the left side there will always be an highlighted box section to visually represent where the future projections are based off of.
Cons: multiple vectors can have same direction from the cosine logic : essentially rendering the projected distance inconclusive.
but i solved that problem fully but on this lite version i made use of live refresh feature to keep the projections on a float : making our right side projections that much more fluid.
finally as a psychological factor not to get caught up on any Bias i made sure the indicator switches color according to immediate trend change logi.
Best Use case : have this indicator across multiple timeframes inside Tradingvieews tabs to Help make better Judgement.
I'm open for feedback / suggestions.
regards,
drsamc.
Smarter Money Concepts - Wyckoff Springs & Upthrusts [PhenLabs]📊Smarter Money Concepts - Wyckoff Springs & Upthrusts
Version: PineScript™v6
📌Description
Discover institutional manipulation in real-time with this advanced Wyckoff indicator that detects Springs (accumulation phases) and Upthrusts (distribution phases). It identifies when price tests support or resistance on high volume, followed by a strong recovery, signaling potential reversals where smart money accumulates or distributes positions. This tool solves the common problem of missing these subtle phase transitions, helping traders anticipate trend changes and avoid traps in volatile markets.
By combining volume spike detection, ATR-normalized recovery strength, and a sigmoid probability model, it filters out weak signals and highlights only high-confidence setups. Whether you’re swing trading or day trading, this indicator provides clear visual cues to align with institutional flows, improving entry timing and risk management.
🚀Points of Innovation
Sigmoid-based probability threshold for signal filtering, ensuring only statistically significant Wyckoff patterns trigger alerts
ATR-normalized recovery measurement that adapts to market volatility, unlike static recovery checks in traditional indicators
Customizable volume spike multiplier to distinguish institutional volume from retail noise
Integrated dashboard legend with position and size options for personalized chart visualization
Hidden probability plots for advanced users to analyze underlying math without chart clutter
🔧Core Components
Support/Resistance Calculator: Scans a user-defined lookback period to establish dynamic levels for Spring and Upthrust detection
Volume Spike Detector: Compares current volume to a 10-period SMA, multiplied by a configurable factor to identify significant surges
Recovery Strength Analyzer: Uses ATR to measure price recovery after breaks, normalizing for different market conditions
Probability Model: Applies sigmoid function to combine volume and recovery data, generating a confidence score for each potential signal
🔥Key Features
Spring Detection: Spots accumulation when price dips below support but recovers strongly, helping traders enter longs at potential bottoms
Upthrust Detection: Identifies distribution when price spikes above resistance but falls back, alerting to possible short opportunities at tops
Customizable Inputs: Adjust lookback, volume multiplier, ATR period, and probability threshold to match your trading style and market
Visual Signals: Clear + (green) and - (red) labels on charts for instant recognition of accumulation and distribution phases
Alert System: Triggers notifications for signals and probability thresholds, keeping you informed without constant monitoring
🎨Visualization
Spring Signal: Green upward label (+) below the bar, indicating strong recovery after support break for accumulation
Upthrust Signal: Red downward label (-) above the bar, showing failed breakout above resistance for distribution
Dashboard Legend: Customizable table explaining signals, positioned anywhere on the chart for quick reference
📖Usage Guidelines
Core Settings
Support/Resistance Lookback
Default: 20
Range: 5-50
Description: Sets bars back for S/R levels; lower for recent sensitivity, higher for stable long-term zones – ideal for spotting Wyckoff phases
Volume Spike Multiplier
Default: 1.5
Range: 1.0-3.0
Description: Multiplies 10-period volume SMA; higher values filter to significant spikes, confirming institutional involvement in patterns
ATR for Recovery Measurement
Default: 5
Range: 2-20
Description: ATR period for recovery strength; shorter for volatile markets, longer for smoother analysis of post-break recoveries
Phase Transition Probability Threshold
Default: 0.9
Range: 0.5-0.99
Description: Minimum sigmoid probability for signals; higher for strict filtering, ensuring only high-confidence Wyckoff setups
Display Settings
Dashboard Position
Default: Top Right
Range: Various positions
Description: Places legend table on chart; choose based on layout to avoid overlapping price action
Dashboard Text Size
Default: Normal
Range: Auto to Huge
Description: Adjusts legend text; larger for visibility, smaller for minimal space use
✅Best Use Cases
Swing Trading: Identify Springs for long entries in downtrends turning to accumulation
Day Trading: Catch Upthrusts for short scalps during intraday distribution at resistance
Trend Reversal Confirmation: Use in conjunction with other indicators to validate phase shifts in ranging markets
Volatility Plays: Spot signals in high-volume environments like news events for quick reversals
⚠️Limitations
May produce false signals in low-volume or sideways markets where volume spikes are unreliable
Depends on historical data, so performance varies in unprecedented market conditions or gaps
Probability model is statistical, not predictive, and cannot account for external factors like news
💡What Makes This Unique
Probability-Driven Filtering: Sigmoid model combines multiple factors for superior signal quality over basic Wyckoff detectors
Adaptive Recovery: ATR normalization ensures reliability across assets and timeframes, unlike fixed-threshold tools
User-Centric Design: Tooltips, customizable dashboard, and alerts make it accessible yet powerful for all trader levels
🔬How It Works
Calculate S/R Levels:
Uses the highest high and the lowest low over the lookback period to set dynamic zones
Establishes baseline for detecting breaks in Wyckoff patterns
Detect Breaks and Recovery:
Checks for price breaking support/resistance, then recovering on volume
Measures recovery strength via ATR for volatility adjustment
Apply Probability Model:
Combines volume spike and recovery into a sigmoid function for confidence score
Triggers signal only if above threshold, plotting visuals and alerts
💡Note:
For optimal results, combine with price action analysis and test settings on historical charts. Remember, Wyckoff patterns are most effective in trending markets – use lower probability thresholds for practice, then increase for live trading to focus on high-quality setups.

samc's - Keltner OscillatorThe KELTNER CHANNEL is a widely used technical indicator developed in the 60's by Chester W. Keltner who described it in his 1960 book How To Make Money in Commodities.
so i took the logic, simplified the code and made into an oscillator.
to add a flavor of modern times you can choose among 10 different colorways themes in the settings. (so traders can adjust it for dark or light charts)
Although the initial idea was developed for stocks and commodities, I've carefully back tested this as an oscillator across FX MAJORS , MINORS and high liquidity stocks for the use case of scalping and Medium term trade ideas.
now, this indicator works successfully over all time frames, custom time frames and all assets.
This script builds on the same approach as my earlier session tool — keeping things clean, visual, and easy to read.
I intend to publish more of my work as i develop them from Beta ideas into stable scripts, and i welcome feedback.
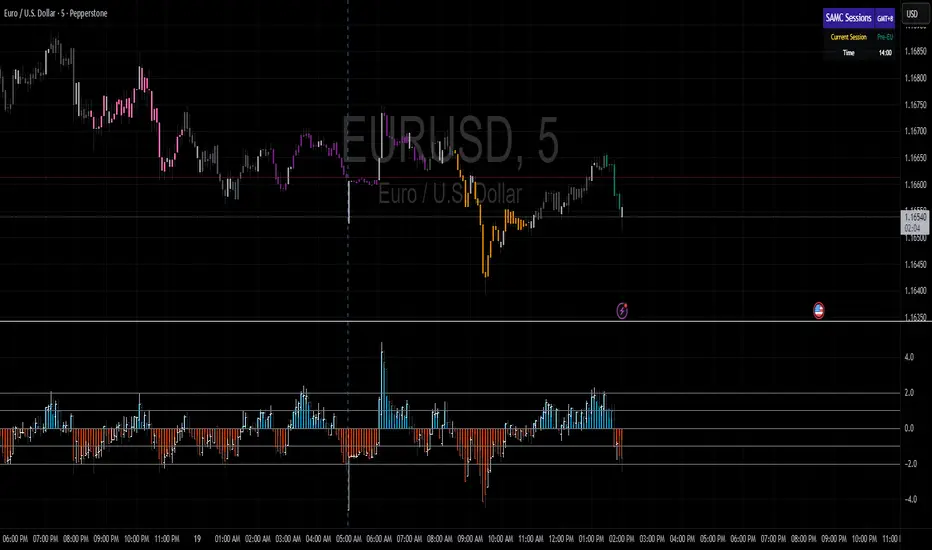
samc's FX SESSIONS - on candles So, based on my 8 yrs of experience and over a 2 decade worth of back testing on FX majors pairs one thing i can univocally affirm to the fact that Timing is everything especially in the currency markets.
so i made this indicator to help reduce the noise and focus on signals which is coded by time,
now i made this as GMT+8 in focus but you can adjust based on your requirements.
I classified my indicator colors according to the inter-SESSION High Impact areas only as following :
Primary session colors:
ASIAN - YELLOW
EU - BLUE
US - Magenta (light)
and every first 10 mins of the hour (Great for scalping)
i marked them in a shade of grey.
secondary sessions i marked them as minor sessions.
PRE-EU 1hr of expected trend i marked in color green
and
after hours in a shade of color violet.
so i usually make my candles into light grey by default and remove the body and wicks to minimize the visual stimulus so that this indicator will work great with both dark and light themes and does not obstruct other indicators.
also i made an option to uncheck my naming scheme of session on the top right.

VSA Auto Signals by ZeeshanThis indicator automatically marks VSA signals (ND, NS, UT, SO) on the chart, filters them with trend + ATR logic, and provides a clean dashboard with alerts for quick decision-making.

Screener based on Profitunity strategy for multiple timeframes
Screener based on Profitunity strategy by Bill Williams for multiple timeframes (max 5, including chart timeframe) and customizable symbol list. The screener analyzes the Alligator and Awesome Oscillator indicators, Divergent bars and high volume bars.
The maximum allowed number of requests (symbols and timeframes) is limited to 40 requests, for example, for 10 symbols by 4 requests of different timeframes. Therefore, the indicator automatically limits the number of displayed symbols depending on the number of timeframes for each symbol, if there are more symbols than are displayed in the screener table, then the ordinal numbers are displayed to the left of the symbols, in this case you can display the next group of symbols by increasing the value by 1 in the "Show tickers from" field, if the "Group" field is enabled, or specify the symbol number by 1 more than the last symbol in the screener table. 👀 When timeframe filtering is applied, the screener table displays only the columns of those timeframes for which the filtering value is selected, which allows displaying more symbols.
For each timeframe, in the "TIMEFRAMES > Prev" field, you can enable the display of data for the previous bar relative to the last (current) one, if the market is open for the requested symbol. In the "TIMEFRAMES > Y" field, you can enable filtering depending on the location of the last five bars relative to the Alligator indicator lines, which are designated by special symbols in the screener table:
⬆️ — if the Alligator is open upwards (Lips > Teeth > Jaw) and none of the bars is closed below the Lips line;
↗️ — if one of the bars, except for the penultimate one, is closed below Lips, or two bars, except for the last one, are closed below Lips, or the Alligator is open upwards only below four bars, but none of the bars is closed below Lips;
⬇️ — if the Alligator is open downwards (Lips < Teeth < Jaw), but none of the bars is closed above Lips;
↘️ — if one of the bars, except the penultimate one, is closed above the Lips, or two bars, except the last one, are closed above the Lips, or the Alligator is open down only above four bars, but none of the bars are closed above the Lips;
➡️ — in other cases, including when the Alligator lines intersect and one of the bars is closed behind the Lips line or two bars intersect one of the Alligator lines.
In the "TIMEFRAMES > Show bar change value for TF" field, you can add a column to the right of the selected timeframe column with the percentage change between the closing price of the last bar (current) and the closing price of the previous bar ((close – previous close) / previous close * 100). Depending on the percentage value, the background color of the screener table cell will change: dark red if <= -3%; red if <= -2%, light red if <= -0.5%; dark green if >= 3%; green if >= 2%; light green if >= 0.5%.
For each timeframe, the screener table displays the symbol of the latest (current) bar, depending on the closing price relative to the bar's midpoint ((high + low) / 2) and its location relative to the Alligator indicator lines: ⎾ — the bar's closing price is above its midpoint; ⎿ — the bar's closing price is below its midpoint; ├ — the bar's closing price is equal to its midpoint; 🟢 — Bullish Divergent bar, i.e. the bar's closing price is above its midpoint, the bar's high is below all Alligator lines, the bar's low is below the previous bar's low; 🔴 — Bearish Divergent bar, i.e. the bar's closing price is below its midpoint, the bar's low is above all Alligator lines, the bar's high is above the previous bar's high. When filtering is enabled in the "TIMEFRAMES > Filtering by Divergent bar" field, the data in the screener table cells will be displayed only for those timeframes that have a Divergent bar. A high bar volume signal is also displayed — 📶/📶² if the bar volume is greater than 40%/70% of the average volume value calculated using a simple moving average (SMA) in the 140 bar interval from the last bar.
In the indicator settings in the "SYMBOL LIST" field, each ticker (for example: OANDA:SPX500USD) must be on a separate line. If the market is closed, then the data for requested symbols will be limited to the time of the last (current) bar on the chart, for example, if the current symbol was traded yesterday, and the requested symbol is traded today, when requesting data for an hourly timeframe, the last bar will be for yesterday, if the timeframe of the current chart is not higher than 1 day. Therefore, by default, a warning will be displayed on the chart instead of the screener table that if the market is open, you must wait for the screener to load (after the first price change on the current chart), or if the highest timeframe in the screener is 1 day, you will be prompted to change the timeframe on the current chart to 1 week, if the screener requests data for the timeframe of 1 week, you will be prompted to change the timeframe on the current chart to 1 month, or switch to another symbol on the current chart for which the market is open (for example: BINANCE:BTCUSDT), or disable the warning in the field "SYMBOL LIST > Do not display screener if market is close".
The number of the last columns with the color of the AO indicator that will be displayed in the screener table for each timeframe is specified in the indicator settings in the "AWESOME OSCILLATOR > Number of columns" field.
For each timeframe, the direction of the trend between the price of the highest and lowest bars in the specified range of bars from the last bar is displayed — ↑ if the trend is up (the highest bar is to the right of the lowest), or ↓ if the trend is down (the lowest bar is to the right of the highest). If there is a divergence on the AO indicator in the specified interval, the symbol ∇ is also displayed. The average volume value is also calculated in the specified interval using a simple moving average (SMA). The number of bars is set in the indicator settings in the "INTERVAL FOR HIGHEST AND LOWEST BARS > Bars count" field.
In the indicator settings in the "STYLE" field you can change the position of the screener table relative to the chart window, the background color, the color and size of the text.
***
Скринер на основе стратегии Profitunity Билла Вильямса для нескольких таймфреймов (максимум 5, включая таймфрейм графика) и настраиваемого списка символов. Скринер анализирует индикаторы Alligator и Awesome Oscillator, Дивергентные бары и бары с высоким объемом.
Максимально допустимое количество запросов (символы и таймфреймы) ограничено 40 запросами, например, для 10 символов по 4 запроса разных таймфреймов. Поэтому в индикаторе автоматически ограничивается количество отображаемых символов в зависимости от количества таймфреймов для каждого символа, если символов больше чем отображено в таблице скринера, то слева от символов отображаются порядковые номера, в таком случае можно отобразить следующую группу символов, увеличив значение на 1 в настройках индикатора поле "Show tickers from", если включено поле "Group", или указать номер символа на 1 больше, чем последний символ в таблице скринера. 👀 Когда применяется фильтрация по таймфрейму, в таблице скринера отображаются только столбцы тех таймфреймов, для которых выбрано значение фильтрации, что позволяет отображать большее количество символов.
Для каждого таймфрейма в настройках индикатора в поле "TIMEFRAMES > Prev" можно включить отображение данных для предыдущего бара относительно последнего (текущего), если для запрашиваемого символа рынок открыт. В поле "TIMEFRAMES > Y" можно включить фильтрацию, в зависимости от расположения последних пяти баров относительно линий индикатора Alligator, которые обозначаются специальными символами в таблице скринера:
⬆️ — если Alligator открыт вверх (Lips > Teeth > Jaw) и ни один из баров не закрыт ниже линии Lips;
↗️ — если один из баров, кроме предпоследнего, закрыт ниже Lips, или два бара, кроме последнего, закрыты ниже Lips, или Alligator открыт вверх только ниже четырех баров, но ни один из баров не закрыт ниже Lips;
⬇️ — если Alligator открыт вниз (Lips < Teeth < Jaw), но ни один из баров не закрыт выше Lips;
↘️ — если один из баров, кроме предпоследнего, закрыт выше Lips, или два бара, кроме последнего, закрыты выше Lips, или Alligator открыт вниз только выше четырех баров, но ни один из баров не закрыт выше Lips;
➡️ — в остальных случаях, в то числе когда линии Alligator пересекаются и один из баров закрыт за линией Lips или два бара пересекают одну из линий Alligator.
В поле "TIMEFRAMES > Show bar change value for TF" можно добавить справа от выбранного столбца таймфрейма столбец с процентным изменением между ценой закрытия последнего бара (текущего) и ценой закрытия предыдущего бара ((close – previous close) / previous close * 100). В зависимости от величины процента будет меняться цвет фона ячейки таблицы скринера: темно-красный, если <= -3%; красный, если <= -2%, светло-красный, если <= -0.5%; темно-зеленый, если >= 3%; зеленый, если >= 2%; светло-зеленый, если >= 0.5%.
Для каждого таймфрейма в таблице скринера отображается символ последнего (текущего) бара, в зависимости от цены закрытия относительно середины бара ((high + low) / 2) и расположения относительно линий индикатора Alligator: ⎾ — цена закрытия бара выше его середины; ⎿ — цена закрытия бара ниже его середины; ├ — цена закрытия бара равна его середине; 🟢 — Бычий Дивергентный бар, т.е. цена закрытия бара выше его середины, максимум бара ниже всех линий Alligator, минимум бара ниже минимума предыдущего бара; 🔴 — Медвежий Дивергентный бар, т.е. цена закрытия бара ниже его середины, минимум бара выше всех линий Alligator, максимум бара выше максимума предыдущего бара. При включении фильтрации в поле "TIMEFRAMES > Filtering by Divergent bar" данные в ячейках таблицы скринера будут отображаться только для тех таймфреймов, где есть Дивергентный бар. Также отображается сигнал высокого объема бара — 📶/📶², если объем бара больше чем на 40%/70% среднего значения объема, рассчитанного с помощью простой скользящей средней (SMA) в интервале 140 баров от последнего бара.
В настройках индикатора в поле "SYMBOL LIST" каждый тикер (например: OANDA:SPX500USD) должен быть на отдельной строке. Если рынок закрыт, то данные для запрашиваемых символов будут ограничены временем последнего (текущего) бара на графике, например, если текущий символ торговался последний день вчера, а запрашиваемый символ торгуется сегодня, при запросе данных для часового таймфрейма, последний бар будет за вчерашний день, если таймфрейм текущего графика не выше 1 дня. Поэтому по умолчанию на графике будет отображаться предупреждение вместо таблицы скринера о том, что если рынок открыт, то необходимо дождаться загрузки скринера (после первого изменения цены на текущем графике), или если в скринере самый высокий таймфрейм 1 день, то будет предложено изменить на текущем графике таймфрейм на 1 неделю, если в скринере запрашиваются данные для таймфрейма 1 неделя, то будет предложено изменить на текущем графике таймфрейм на 1 месяц, или же переключиться на другой символ на текущем графике, для которого рынок открыт (например: BINANCE:BTCUSDT), или отключить предупреждение в поле "SYMBOL LIST > Do not display screener if market is close".
Количество последних столбцов с цветом индикатора AO, которые будут отображены в таблице скринера для каждого таймфрейма, указывается в настройках индикатора в поле "AWESOME OSCILLATOR > Number of columns".
Для каждого таймфрейма отображается направление тренда между ценой самого высокого и самого низкого баров в указанном интервале баров от последнего бара — ↑, если тренд направлен вверх (самый высокий бар справа от самого низкого), или ↓, если тренд направлен вниз (самый низкий бар справа от самого высокого). Если есть дивергенция на индикаторе AO в указанном интервале, то также отображается символ — ∇. В указанном интервале также рассчитывается среднее значение объема с помощью простой скользящей средней (SMA). Количество баров устанавливается в настройках индикатора в поле "INTERVAL FOR HIGHEST AND LOWEST BARS > Bars count".
В настройках индикатора в поле "STYLE" можно изменить положение таблицы скринера относительно окна графика, цвет фона, цвет и размер текста.

Volatility Zones (VStop + Bands) — Fixed (v2)📝 What this indicator is
This script is called “Volatility Zones (VStop + Bands)”.
It is an ATR-based volatility indicator that combines dynamic volatility bands, a Volatility Stop line (VStop), and volatility spike detection into a single tool.
Unlike moving average–based indicators, this tool does not rely on averages of price direction. Instead, it measures the market’s true volatility and reacts to expansions or contractions in price ranges.
________________________________________
⚙️ How it is built
The indicator uses several volatility-based components:
1. Average True Range (ATR)
o ATR is calculated over a user-defined length.
o It measures how much price typically moves in a given number of bars, making it the foundation of this indicator.
2. Volatility Bands
o Upper band = close + ATR × factor
o Lower band = close - ATR × factor
o The area between them is shaded.
o This gives traders an immediate visual sense of market volatility width — wide bands = high volatility, narrow bands = quiet market.
3. Volatility Stop (VStop)
o A stateful trailing stop based on ATR.
o It tracks the highest (or lowest) price in the current trend and places a stop offset by ATR × multiplier.
o When price crosses this stop, the indicator flips trend direction.
o This creates a dynamic stop-and-reverse mechanism that adapts to volatility.
4. Trend Zones
o When the trend is bullish, the stop is green and the chart background is shaded softly green.
o When bearish, the stop is red and the background is shaded softly red.
o This makes the market’s directional bias visually clear at all times.
5. Flip Signals (Buy/Sell Arrows)
o Whenever the VStop flips, arrows appear:
Green BUY arrows below price when the trend turns bullish.
Red SELL arrows above price when the trend turns bearish.
o These are also tied to built-in alerts for automation.
6. Volatility Spike Detection
o The script compares current ATR to its recent average.
o If ATR suddenly expands above a threshold, a small yellow “VOL” marker appears at the top of the chart.
o This highlights potential breakout phases or unusual volatility events.
7. Stop Labels
o At every trend flip, a small label appears at the bar, showing the exact stop level.
o This makes it easy to use the stop as a reference for risk management.
________________________________________
📊 How it works in practice
• When price is above the VStop line, the market is considered in an uptrend.
• When price is below the VStop line, the market is in a downtrend.
• The bands expand/contract with volatility, helping traders gauge risk and position sizing.
• Flip arrows signal when trend direction changes.
• Volatility spikes warn traders that the market is entering a higher-risk phase, often before strong moves.
________________________________________
🎯 How it may help traders
• Trend following → Helps traders identify whether the market is trending up or down.
• Stop placement → Provides a dynamic stop level that adjusts to volatility.
• Volatility awareness → Shaded bands and spike markers show when the market is likely to become unstable.
• Trade timing → Flip arrows and labels help identify potential entry or exit points.
• Risk management → Wide bands indicate higher risk; narrow bands suggest safer, tighter ranges.
________________________________________
🌍 In what markets it is useful
Because the indicator is based purely on volatility, it works across all asset classes and timeframes:
• Stocks & ETFs → Helps identify breakouts and long-term trends.
• Forex → Very useful in spot FX where volatility shifts frequently.
• Crypto → ATR reacts strongly to high volatility, helping traders adapt stops dynamically.
• Futures & Commodities → Great for tracking trending commodities and managing risk.
Scalpers, swing traders, and position traders can all benefit by adjusting the ATR length and multipliers to suit their trading style.
________________________________________
💡 Originality of this script
This is not just a mashup of existing indicators. It integrates:
• ATR-based Volatility Bands for context,
• A stateful Volatility Stop (adapted and rewritten cleanly),
• Flip arrows and labels for actionable trading signals,
• Volatility spike detection to highlight regime shifts.
The result is a comprehensive volatility-aware trading tool that goes beyond just plotting ATR or trend stops.
________________________________________
🔔 Alerts
• Buy Flip → triggers when the trend changes bullish.
• Sell Flip → triggers when the trend changes bearish.
Traders can connect these alerts to automated strategies, bots, or notification systems.

NAS100 Component Sentiment Scanner# NAS100 Component Sentiment Scanner
## 🎯 Overview
The NAS100 Component Sentiment Scanner analyzes the top-weighted stocks in the NASDAQ-100 index to provide real-time bullish/bearish sentiment signals that can help predict NAS100 price movements. This indicator combines multiple technical analysis methods to give traders a comprehensive view of underlying market sentiment.
## 📊 How It Works
The indicator calculates sentiment scores for major NASDAQ-100 components (AAPL, MSFT, NVDA, GOOGL, AMZN, META, TSLA, AVGO, COST, NFLX) using:
- **RSI Analysis**: Identifies overbought/oversold conditions
- **Moving Average Trends**: Compares fast vs slow MA positioning
- **Volume Confirmation**: Validates moves with volume thresholds
- **Price Momentum**: Analyzes recent price direction
- **Market Cap Weighting**: Uses actual NASDAQ-100 weightings for accuracy
## 🚀 Key Features
### Real-Time Sentiment Analysis
- Weighted composite score based on individual stock analysis
- Color-coded sentiment line (Green = Bullish, Red = Bearish)
- Dynamic background coloring for strong signals
### Interactive Data Table
- Shows individual stock scores and signals
- Bullish/Bearish stock count summary
- Customizable position and size
### Smart Signal System
- **Bullish Signals**: Green triangle up when sentiment crosses threshold
- **Bearish Signals**: Red triangle down when sentiment falls below threshold
- **Alert Conditions**: Automatic notifications for signal changes
## ⚙️ Customization Options
### Technical Analysis Settings
- **RSI Period**: Adjust lookback period (default: 14)
- **RSI Levels**: Set overbought/oversold thresholds
- **Moving Averages**: Configure fast/slow MA periods
- **Volume Threshold**: Set volume confirmation multiplier
### Signal Thresholds
- **Bullish/Bearish Levels**: Customize trigger points
- **Strong Signal Levels**: Set extreme sentiment thresholds
- Fine-tune sensitivity to market conditions
### Display Options
- **Toggle Table**: Show/hide sentiment data table
- **Table Position**: 6 position options (Top/Bottom/Middle + Left/Right)
- **Table Size**: Choose from Tiny, Small, Normal, or Large
- **Background Colors**: Enable/disable signal backgrounds
- **Signal Arrows**: Show/hide buy/sell indicators
### Stock Selection
- **Individual Control**: Enable/disable any of the 10 major stocks
- **Dynamic Weighting**: Automatically adjusts calculations based on selected stocks
- **Flexible Analysis**: Focus on specific sectors or market leaders
## 📈 How to Use
### 1. Basic Setup
1. Add the indicator to your NAS100 chart
2. Default settings work well for most traders
3. Observe the sentiment line and signals
### 2. Signal Interpretation
- **Score > 30**: Bullish bias for NAS100
- **Score > 50**: Strong bullish signal
- **Score -30 to 30**: Neutral/consolidation
- **Score < -30**: Bearish bias for NAS100
- **Score < -50**: Strong bearish signal
### 3. Trading Strategies
**Trend Following:**
- Buy NAS100 when bullish signals appear
- Sell/short when bearish signals trigger
- Use background colors for quick visual confirmation
**Divergence Trading:**
- Watch for sentiment/price divergences
- Strong sentiment with weak NAS100 price = potential breakout
- Weak sentiment with strong NAS100 price = potential reversal
**Consensus Trading:**
- Monitor bullish/bearish stock counts in table
- 8+ stocks aligned = strong directional bias
- Mixed signals = wait for clearer consensus
### 4. Advanced Usage
- Combine with your existing NAS100 trading strategy
- Use multiple timeframes for confirmation
- Adjust thresholds based on market volatility
- Focus on specific stocks by disabling others
## 🔔 Alert Setup
The indicator includes built-in alert conditions:
1. Go to TradingView Alerts
2. Select "NAS100 Component Sentiment Scanner"
3. Choose from available alert types:
- NAS100 Bullish Signal
- NAS100 Bearish Signal
- Strong Bullish Consensus
- Strong Bearish Consensus
## 💡 Pro Tips
### Optimization
- **High Volatility**: Increase signal thresholds (±40, ±60)
- **Low Volatility**: Decrease thresholds (±20, ±40)
- **Day Trading**: Use smaller table, focus on real-time signals
- **Swing Trading**: Enable background colors, larger thresholds
### Best Practices
- Don't use as a standalone system - combine with price action
- Check individual stock table for context
- Monitor during market open for most reliable signals
- Consider earnings seasons for individual stock impacts
### Market Conditions
- **Trending Markets**: Higher accuracy, use with trend following
- **Ranging Markets**: Watch for false signals, increase thresholds
- **News Events**: Individual stock news can skew sentiment temporarily
## 🎨 Visual Guide
- **Green Line Above Zero**: Bullish sentiment building
- **Red Line Below Zero**: Bearish sentiment building
- **Background Color Changes**: Strong signal confirmation
- **Triangle Arrows**: Entry/exit signal points
- **Table Colors**: Quick sentiment overview
## ⚠️ Important Notes
- This indicator analyzes component stocks, not NAS100 directly
- Market cap weightings approximate real NASDAQ-100 weightings
- Sentiment can change rapidly during volatile periods
- Always use proper risk management
- Combine with other technical analysis tools
## 🔧 Troubleshooting
- **No signals**: Check if thresholds are too extreme
- **Too many signals**: Increase threshold sensitivity
- **Table not showing**: Ensure "Show Sentiment Table" is enabled
- **Missing stocks**: Verify individual stock toggles in settings
---
**Suitable for**: Day traders, swing traders, NAS100 specialists, index traders
**Best Timeframes**: 5min, 15min, 1H, 4H
**Market Sessions**: US market hours for highest accuracy

HA • EMA9/21 • Daily VWAP – Fixed Signals (v6)HA • EMA9/21 • Daily VWAP – Fixed Signals (v6)
Heikin Ashi EMA 9/21 + Daily VWAP Setup Indicator
Description
This indicator combines three proven concepts into one clean and practical trading tool:
Heikin Ashi Candles → smooth out price action and highlight trends more clearly.
EMA 9/21 → a classic momentum and trend filter.
Daily VWAP (Volume Weighted Average Price) → widely used by professionals as dynamic support and resistance.
How it works
Long Signal:
Triggered when Heikin Ashi turns bullish, EMA 9 is above EMA 21, and price crosses above the Daily VWAP.
Short Signal:
Triggered when Heikin Ashi turns bearish, EMA 9 is below EMA 21, and price crosses below the Daily VWAP.
For every signal the indicator automatically draws Entry, Stop-Loss, and Take-Profit levels directly on the chart:
Entry = price at the signal bar
Stop-Loss (SL) = recent swing low/high or ATR-based (configurable)
Take-Profit (TP) = calculated using the chosen Risk/Reward ratio
Features
✅ Instant signals (no repainting)
✅ Fixed horizontal lines for Entry, SL, and TP extending to the right side of the chart
✅ Customizable Risk/Reward ratio (default: 1.5)
✅ Choice between Swing-based or ATR-based stop-loss
✅ Alerts for both Long and Short signals
✅ Clean chart visualization without clutter
Use case
This tool is designed for traders who want clear, rule-based setups.
It provides easy-to-spot signals that can be used for manual trading, journaling, and backtesting.
⚠️ Note: This is not an automated trading strategy. Always confirm signals with your own analysis and apply proper risk management.