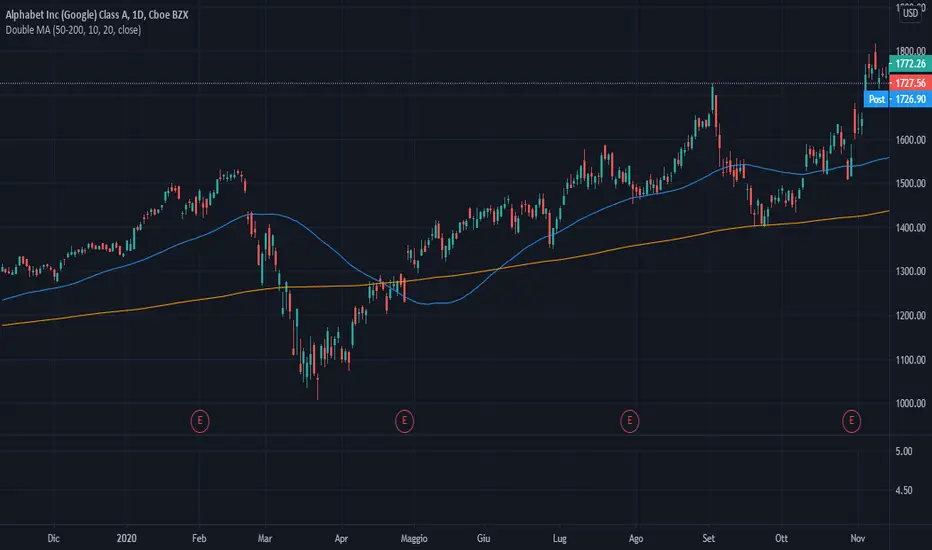
Double Moving AverageWith this script you can view TWO moving average with ONE indicator (really helpful if you have the limit of four indicator in the chart).
It is very simple to use:
1) In "Preset" you can choose between three standard pairs (7-21, 11-22, 50-200) or "Custom".
2) The parameters "Custom M1" and "Custom M2" only work if "Custom Preset" is selected, otherwise they are IGNORED.
ค้นหาในสคริปต์สำหรับ "电力行业+股票+11年涨幅"
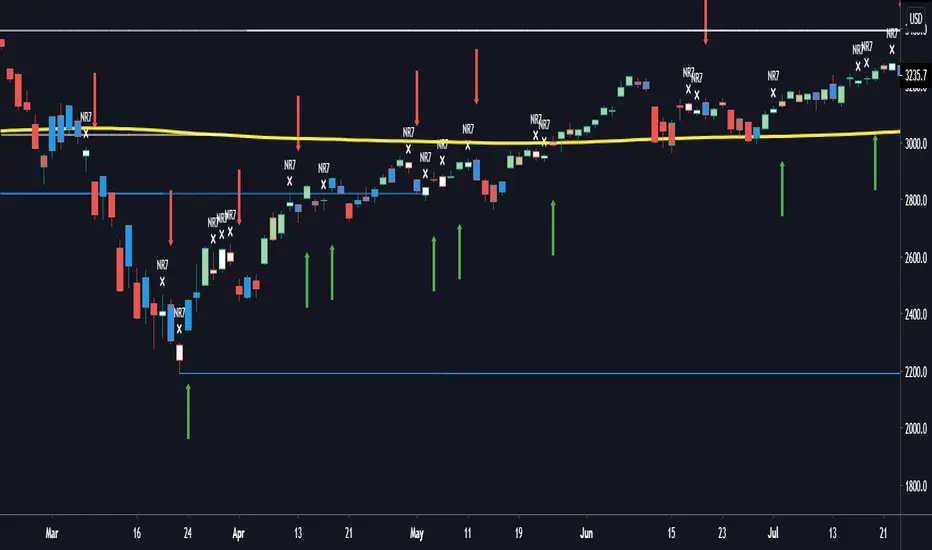
NR7 Indicator Based on Thomas Bulkowski's TheoriesThis NR7 indicator was built on the concept by Thomas Bulkowski and his ThePatternSite. NR7 is based on high to low price range (true range) that is the smallest of the prior 6 days (7 days total), when one NR7 shows, it means that today's candle body (low to high) is the narrowest of the past 7 days. Then if the current close is higher than the NR7's high, we call it a bullish breakout; and if the current close is lower than the NR7's low, we call it a bearish breakout. Regardless the direction, once the current close price goes above or below the high or low of the NR7 candle, we call it a "breakout" in this strategy. Bulkowski suggested on his website that only gave 7 calendar days (NOT trading days) for the symbol to breakout after NR7 occurs, and if the underlying asset does not breakout within 7 calendar days after one NR7 occurs, we would abandon this NR7 signal and start recounting again.
Since most securities/indexes do not trade on the weekends and have no data available, I switched 7 calendar days breakout limit to 5 trading days breakout limit, which will work on most assets. However, if you are trading cryptocurrencies or forex which have data on the weekends, feel free to add 2 more days to finish the NR7 count, all you have to do is to add "Buy6", "Buy7", "Sell6" and "Sell7" under line 11 and line 17, then add the senarioes under those "if" statements.
Every "NR7" will show up on the chart with a cross symbol and text next to it, then green arrowups show bullish signals and red arrowdowns show bearish signals. Bulkowski also added a "CPI" index on his NR7 strategy, this indicator does not include that "CPI equation" for simplicity purposes and other time frame tradings other than just weekly signals. Please like and share this script, let me know if any questions, thanks!
[blackcat] L2 Ehlers Adaptive BandPass FilterLevel: 2
Background
John F. Ehlers introduced Adaptive BandPass Filter in his "Cycle Analytics for Traders" chapter 11 on 2013.
Function
Adaptive band-pass filter was designed. It just makes since to tune that filter to the measured dominant cycle to eliminate all the other frequency components that are of no interest. Here, the adaptive band-pass indicator starts with the computation of the dominant cycle using the autocorrelation periodogram approach.
One way to make a band-pass filter have a leading phase capability is to tune the filter to a period shorter than the period of the cycle being measured. In this case, the bandwidth of filter is set to 0.3. That is 30 percent of the tuned center period. Therefore, the half bandwidth is 15 percent. We tune the filter to be 10 percent toward the shorter period from the dominant cycle period to provide the phase lead while still having the data of interest be within the filter bandwidth. This provides a phase lead of the dominant cycle to be something on the order of 60 degrees, or one-sixth of a cycle. If the dominant cycle were 18 bars, for example, then the detuning of the filter would produce a 3-bar lead. This leading function is not huge, but it is significant.
A convenient trigger line is included in the adaptive band-pass filter to signal the more highly likely buy and sell points. The trigger is compute as 90 percent of the amplitude of the adaptive band-pass filter line and is delayed by one bar. While the line crossings occur after the peak of the band-pass filter, phase lead provides for the generation of a timely signal. Significant trading signals should also include the criteria that the line crossing occur at greater than the +0.7 and less than the −0.7 reference lines.
Key Signal
DominantCycle --> Dominant Cycle signal
Signal --> Adaptive BandPass Filter signal
Trigger --> lag version of Adaptive BandPass Filter sinal
LeadSignal --> Adaptive BandPass Filter Lead signal
Trigger2 --> lag version of Adaptive BandPass Filter Lead sinal
Pros and Cons
100% John F. Ehlers definition translation of original work, even variable names are the same. This help readers who would like to use pine to read his book. If you had read his works, then you will be quite familiar with my code style.
Remarks
The 54th script for Blackcat1402 John F. Ehlers Week publication.
Readme
In real life, I am a prolific inventor. I have successfully applied for more than 60 international and regional patents in the past 12 years. But in the past two years or so, I have tried to transfer my creativity to the development of trading strategies. Tradingview is the ideal platform for me. I am selecting and contributing some of the hundreds of scripts to publish in Tradingview community. Welcome everyone to interact with me to discuss these interesting pine scripts.
The scripts posted are categorized into 5 levels according to my efforts or manhours put into these works.
Level 1 : interesting script snippets or distinctive improvement from classic indicators or strategy. Level 1 scripts can usually appear in more complex indicators as a function module or element.
Level 2 : composite indicator/strategy. By selecting or combining several independent or dependent functions or sub indicators in proper way, the composite script exhibits a resonance phenomenon which can filter out noise or fake trading signal to enhance trading confidence level.
Level 3 : comprehensive indicator/strategy. They are simple trading systems based on my strategies. They are commonly containing several or all of entry signal, close signal, stop loss, take profit, re-entry, risk management, and position sizing techniques. Even some interesting fundamental and mass psychological aspects are incorporated.
Level 4 : script snippets or functions that do not disclose source code. Interesting element that can reveal market laws and work as raw material for indicators and strategies. If you find Level 1~2 scripts are helpful, Level 4 is a private version that took me far more efforts to develop.
Level 5 : indicator/strategy that do not disclose source code. private version of Level 3 script with my accumulated script processing skills or a large number of custom functions. I had a private function library built in past two years. Level 5 scripts use many of them to achieve private trading strategy.
[blackcat] L2 Ehlers Adaptive CCI 2013Level: 2
Background
John F. Ehlers introduced Adaptive CCI 2013 in his "Cycle Analytics for Traders" chapter 11 on 2013.
Function
The time length to be used for the channel in the calculations is widely varied in the literature. In all cases, the length is rather arbitrarily established to fit the indicator to some preconceived event. It seems to me that it would be better to use one full period of the dominant cycle as the length of data to be used.
The adaptive CCI indicator starts with the computation of the dominant cycle using the autocorrelation periodogram approach. The identification of the indicator itself is noted by the comment near the end following the dominant cycle calculation. Since the objective is to use only those frequency components passed by the roofing filter, the variable Filt is used as a data input rather than the average of the high, low, and close as was done by Donald Lambert (Inventor of CCI).
Key Signal
DominantCycle --> Dominant Cycle signal
MyCCI --> Adaptive CCI signal
Trigger --> lag version of Adaptive CCI signal
Pros and Cons
100% John F. Ehlers definition translation of original work, even variable names are the same. This help readers who would like to use pine to read his book. If you had read his works, then you will be quite familiar with my code style.
Remarks
The 53th script for Blackcat1402 John F. Ehlers Week publication.
Readme
In real life, I am a prolific inventor. I have successfully applied for more than 60 international and regional patents in the past 12 years. But in the past two years or so, I have tried to transfer my creativity to the development of trading strategies. Tradingview is the ideal platform for me. I am selecting and contributing some of the hundreds of scripts to publish in Tradingview community. Welcome everyone to interact with me to discuss these interesting pine scripts.
The scripts posted are categorized into 5 levels according to my efforts or manhours put into these works.
Level 1 : interesting script snippets or distinctive improvement from classic indicators or strategy. Level 1 scripts can usually appear in more complex indicators as a function module or element.
Level 2 : composite indicator/strategy. By selecting or combining several independent or dependent functions or sub indicators in proper way, the composite script exhibits a resonance phenomenon which can filter out noise or fake trading signal to enhance trading confidence level.
Level 3 : comprehensive indicator/strategy. They are simple trading systems based on my strategies. They are commonly containing several or all of entry signal, close signal, stop loss, take profit, re-entry, risk management, and position sizing techniques. Even some interesting fundamental and mass psychological aspects are incorporated.
Level 4 : script snippets or functions that do not disclose source code. Interesting element that can reveal market laws and work as raw material for indicators and strategies. If you find Level 1~2 scripts are helpful, Level 4 is a private version that took me far more efforts to develop.
Level 5 : indicator/strategy that do not disclose source code. private version of Level 3 script with my accumulated script processing skills or a large number of custom functions. I had a private function library built in past two years. Level 5 scripts use many of them to achieve private trading strategy.
[blackcat] L2 Ehlers Adaptive RSI 2013Level: 2
Background
John F. Ehlers introduced Adaptive RSI 2013 in his "Cycle Analytics for Traders" chapter 11 on 2013.
Function
The adaptive RSI starts with the computation of the dominant cycle using the autocorrelation periodogram approach. The identification of the RSI indicator itself following the dominant cycle calculation is noted by the comment near the end. Since the objective is to use only those frequency components passed by the roofing filter, the variable Filt is used as a data input rather than closing prices. Rather than independently taking the averages of the numerator and denominator, Dr. Ehlers chose to perform smoothing on the ratio using the SuperSmoother filter. The coefficients for the SuperSmoother filters have previously been computed in the dominant cycle measurement part of the code.
Key Signal
DominantCycle --> Dominant Cycle signal
MyRSI --> Adaptive RSI signal
Trigger --> lag version of Adaptive RSI signal
Pros and Cons
100% John F. Ehlers definition translation of original work, even variable names are the same. This help readers who would like to use pine to read his book. If you had read his works, then you will be quite familiar with my code style.
Remarks
The 52th script for Blackcat1402 John F. Ehlers Week publication.
Courtesy of @RicardoSantos for RGB functions.
Readme
In real life, I am a prolific inventor. I have successfully applied for more than 60 international and regional patents in the past 12 years. But in the past two years or so, I have tried to transfer my creativity to the development of trading strategies. Tradingview is the ideal platform for me. I am selecting and contributing some of the hundreds of scripts to publish in Tradingview community. Welcome everyone to interact with me to discuss these interesting pine scripts.
The scripts posted are categorized into 5 levels according to my efforts or manhours put into these works.
Level 1 : interesting script snippets or distinctive improvement from classic indicators or strategy. Level 1 scripts can usually appear in more complex indicators as a function module or element.
Level 2 : composite indicator/strategy. By selecting or combining several independent or dependent functions or sub indicators in proper way, the composite script exhibits a resonance phenomenon which can filter out noise or fake trading signal to enhance trading confidence level.
Level 3 : comprehensive indicator/strategy. They are simple trading systems based on my strategies. They are commonly containing several or all of entry signal, close signal, stop loss, take profit, re-entry, risk management, and position sizing techniques. Even some interesting fundamental and mass psychological aspects are incorporated.
Level 4 : script snippets or functions that do not disclose source code. Interesting element that can reveal market laws and work as raw material for indicators and strategies. If you find Level 1~2 scripts are helpful, Level 4 is a private version that took me far more efforts to develop.
Level 5 : indicator/strategy that do not disclose source code. private version of Level 3 script with my accumulated script processing skills or a large number of custom functions. I had a private function library built in past two years. Level 5 scripts use many of them to achieve private trading strategy.

Triple EMA Scalper low lag stratHi all,
This strategy is based on the Amazing scalper for majors with risk management by SoftKill21
The change is in lines 11-20 where the sma's are replaced with Triple ema's to
lower the lag.
The original author is SoftKill21. His explanation is repeated below:
Best suited for 1M time frame and majors currency pairs.
Note that I tried it at 3M time frame.
Its made of :
Ema ( exponential moving average ) , long period 25
Ema ( exponential moving average ) Predictive, long period 50,
Ema ( exponential moving average ) Predictive, long period 100
Risk management , risking % of equity per trade using stop loss and take profits levels.
Long Entry:
When the Ema 25 cross up through the 50 Ema and 100 EMA . and we are in london or new york session( very important the session, imagine if we have only american or european currencies, its best to test it)
Short Entry:
When the Ema 25 cross down through the 50 Ema and 100 EMA , and we are in london or new york session( very important the session, imagine if we have only american or european currencies, its best to test it)
Exit:
TargetPrice: 5-10 pips
Stop loss: 9-12 pips

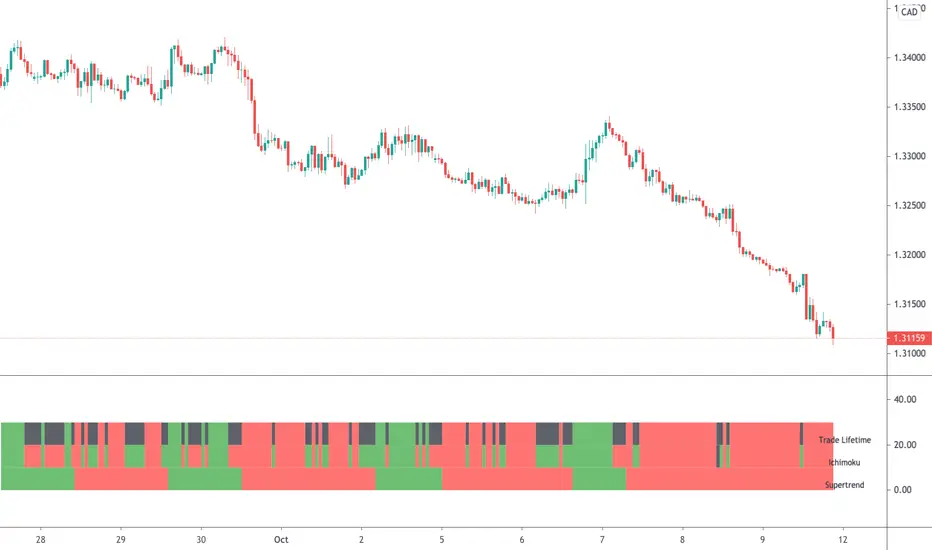
Ichimoku & Supertrend Combined StrategyOne of my mixed approach strategy indicators which include's:
- Ichimoku using much faster settings. (ECC-11)
- Supertrend
Whilst both Supertrend and Ichimoku are quite reliable, they do sometimes provide false signals. By combining both indicators, trading when both agree, it reduces the number of false alerts.
Using this indicator is simple. If the lifetime line is green then buy. If red then sell and when black don't trade. So...
Green Line - This strategy is in a buy position
Red Line - This strategy is in a sell position
Black Line - DON'T TRADE
The trader's approach is simple, when all indicators are green or red, then take the trade. As soon as one indicator changes, then re-evaluate using your normal process, such as price action, to determine whether to close the trade or continue.
There are also some alerts for opening and closing positions.
If you wish to make some changes or discuss, please don't hesitate to message me.
LBR 3-10 OscillatorThis is a variation of MACD popularised by Linda Bradford Raschke. Instead of the regular MACD settings, the this indicator uses simple moving averages, not exponential moving averages, and a setting of 3 for the fast MA, 10 for the slow MA and 16 for the signal line.
The signal line (red) acts as a trend indicator, with crossings of the zero line indicating trend changes, while the MACD line (blue) acts as a short term momentum indicator.
Setups:
- First cross: This is basically selling or buying at the first pullback after a trend change. Buy or sell after the signal line has crossed the zero line and the MACD crosses the signal line for the first time after the trend change. Use price action to time the entry after the pullback — you don't need to wait for the MACD to cross the signal line again.
- Pullback in a trend: The MACD crosses the signal line in the opposite direction of the trend irregardless of when the trend change occurred. Use price action to time the entry.
- Divergence: The MACD line shows a pattern diverging form price (e.g. makes higher lows whereas price makes lower lows). This can be an indication of trend reversal or waning.
In the indicator's input panel there is an option for showing standard deviation bands (turned off by default). MACD line crossing the standard deviation bands can indicate oversold and overbought conditions.
The indicator comes with the following alerts:
- First cross downtrend
- First cross uptrend
- Pullback in downtrend
- Pullback in uptrend
- Trend change down
- Trend change up
Sources:
lindaraschke.net
www.netpicks.com

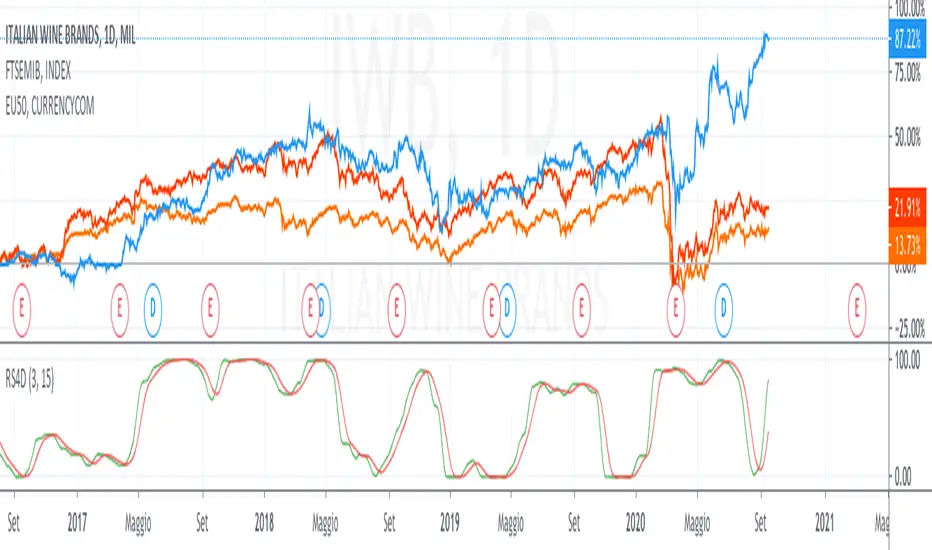
Relative Strength 4DimensionIn the S&C September 2020 article “Tracking Relative Strength In Four Dimensions”, James Garofallou presents a metric for evaluating a security’s strength relative to 11 major market sectors and over several time periods. All this information is squeezed into a single value. Maybe at cost of losing other important information? In this article we’ll look into how to program such a beast, and how it fares when we use it for rebalancing a stock portfolio.
This is a redesigned version for an european point of view.
I used 10 index for the comparison.
feel free to tip me ;-)
Daytrader strategies for major currenciesHello,
This technique is for those who want the most simple method that is almost fool-proof. It must be done only during the busiest trading hours, 3 am to 11 am EST. This method doesn't work in sideways markets, only in volatile trending markets.
Indicators:
Ema 3
MA 20
Awesome Oscillator.
Enter Long: when the red 3 EMA has crossed up through the middle band at the same time, the AO should be approaching or crossing it's zero line, going up.
Enter Short: when the red 3 EMA has crossed down through the middle band at the same time, the AO should be approaching or crossing it's zero line, going down.
In this strategy, both the entry and exit happen only during the london session.

Matrix functions - JD/////////////////////////////////////////////////////////////////////////////////////////////////////////////////
// The arrays provided in Pinescript are linear 1D strucures that can be seen either as a large vertical stack or
// a horizontal row containing a list of values, colors, bools,..
//
// With the FUNCTIONS in this script the 1D ARRAY LIST can be CONVERTED INTO A 2D MATRIX form
//
//
///////////////////////////////////////////
/// BASIC INFO ON THE MATRIX STRUCTURE: ///
///////////////////////////////////////////
//
// The matrix is set up as an 2D structure and is devided in ROWS and COLUMNS.
// following the standard mathematical notation:
//
// a 3 x 4 matrix = 4 columns
// 0 1 2 3 column index
// 0
// 3 rows 1
// 2
// row
// index
//
// With the use of some purpose-built functions, values can be placed or retrieved in a specific column of a certain row
// this can be done by intuitively using row_nr and column_nr coördinates,
// without having to worry on what exact index of the Pine array this value is located (the functions do these conversions for you)
//
//
// the syntax I propose for the 2D Matrix array has the following structure:
//
// - the array starts with 2 VALUES describing the DIMENSION INFORMATION, (rows, columns)
// these are ignored in the actual calculations and serve as a metadata header (similar to the "location, time,... etc." data that is stored in photo files)
// so the array always carries it's own info about the nr. of rows and columns and doesn't need is seperate "info" file!
//
// To stay consistent with the standard Pinescript (array and ) indexing:
// - indexes for sheets and columns start from 0 (first) and run up to the (total nr of sheets or columns) - 1
// - indexes for rows also start from 0 (most recent, cfr. ) and run up to the (total nr of rows) - 1
//
// - this 2 value metadata header is followed by the actual df data
// the actual data array can consist of (100,000 - 2) usable items,
//
// In a theoretical example, you can have a matrix with almost 20,000 rows with each 5 columns of data (eg. open, high, low, close, volume) in it!!!
//
//
///////////////////////////////////
/// SCHEMATIC OF THE STRUCTURE: ///
///////////////////////////////////
//
////// (metadata header with dimensions info)
//
// (0) (1) (array index)
//

The Lazy Trader - Index (ETF) Trend Following Robot50/150 moving average, index (ETF) trend following robot. Coded for people who cannot psychologically handle dollar-cost-averaging through bear markets and extreme drawdowns (although DCA can produce better results eventually), this robot helps you to avoid bear markets. Be a fair-weathered friend of Mr Market, and only take up his offer when the sun is shining! Designed for the lazy trader who really doesn't care...
Recommended Chart Settings:
Asset Class: ETF
Time Frame: Daily
Necessary ETF Macro Conditions:
a) Country must have healthy demographics, good ratio of young > old
b) Country population must be increasing
c) Country must be experiencing price-inflation
Default Robot Settings:
Slow Moving Average: 50 (integer) //adjust to suit your underlying index
Fast Moving Average: 150 (integer) //adjust to suit your underlying index
Bullish Slope Angle: 5 (degrees) //up angle of moving averages
Bearish Slope Angle: -5 (degrees) //down angle of moving averages
Average True Range: 14 (integer) //input for slope-angle formula
Risk: 100 (%) //100% risk means using all equity per trade
ETF Test Results (Default Settings):
SPY (1993 to 2020, 27 years), 332% profit, 20 trades, 6.4 profit factor, 7% drawdown
EWG (1996 to 2020, 24 years), 310% profit, 18 trades, 3.7 profit factor, 10% drawdown
EWH (1996 to 2020, 24 years), 4% loss, 26 trades, 0.9 profit factor, 36% drawdown
QQQ (1999 to 2020, 21 years), 232% profit, 17 trades, 3.6 profit factor, 2% drawdown
EEM (2003 to 2020, 17 years), 73% profit, 17 trades, 1.1 profit factor, 3% drawdown
GXC (2007 to 2020, 13 years), 18% profit, 14 trades, 1.3 profit factor, 26% drawdown
BKF (2009 to 2020, 11 years), 11% profit, 13 trades, 1.2 profit factor, 33% drawdown
A longer time in the markets is better, with the exception of EWH. 6 out of 7 tested ETFs were profitable, feel free to test on your favourite ETF (default settings) and comment below.
Risk Warning:
Not tested on commodities nor other financial products like currencies (code will not work), feel free to leave comments below.
Moving Average Slope Angle Formula:
Reproduced and modified from source:

Price breaksThis indicator displays the High/Low/Close of the previous day/week/month as horizontal lines. Of course, everything is configurable but to keep it simple and non-intrusive it only displays:
month's H/L/C levels on D time frame (drawn as circles)
week's levels on 4h (as crosses)
day's levels on 1h (as line)
These levels act as support / resistance over and over again, see current (08/24/2020) BTCUSD chart, the previous month's close (blue circles) did act as support and held on 08/11, also prev month's high (red circles) was not broken on 08/21. Once these levels break we might see lower prices but so far both of them act as good support to consider.

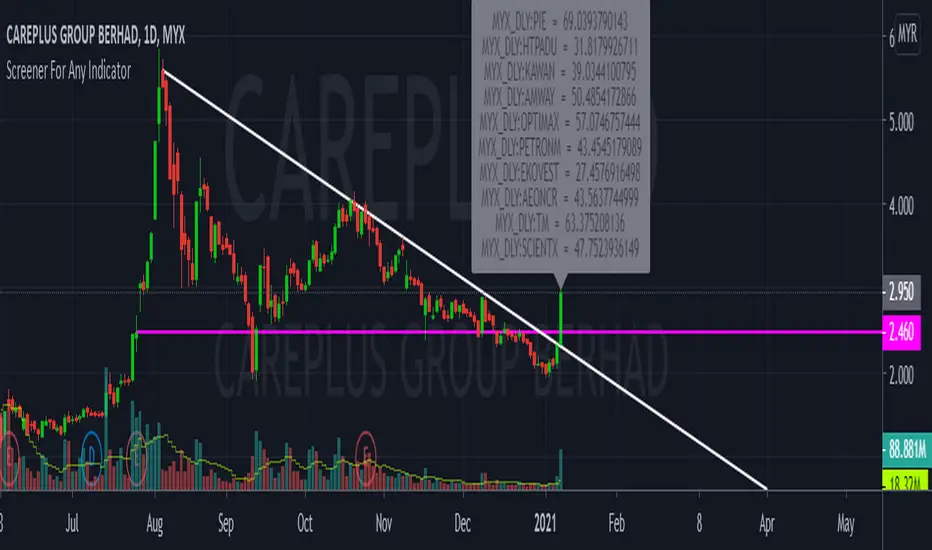
CustomScreenerTo apply your indicator with screener , please modify the section which i mention "Start your indicator pine script" & "End your indicator pine script"
At the pinescript section you will able to change the ticket symbol .
I only able to show screener result with 10 item in 1 times . To view more result, please go to setting and change stock list "1-10">"11,20">"21-30".....
Able to screener 100 items with this indicator.
Kindly change the exchange and stock in the pinescript according your watchlist.
As examples, my indicator is to determine the stock in which trend, i want to find out all stock with aqua color trend
The screener result show only 9 of 10 are in aqua color trend.
Elder-Keltner-Impulse-MA Study by STTAStudy Name: Elder-Keltner-Impulse-MA Study by STTA
English:
This indicator shows in a combined way three Keltner Channels with EMA21 and multiplier 1,3,5, the Elder Impulse System and a short EMA 11 to recognize the valuation zone, according to various strategies of Dr. Alexander Elder.
This indicator can be applied on all symbols.
Inputs: displayed symbol
Settings:
Elder Force Index (EFI)
-EIF MACD Length
-EIF MACD Slow Length
-EIF MACD Signal Length
-EIF EMA Length
EMA Short Length
Keltner Channels (KC)
-KC MA Length
-KC Multiplier1-3
-KC Source
-KC Type
-KC Bands Style
Outputs:
-EIF Bar Colors
-KC Upper1-3 channel upper and lower Lines
-MA Short

Line breakI decided to help TradingView programmers and wrote code that converts a standard candles / bars to a line break chart. The built-in linebreak() and security() functions for constructing a Linear Break chart are bad, the chart is not built correctly, and does not correspond to the Line Breakout chart built into TradingView. I’m talking about simulating the Linear Break lines using the plotcandle() annotation, because these are the same candles without shadows. When you try to use the market simulator, when the gaps are turned on in the security() function, nothing is added to the chart, and when turned off, a completely different line break chart is drawn. Do not try to write strategies based on the built-in linebreak() function! The developers write in the manual: "Please note that you cannot plot Line Break boxes from Pine script exactly as they look. You can only get a series of numbers similar to OHLC values for Line Break charts and use them in your algorithms." However, it is possible to build a “Linear Breakthrough” chart exactly like the “Linear Breakthrough" chart built into TradingView. Personally, I had enough Pine Script functionality.
For a complete understanding of how such a graph is built, you can refer to Steve Nison's book “BEYOND JAPANESE CANDLES” and see the instructions for creating a “Three-Line Breakthrough” chart (the number of lines for a breakthrough is three):
Rule 1: if today's price is above the base price (closing the first candle), draw a white line from the base price to the new maximum price (before closing).
or Rule 2: if today's price is below the base price, draw a black line from the base price to the new low of prices (before closing).
Rule 3: if today's price is no different from the base, do not draw any line.
Rule 4: if today's price rises above the maximum of the first line, shift to the column to the right and draw a new white line from the previous maximum to the new maximum of prices.
Rule 5: if the price is below the low of the first line, move one column to the right and draw a new black line down from the previous low to the new low of prices.
Rule 6: if the price is kept in the range of the first line, nothing is applied to the chart.
Rule 7: if the market reaches a new maximum, surpassing the maximum of previous lines, move to the column to the right and draw a new white line up to a new maximum.
Rule 8: if today's price is below the low of previous lines (i.e. there is a new low), move to the right column and draw a new black line down to a new low.
Rule 9: if the price is in the range of the first two lines, nothing is applied to the chart.
Rule 10: if there is a series of three white lines, a new white line is drawn when a new maximum is reached (even if it is only one tick higher than the old one). Under the same conditions, for drawing a black reversal line, the price should fall below the minimum of the series of the last three white lines. Such a black line is called a black reversal line. It runs from the base of the highest white line to a new low of price.
Rule 11: if there is a series of three black lines, a new black line is drawn when a new minimum is reached. Under the same conditions, for drawing a white line, called a white reversal line, the price must exceed the maximum of the previous three black lines. This line is drawn from the top of the lowest black line to a new high of the price.
So, the script was not small, but the idea is extremely simple: if you need to break n lines to build a line, then among these n lines (or less, if this is the beginning of the chart), the maximum or minimum of closures and openings will be searched. If the current candles closed above or below these highs or lows, then a new line is added to the chart on the current candles (trend or breakout). According to my observations, this script draws a chart that is completely identical to the Line Breakout chart built into TradingView, but of course with gaps, as there is time in the candles / bar chart. I stuffed all the logic into a wrapper in the form of the get_linebreak() function, which returns a tuple of OHLC values. And these series with the help of the plotcandle() annotation can be converted to the "Linear Breakthrough" chart. I also want to note that with a large number of candles on the chart, outrages about the buffer size uncertainty are heard from the TradingView black box. Because of this, in the annotation study() set the value to the max_bars_back parameter.
In general, use it (for example, to write strategies)!
Prevous High & Low by Period + NY Zone
This is based on various example code and research done to try and help using the free ICT OTE Pattern on the NY 08:30 to 11:00 am
I tried to make this work on multiple time frames and settings but its best below 8hr
Legend (some of these are for fun and working examples)
RED BG color = Sunday Trading
MAROON STAR = Experiment in significant movement over the last 3 bars
Blue X = Engulfing Candle Marker
I have used this script as a building basis and research contributed by various sources on the internet. Its for learning purposes and helping to draw some lines.

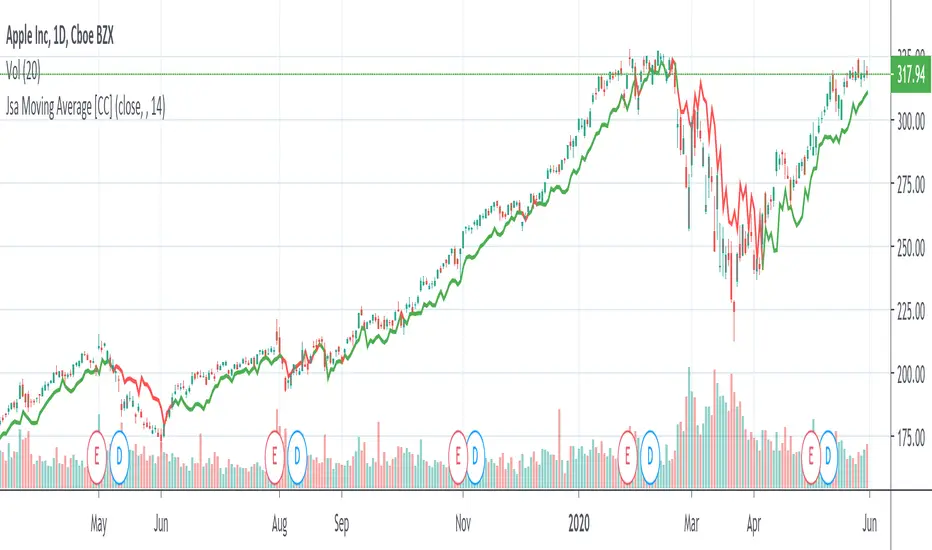
Jsa Moving Average [CC]The Jsa Moving Average was created by George R. Arrington, Ph .D. (Stocks & Commodities V. 11:10 (427-431)) and it is an extremely simple formula but has very many great uses. For one thing it acts as support and resistance levels and it also acts like a trailing stop. It gives a wide enough berth during extended up or down trends to let you ride the wave up or down and when it gets close to the price it means that it is a choppy market. Buy when the indicator line is green and sell when it turns red.
Let me know if you would like to see me publish other indicators or if you want something custom done!
Note: I'm republishing this because the original script couldn't be found in searches so this will fix that.
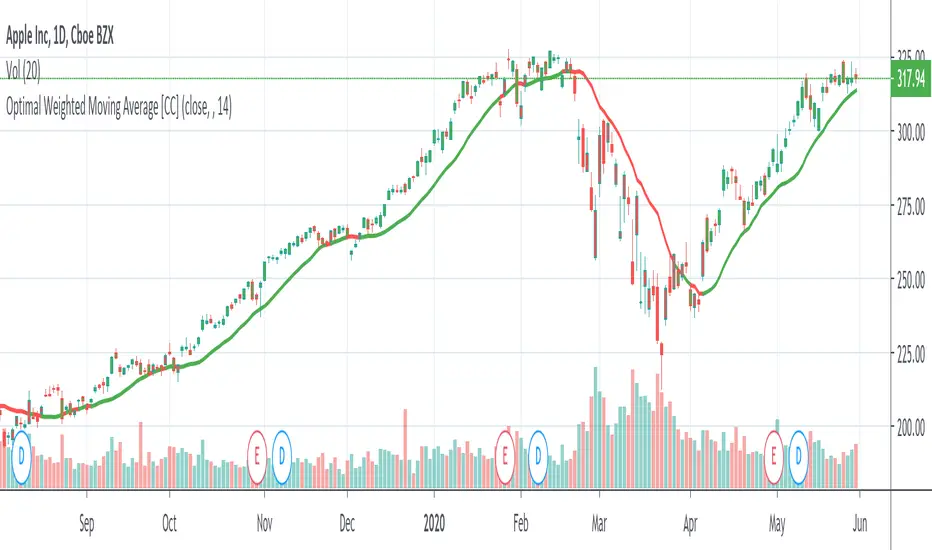
Optimal Weighted Moving AverageThe Optimal Weighted Moving Average was created by Thomas Hutchinson and Peter G. Zhang, Ph.D. (Stocks & Commodities V. 11:12 (500-505)) and it is very similar to a classic weighted moving average but it uses the correlation between the input and the optimal weighted moving average output to use as the weights. Buy when the line turns green and sell when it turns red.
Let me know if you would like to see me publish any other scripts or if you want something custom done!
Squeeze Momentum Indicator [LazyBear] vHMAThis is a remake of the famous LazyBear Indicator, the Squeeze Momentum Indicator.
All i did was take out the SMA's and replace them with HMA's. HMA is a more responsive moving average.
Hull Moving Average.
This is a derivative of John Carter's "TTM Squeeze" volatility indicator, as discussed in his book "Mastering the Trade" (chapter 11).
Black crosses on the midline show that the market just entered a squeeze ( Bollinger Bands are with in Keltner Channel). This signifies low volatility , market preparing itself for an explosive move (up or down). Gray crosses signify "Squeeze release".
Mr.Carter suggests waiting till the first gray after a black cross, and taking a position in the direction of the momentum (for ex., if momentum value is above zero, go long). Exit the position when the momentum changes (increase or decrease --- signified by a color change). My (limited) experience with this shows, an additional indicator like ADX / WaveTrend, is needed to not miss good entry points. Also, Mr.Carter uses simple momentum indicator , while I have used a different method (linreg based) to plot the histogram.
More info:
- Book: Mastering The Trade by John F Carter
Here is the original version:

Midpoint OscillatorThe Midpoint Oscillator was created by Tushar Chande Ph.D. (Stocks & Commodities V. 9:11 (431-434)) and it does a great job of tracking extreme changes in the price. Buy when the line is green and sell when it turns red.
Let me know if you would like me to write more scripts!

Bar Balance [LucF]Bar Balance extracts the number of up, down and neutral intrabars contained in each chart bar, revealing information on the strength of price movement. It can display stacked columns representing raw up/down/neutral intrabar counts, or an up/down balance line which can be calculated and visualized in many different ways.
WARNING: This is an analysis tool that works on historical bars only. It does not show any realtime information, and thus cannot be used to issue alerts or for automated trading. When realtime bars elapse, the indicator will require a browser refresh, a change to its Inputs or to the chart's timeframe/symbol to recalculate and display information on those elapsed bars. Once a trader understands this, the indicator can be used advantageously to make discretionary trading decisions.
Traders used to work with my Delta Volume Columns Pro will feel right at home in this indicator's Inputs . It has lots of options, allowing it to be used in many different ways. If you value the bar balance information this indicator mines, I hope you will find the time required to master the use of Bar Balance well worth the investment.
█ OVERVIEW
The indicator has two modes: Columns and Line .
Columns
• In Columns mode you can display stacked Up/Down/Neutral columns.
• The "Up" section represents the count of intrabars where `close > open`, "Down" where `close < open` and "Neutral" where `close = open`.
• The Up section always appears above the centerline, the Down section below. The Neutral section overlaps the centerline, split halfway above and below it.
The Up and Down sections start where the Neutral section ends, when there is one.
• The Up and Down sections can be colored independently using 7 different methods.
• The signal line plotted in Line mode can also be displayed in Columns mode.
Line
• Displays a single balance line using a zero centerline.
• A variable number of independent methods can be used to calculate the line (6), determine its color (5), and color the fill (5).
You can thus evaluate the state of 3 different components with this single line.
• A "Divergence Levels" feature will use the line to automatically draw expanding levels on divergence events.
Features available in both modes
• The color of all components can be selected from 15 base colors, with 16 gradient levels used for each base color in the indicator's gradients.
• A zero line can show a 6-state aggregate value of the three main volume balance modes.
• The background can be colored using any of 5 different methods.
• Chart bars can be colored using 5 different methods.
• Divergence and large neutral count ratio events can be shown in either Columns or Line mode, calculated in one of 4 different methods.
• Markers on 6 different conditions can be displayed.
█ CONCEPTS
Intrabar inspection
Intrabar inspection means the indicator looks at lower timeframe bars ( intrabars ) making up a given chart bar to gather its information. If your chart is on a 1-hour timeframe and the intrabar resolution determined by the indicator is 5 minutes, then 12 intrabars will be analyzed for each chart bar and the count of up/down/neutral intrabars among those will be tallied.
Bar Balances and calculation methods
The indicator uses a variety of methods to evaluate bar balance and to derive other calculations from them:
1. Balance on Bar : Uses the relative importance of instant Up and Down counts on the bar.
2. Balance Averages : Uses the difference between the EMAs of Up and Down counts.
3. Balance Momentum : Starts by calculating, separately for both Up and Down counts, the difference between the same EMAs used in Balance Averages and an SMA of double the period used for the EMAs. These differences are then aggregated and finally, a bounded momentum of that aggregate is calculated using RSI.
4. Markers Bias : It sums the bull/bear occurrences of the four previous markers over a user-defined period (the default is 14).
5. Combined Balances : This is the aggregate of the instant bull/bear bias of the three main bar balances.
6. Dual Up/Down Averages : This is a display mode showing the EMA calculated for each of the Up and Down counts.
Interpretation of neutral intrabars
What do neutral intrabars mean? When price does not change during a bar, it can be because there is simply no interest in the market, or because of a perfect balance between buyers and sellers. The latter being more improbable, Bar Balance assumes that neutral bars reveal a lack of interest, which entails uncertainty. That is the reason why the option is provided to interpret ratios of neutral intrabars greater than 50% as divergences. It is also the rationale behind the option to dampen signal lines on the inverse ratio of neutral intrabars, so that zero intrabars do not affect the signal, and progressively larger proportions of neutral intrabars will reduce the signal's amplitude, as the balance calcs using the up/down counts lose significance. The impact of the dampening will vary with markets. Weaker markets such as cryptos will often contain greater numbers of neutral intrabars, so dampening the Line in that sector will have a greater impact than in more liquid markets.
█ FEATURES
1 — Columns
• While the size of the Up/Down columns always represents their respective importance on the bar, their coloring mode is independent. The default setup uses a standard coloring mode where the Up/Down columns over/under the zero line are always in the bull/bear color with a higher intensity for the winning side. Six other coloring modes allow you to pack more information in the columns. When choosing to color the top columns using a bull/bear gradient on Balance Averages, for example, you will end up with bull/bear colored tops. In order for the color of the bottom columns to continue to show the instant bar balance, you can then choose the "Up/Down Ratio on Bar — Dual Solid Colors" coloring mode to make those bars the color of the winning side for that bar.
• Line mode shows only the line, but Columns mode allows displaying the line along with it. If the scale of the line is different than that of the scale of the columns, the line will often appear flat. Traders may find even a flat line useful as its bull/bear colors will be easily distinguishable.
2 — Line
• The default setup for Line mode uses a calculation on "Balance Momentum", with a fill on the longer-term "Balance Averages" and a line color based on the "Markers Bias". With the background set on "Line vs Divergence Levels" and the zero line on the hard-coded "Combined Bar Balances", you have access to five distinct sources of information at a glance, to which you can add divergences, divergences levels and chart bar coloring. This provides powerful potential in displaying bar balance information.
• When no columns are displayed, Line mode can show the full scale of whichever line you choose to calculate because the columns' scale no longer interferes with the line's scale.
• Note that when "Balance on Bar" is selected, the Neutral count is also displayed as a ratio of the balance line. This is the only instance where the Neutral count is displayed in Line mode.
• The "Dual Up/Down Averages" is an exception as it displays two lines: one average for the Up counts and another for the Down counts. This mode will be most useful when Columns are also displayed, as it provides a reference for the top and bottom columns.
3 — Zero Line
The zero line can be colored using two methods, both based on the Combined Balances, i.e., the aggregate of the instant bull/bear bias of the three main bar balances.
• In "Six-state Dual Color Gradient" mode, a dot appears on every bar. Its color reflects the bull/bear state of the Combined Balances, and the dot's brightness reflects the tally of balance biases.
• In "Dual Solid Colors (All Bull/All Bear Only)" a dot only appears when all three balances are either bullish or bearish. The resulting pattern is identical to that of Marker 1.
4 — Divergences
• Divergences are displayed as a small circle at the top of the scale. Four different types of divergence events can be detected. Divergences occur whenever the bull/bear bias of the method used diverges with the bar's price direction.
• An option allows you to include in divergence events instances where the count of neutral intrabars exceeds 50% of the total intrabar count.
• The divergence levels are dynamic levels that automatically build from the line's values on divergence events. On consecutive divergences, the levels will expand, creating a channel. This implementation of the divergence levels corresponds to my view that divergences indicate anomalies, hesitations, points of uncertainty if you will. It excludes any association of a pre-determined bullish/bearish bias to divergences. Accordingly, the levels merely take note of divergence events and mark those points in time with levels. Traders then have a reference point from which they can evaluate further movement. The bull/bear/neutral colors used to plot the levels are also congruent with this view in that they are determined by price's position relative to the levels, which is how I think divergences can be put to the most effective use.
5 — Background
• The background can show a bull/bear gradient on four different calculations. You can adjust its brightness to make its visual importance proportional to how you use it in your analysis.
6 — Chart bars
• Chart bars can be colored using five different methods.
• You have the option of emptying the body of bars where volume does not increase, as does my TLD indicator, the idea behind this being that movement on bars where volume does not increase is less relevant.
7 — Intrabar Resolution
You can choose between three modes. Two of them are automatic and one is manual:
a) Fast, Longer history, Auto-Steps (~12 intrabars) : Optimized for speed and deeper history. Uses an average minimum of 12 intrabars.
b) More Precise, Shorter History Auto-Steps (~24 intrabars) : Uses finer intrabar resolution. It is slower and provides less history. Uses an average minimum of 24 intrabars.
c) Fixed : Uses the fixed resolution of your choice.
Auto-Steps calculations vary for 24/7 and conventional markets in order to achieve the proper target of minimum intrabars.
You can choose to view the intrabar resolution currently used to calculate delta volume. It is the default.
The proper selection of the intrabar resolution is important. It must achieve maximal granularity to produce precise results while not unduly slowing down calculations, or worse, causing runtime errors.
8 — Markers
Six markers are available:
1. Combined Balances Agreement : All three Bar Balances are either bullish or bearish.
2. Up or Down % Agrees With Bar : An up marker will appear when the percentage of up intrabars in an up chart bar is greater than the specified percentage. Conditions mirror to down bars.
3. Divergence confirmations By Price : One of the four types of balance calculations can be used to detect divergences with price. Confirmations occur when the bar following the divergence confirms the balance bias. Note that the divergence events used here do not include neutral intrabar events.
4. Balance Transitions : Bull/bear transitions of the selected balance.
5. Markers Bias Transitions : Bull/bear transitions of the Markers Bias.
6. Divergence Confirmations By Line : Marks points where the line first breaches a divergence level.
Markers appear when the condition is detected, without delay. Since nothing is plotted in realtime, markers do not appear on the realtime bar.
9 — Settings
• Two modes can be selected to dampen the line on the ratio of neutral intrabars.
• A distinct weight can be attributed to the count of the latter half of intrabars, on the assumption that later intrabars may be more important in determining the outcome of chart bars.
• Allows control over the periods of the different moving averages used in calculations.
• The default periods used for the various calculations define the following hierarchy from slow to fast:
Balance Averages: 50,
Balance Momentum: 20,
Dual Up/Down Averages: 20,
Marker Bias: 10.
█ LIMITATIONS
• This script uses a special characteristic of the `security()` function allowing the inspection of intrabars—which is not officially supported by TradingView.
• The method used does not work on the realtime bar—only on historical bars.
• The indicator only works on some chart resolutions: 3, 5, 10, 15 and 30 minutes, 1, 2, 4, 6, and 12 hours, 1 day, 1 week and 1 month. The script’s code can be modified to run on other resolutions, but chart resolutions must be divisible by the lower resolution used for intrabars and the stepping mechanism could require adaptation.
• When using the "Line vs Divergence Levels — Dual Color Gradient" color mode to fill the line, background or chart bars, keep in mind that a line calculation mode must be defined for it to work, as it determines gradients on the movement of the line relative to divergence levels. If the line is hidden, it will not work.
• When the difference between the chart’s resolution and the intrabar resolution is too great, runtime errors will occur. The Auto-Steps selection mechanisms should avoid this.
• Alerts do not work reliably when `security()` is used at intrabar resolutions. Accordingly, no alerts are configured in the indicator.
• The color model used in the indicator provides for fancy visuals that come at a price; when you change values in Inputs , it can take 20 seconds for the changes to materialize. Luckily, once your color setup is complete, the color model does not have a large performance impact, as in normal operation the `security()` calls will become the most important factor in determining response time. Also, once in a while a runtime error will occur when you change inputs. Just making another change will usually bring the indicator back up.
█ RAMBLINGS
Is this thing useful?
I'll let you decide. Bar Balance acts somewhat like an X-Ray on bars. The intrabars it analyzes are no secret; one can simply change the chart's resolution to see the same intrabars the indicator uses. What the indicator brings to traders is the precise count of up/down/neutral intrabars and, more importantly, the calculations it derives from them to present the information in a way that can make it easier to use in trading decisions.
How reliable is Bar Balance information?
By the same token that an up bar does not guarantee that more up bars will follow, future price movements cannot be inferred from the mere count of up/down/neutral intrabars. Price movement during any chart bar for which, let's say, 12 intrabars are analyzed, could be due to only one of those intrabars. One can thus easily see how only relying on bar balance information could be very misleading. The rationale behind Bar Balance is that when the information mined for multiple chart bars is aggregated, it can provide insight into the history behind chart bars, and thus some bias as to the strength of movements. An up chart bar where 11/12 intrabars are also up is assumed to be stronger than the same up bar where only 2/12 intrabars are up. This logic is not bulletproof, and sometimes Bar Balance will stray. Also, keep in mind that balance lines do not represent price momentum as RSI would. Bar Balance calculations have no idea where price is. Their perspective, like that of any historian, is very limited, constrained that it is to the narrow universe of up/down/neutral intrabar counts. You will thus see instances where price is moving up while Balance Momentum, for example, is moving down. When Bar Balance performs as intended, this indicates that the rally is weakening, which does necessarily imply that price will reverse. Occasionally, price will merrily continue to advance on weakening strength.
Divergences
Most of the divergence detection methods used here rely on a difference between the bias of a calculation involving a multi-bar average and a given bar's price direction. When using "Bar Balance on Bar" however, only the bar's balance and price movement are used. This is the default mode.
As usual, divergences are points of interest because they reveal imbalances, which may or may not become turning points. I do not share the overwhelming enthusiasm traders have for the purported ability of bullish/bearish divergences to indicate imminent reversals.
Superfluity
In "The Bed of Procrustes", Nassim Nicholas Taleb writes: To bankrupt a fool, give him information . Bar Balance can display lots of information. While learning to use a new indicator inevitably requires an adaptation period where we put it through its paces and try out all its options, once you have become used to Bar Balance and decide to adopt it, rigorously eliminate the components you don't use and configure the remaining ones so their visual prominence reflects their relative importance in your analysis. I tried to provide flexible options for traders to control this indicator's visuals for that exact reason—not for window dressing.
█ NOTES
For traders
• To avoid misleading traders who don't read script descriptions, the indicator shows nothing in the realtime bar.
• The Data Window shows key values for the indicator.
• All gradients used in this indicator determine their brightness intensities using advances/declines in the signal—not their relative position in a fixed scale.
• Note that because of the way gradients are optimized internally, changing their brightness will sometimes require bringing down the value a few steps before you see an impact.
• Because this indicator does not use volume, it will work on all markets.
For coders
• For those interested in gradients, this script uses an advanced version of the Advance/Decline gradient function from the PineCoders Color Gradient (16 colors) Framework . It allows more precise control over the range, steps and min/max values of the gradients.
• I use the PineCoders Coding Conventions for Pine to write my scripts.
• I used functions modified from the PineCoders MTF Selection Framework for the selection of timeframes.
█ THANKS TO:
— alexgrover who helped me think through the dampening method used to attenuate signal lines on high ratios of neutral intrabars.
— A guy called Kuan who commented on a Backtest Rookies presentation of their Volume Profile indicator . The technique I use to inspect intrabars is derived from Kuan's code.
— theheirophant , my partner in the exploration of the sometimes weird abysses of `security()`’s behavior at intrabar resolutions.
— midtownsk8rguy , my brilliant companion in mining the depths of Pine graphics. He is also the co-author of the PineCoders Color Gradient Frameworks .

Trend Exhaustion IndicatorThe Trend Exhaustion Indicator is a custom indicator of mine that is loosely based on the Trend Exhaustion Index created by Clifford L. Creel Ph.D. (Stocks & Commodities V. 9:1 (9-11))
This indicator will let you know the trend reversal points and when it falls below the signal line then the trend is ending vice versa. Buy when the indicator crosses above the signal line and sell when it falls below the signal line.
Let me know if you would like to see me write any other scripts!
