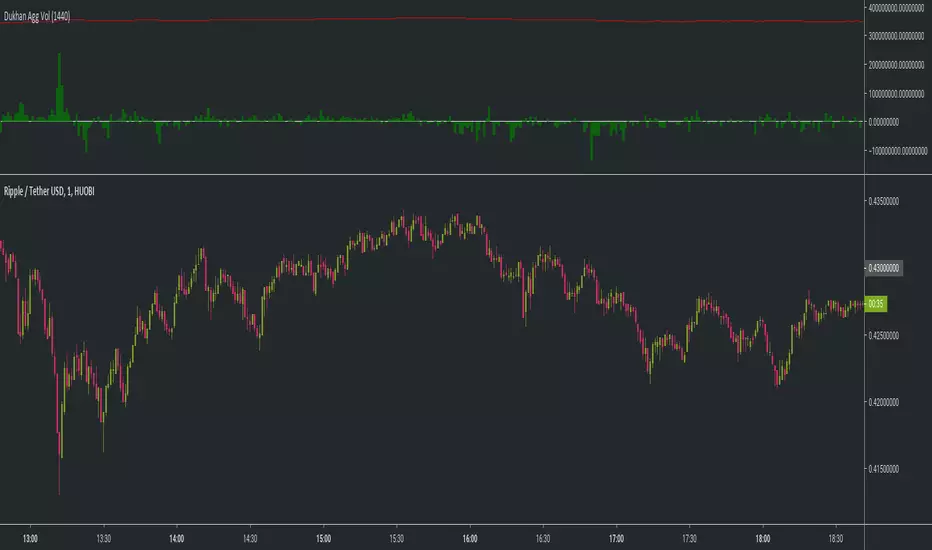
Parabolic DetectionThis method of trend analysis draws the RSI channel from 50 to 60 on the chart. If it's over 60, the channel is green.
When Bitcoin goes on its insane runs, the RSI on the 3 day chart will often be pegged at extreme values. Our goal is to visually represent these moments.
By default, this uses the 3 day resolution for its calculations. Feel free to disable this and it will work on any timeframe.
ค้นหาในสคริปต์สำหรับ "市值60亿的股票"
rainbow ema갤럭시님 이평선 토대로 JB가 에디트한 지수이평선 모음입니다. 편집하시면 일반 이평선으로도 사용이 가능합니다.
하나의 지표 추가 만으로 여러개의 지수이평선을 사용하실 수 있고, 제가 자주 사용하는 7,14,21,28,40,60,120,200,300선 넣어 놨습니다.
"Galaxy" made, JB edited EMA script. Editing is free for use if you swap ema to ma as a base setting.
You can use several ema lines by adding one indicator only, and I put 7,14,21,28,40,60,120,200,300 as a threshold which I frequently use.
It is made as an open source at any time possible, so that you are free for playing with it.
Gazua!!!!
TRADE.GODANN-based script, comparing the previous and current closing of the asset with its percentage of change and determining the purchase or sale accordingly.
I recommend using the time of the script in 60 minutes and the time of opration and 5 minutes for a better scalp.
For junior time I recommend 240 minutes for the script time and 60 minutes for the operating time.
Thanks Thiago Kerbes;)
RSI|The Wave PrincipleThe Wave Principle | Modified RSI
30 green | 70 red = Strong Movement (Possible Impulse)
20 cyan | 80 Yellow = Strongest Movement
Support and Resistance Level (Trend Continuation)
Uptrend= 40
Downtrend = 60
Break+Retest = BR
Div = Divergence (Change in trend)
--------------------------------------------
This indicator has been modified from original RSI to fit Wave Principle characteristics:
Uptrend Impulsive Wave over 70 RSI it changes color to red, and > 80 yellow stronger impulse | Usually means continuation, at least once more.
Downtrend Impulsive Wave under 30 RSI it changes color to green, and < 20 cyan stronger impulse | Usually means continuation, at least once more.
Once RSI reached these levels, it doesn't mean trend reversal but a correction is expected. If it shows divergence along with an Ending Diagonal, it's a confirmation for trend reversal.
In a corrective wave, levels 40-60 represents support and resistance levels where price won't go further. Indicating Corrective Waves, not as strong as Impulsives.
Prices can breakout RSI trend lines and retest from the other side before continue the new trend as also described in the Wave Principle.
--------------------------------------------
The Scale Of Sacred SoundsBased on the Sacred Sound Scale
How to use it:
This indicator is designed to capture the inferred behavior of traders and investors by using two groups of averages.
Meant for longer trades and trend indicator.
Used on any timescale as needed.
Can trade on long or short where the slow MA crosses fast Ma or where the Slow MA compresses and flips open again.
Follow the trend to the end - pot of gold at the end of the rainbow :-)
References:
Based on Daryl Guppy GMMA and
www.guppytraders.com
Read more at:
whatmusicreallyis.com
There is one tuning in which the frequencies 432, 528, 424 and 440 Hz can peacefully coexist. The scale has 32+1 pure harmonic tones and the reference frequency of 256 Hz. It comes from the Natural Ascending Series of Harmonics 32 to 64 of the 8 Hz Fundamental Tone, and represents its 6th double. I call this tuning The Scale of Sacred Sounds.
Representation using ancient Sumerian/Babylonian/Vedic math:
32; 33; 34; 35; 36; 37; 38; 39; 40; 41; 42; 43; 44; 45; 46; 47; 48; 49; 50; 51; 52; 53; 54; 55; 56; 57; 58; 59; 60; 61; 62; 63; 64
Representation using musical ratios:
1/1; 33/32; 17/16; 35/32; 9/8; 37/32; 19/16; 39/32; 5/4; 41/32; 21/16; 43/32; 11/8; 45/32; 23/16; 47/32; 3/2; 49/32; 25/16; 51/32; 13/8; 53/32; 27/16; 55/32; 7/4; 57/32; 29/16; 59/32; 15/8; 61/32; 31/16; 63/32; 2/1
The math for deriving one of the above series from the other is simple. Divide all numbers from the ancient series by the first, then simplify the fractions. Conversely, the series of ratios can be turned into the series of integers by calculating their least common denominator (the smallest whole number that is a multiple of all numbers under the fraction bar) and discarding it.
Logarithmic representation using musical constants (definition given further down):
0,000; 30,772; 60,625; 89,612; 117,783; 145,182; 171,850; 197,826; 223,144; 247,836; 271,934; 295,464; 318,454; 340,927; 362,905; 384,412; 405,465; 426,084; 446,287; 466,090; 485,508; 504,556; 523,248; 541,597; 559,616; 577,315; 594,707; 611,802; 628,609; 645,138; 661,398; 677,399; 693,147
Bitfinex Longs/Shorts Ratio AlertableThis script contains Bitfinex longs/short ratio and generates alarms with a given input .default value is 60 which means alerts when either shorts/longs reach 60:40 ratio
RSI / Stoch / SRSI / MFI / Aroon Overlay [SigmaDraconis]Combines 4 popular indicators (RSI, Stoch, SRSI, MFI) and 1 peculiar one (Aroon) in 1 for those who want to save indicators but not only.
This is an evolution of my (simpler) "RSI / Stoch / Stoch RSI (SRSI) Overlay " that you can find on my scripts.
Added bands for oversold/overbought areas (70/30 common for RSI and 80/20 for SRSI and MFI), as well as a middle 50 horizontal line.
Neutral bands around 55-45 added as well that can be hidden for less clutter. I also recommend a more transparent coloring for these since Pine script doesn't allow default transparency for horizontal lines.
By default only RSI and Stoch are activated, you can activate Aroon, MFI and SRSI on the inputs window.
Some extra notes:
* RSI, Stoch and MFI can help to strengthen one's decision as well as Aroon to predict a possible trend reversal, SRSI can show when RSI has high probability of being topped or bottomed when oversold/overbought but don't forget to look at volume and how the trend progresses that can keep SRSI above 80 or below 20 while RSI and price continues to trend, divergences are most helpful here to find possible reversal areas.
* This chart depicts some interesting divergences, as well as Stoch tops and bottoms and confluences between RSI/MFI and Stoch on some over-extended tops and bottoms that shown being good reversal zones.
RSI resistances are shown as well, failing to break above 60 or the neutral zone (this is a bearish BTC trend chart after all) or failing to gain support to break up certain levels (RSI notes a more bullish trend when consistently above 60 and more bearish below 40).
If you like it and use it to profit, please tip me below :)
Tip jars:
BTC: 15nMBiEGVrdGcu9C1h6QRcTNRvugHkqrMQ
ETH: 0xC33845946c48B61fBCbEA0367ec2238CaF2b73bc
BTS: sigma-draconis
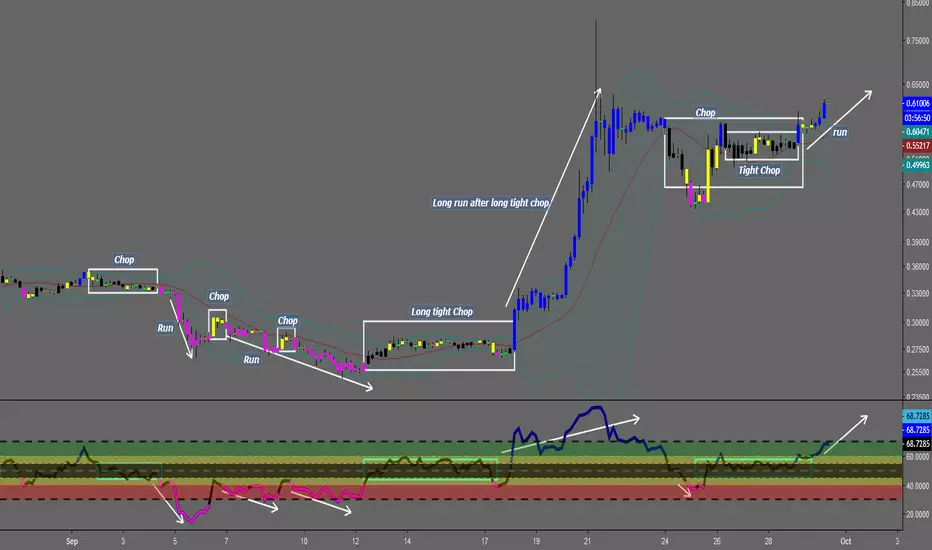
Chop and explodeThe purpose of this script is to decipher chop zones from runs/movement/explosion
The chop is RSI movement between 40 and 60
tight chop is RSI movement between 45 and 55. There should be an explosion after RSI breaks through 60 (long) or 40 (short). Tight chop bars are colored black, a series of black bars is tight consolidation and should explode imminently. The longer the chop the longer the explosion will go for. tighter the better.
Loose chop (whip saw/yellow bars) will range between 40 and 60.
the move begins with blue bars for long and purple bars for short.
Couple it with your trading system to help stay out of chop and enter when there is movement. Use with "Simple Trender."
Best of luck in all you do. Get money.
Build A BotThis is the Robot we built during the 60 Minute Build-A-Bot webinar on September 12, 2018. We had a great time, and a lot of participation and the best part was that we finished up this robot and even ran a backtest in exactly 60 minutes! We built this robot based on recommendations and suggestions from those who were attending live. Lots of pieces in this robot, but you can always tinker with it, remove stuff, add things, whatever you want!
This version uses the CCI as a trigger for trade entry. The other version uses the Hull Moving Average as a trigger for trade entry.
Volume Zone Oscillator and Price Zone (VZO/PZO) [NeoButane]" Volume Precedes Price is the conceptual idea for the oscillator."
"The main idea of the VZO was to try to change the OBV to look like an oscillator rather than an indicator, also to include time; primarily to identify which zone the volume is located in during a specific period "
How to read this indicator:
Positive reading -> bullish
Negative reading -> bearish
-60 or 60 is seen as the limit of the oscillator range, and a pullback should be expected from there.
Plus and minus signs have been added to the top and bottom for VZO and PZO, with an adjustable threshold to trigger.
Alert conditions have been added to this indicator for ease of use.
Volume Zone Oscillator, write-up by the author (recommended reading)
http:capitalsynergy.com/resources/IFTA09VZO.pdf
Volume Zone Oscillator, uses and formula
https:www.investopedia.com/articles/active-trading/072815/how-interpret-volume-zone-oscillator.asp
Price Zone Oscillator, uses and formula
https:www.investopedia.com/terms/p/price-zone-oscillator.asp
Fib,Guppy Multiple MA(FGMMA)(A/D & Volume Weight,SMA,EMA)[cI8DH]Features:
- 3 + 12 MAs (12 is chosen because Guppy has 12 MAs)
- MA types can be set to Simple, Exponential, Weighted, and Smoothed
- Volume weight can be applied to all available MAs (the built-in VWMA uses Simple MA)
- It is possible to count in only effective portions of the volume in the equation by using Accum/Dist Volume Weight
- Secondary smoothing (useful when volume weight is enabled)
- Predefined MA sets based on Fibonacci sequence (2,3,5,8,.., 377), Guppy (3,5,8,10,12,15 &30,35,40,45,50,60), and cI8DH (2,3,5,8,12,17 & 30,34,39,45,52,60)
Recommended settings:
- hlc3 as input source captures all the essential information encapsulated in a candle. I'd use hlc3 as the default option. In uptrend, "low" and in downtrend, "high" might give more relevant results when using MAs for structural analysis of a market. For commonly used MAs (EMA20, SMA50,100,200), "close" should be used due to their self-fulfilling prophecy effect.
- When you have volume weight above 0, you may want to use secondary smoothing.
- Try not to use Simple MA for smaller lengths (below 20). Sharp changes in the past (right before the period specified by the length) will affect the current value of MA dramatically leading to confusion.
- I am using the first 3 MAs for SMA 50,100,200. You can disable them from the MA type selector all at once when using Fib or Guppy ribbons.
MA-based analysis:
There are different ways of structuring a market. Geometrical (trend lines, channels, fans, patterns, etc) and Fib retracement-based structuring is very common among traders. MAs give an alternative way of analyzing markets. MA ribbons such as Guppy (6 slow and 6 fast-moving MAs) are popular for analyzing market flow. IMO default Guppy sets are a bit random as the numbers do not have an elegant sequence. So I proposed my sets based on increasing sequene spacing (+1). These two MA ribbons are good for market flow analysis but the spacing of the MAs are not ideal for structuring a market. Ribbons based on the Fib sequence is a better choice for structuring a market. This is the equivalent of Fib channels but in a more dynamic form. Among other things, MA Fib ribbon can be used to assess market momentum and to compare different stages of a market. Here are two "educational-only" examples:
Notes:
- Smoothed MA with length L = Exponential MA with length 2*L-1
- Read the background section in my ADP indicator to understand how A/D Volume is calculated
Better RSI with bullish / bearish market cycle indicator This script improves the default RSI. First. it identifies regions of the RSI which are oversold and overbought by changing the color of RSI from white to red. Second, it adds additional reference lines at 20,40,50,60, and 80 to better gauge the RSI value. Finally, the coolest feature, the middle 50 line is used to indicate which cycle the price is currently at. A green color at the 50 line indicates a bullish cycle, a red color indicators a bearish cycle, and a white color indicates a neutral cycle.
The cycles are determined using the RSI as follows:
if RSI is overbought, cycle switches to bullish until RSI falls below 40, at which point it becomes neutral
if RSI is oversold, cycle switches bearish until RSI rises above 60, at which point it becomes neutral
a neutral cycle is exited at either overbought or oversold conditions
Very useful, please give it a try and let me know what you think
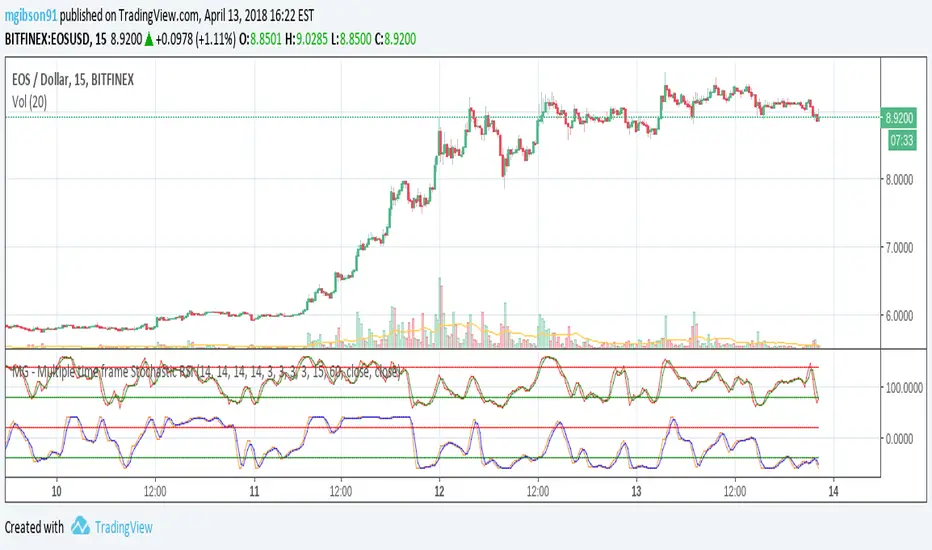
MG - Multiple time frame Stochastic RSIAllows user to view stochastic RSI from two different time frames.
Each stochastic RSI indicator is fully customizable, offering the following options:
- Timeframe
- RSI source
- RSI length
- Stochastic length
- Stochastic average length
- Stochastic smoothing length
Usage:
Comparing stochastic RSI across two different time frames can sharpen trades. For example, if you configure a 60 min and 5/15 min stochastic RSI pair, you might enter a long trade when the 60 min stoch RSI crosses up and exit / take profit when the 5 min stock RSI crosses down.
NG [Simple Harmonic Oscillator]The SHO is a bounded oscillator for the simple harmonic index that calculates the period of the market’s cycle.
The oscillator is used for short and intermediate terms and moves within a range of -100 to 100 percent.
The SHO has overbought and oversold levels at +40 and -40, respectively.
At extreme periods, the oscillator may reach the levels of +60 and -60.
The zero level demonstrates an equilibrium between the periods of bulls and bears.
The SHO oscillates between +40 and -40.
The crossover at those levels creates buy and sell signals.
In an uptrend, the SHO fluctuates between 0 and +40 where the bulls are controlling the market.
On the contrary, the SHO fluctuates between 0 and -40 during downtrends where the bears controlthe market.
Reaching the extreme level -60 in an uptrend is a sign of weakness.
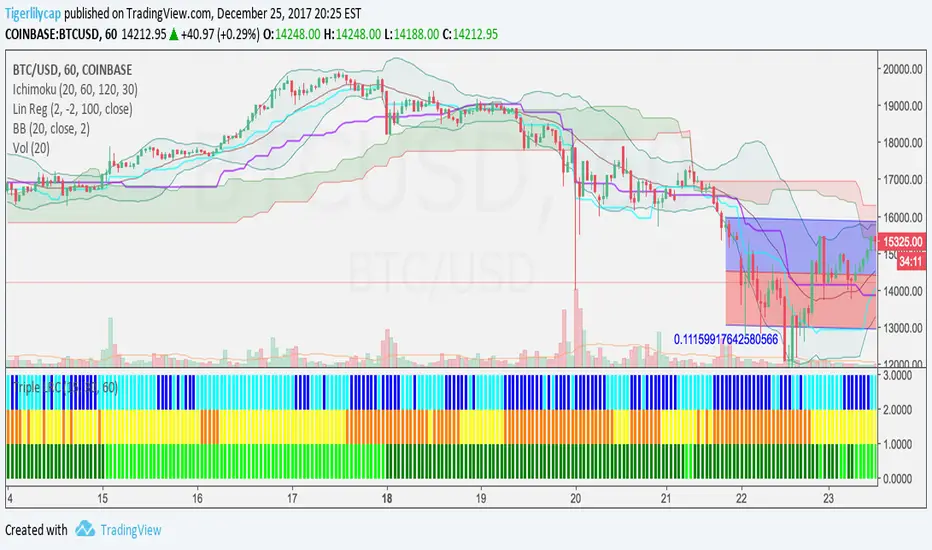
Ichimoku Cloud w/SelIchimoku Cloud with selection for:
Regular:
conversionPeriods = 9,
basePeriods = 26
laggingSpan2Periods = 52,
displacement = 26
Crypto:
conversionPeriods = 10,
basePeriods = 30,
laggingSpan2Periods = 60,
displacement = 30
Crypto Doubled:
conversionPeriods = 20,
basePeriods = 60,
laggingSpan2Periods = 120,
displacement = 30
3 Linear Regression CurveFast 3LRC - 15/30/60 standard settings - 15/30 give a lot of noise, but give you a some time to prepare for the 60 to flip
DEMA Double Exponential Moving Average Strategy@Moneros 2017
Based on The DEMA is a fast-acting moving average that is more responsive to market changes than a traditional moving average
en.wikipedia.org
!!!! IN ORDER TO AVOID REPAITING ISSUES !!!!
!!!! DO NOT VIEW IN LOWER RESOLUTIONS THAN res/2 PARAMETER !!!!
for example res = 120 view >= 60m res = 60 view >= 30m
the length of the DEMA sampling shouldn't be longer than a candle
Best profits tested on BTCUSD
res = 105 slowPeriod = 2 fastPeriod = 32
res = 125 slowPeriod = 3 fastPeriod = 21
res = 120 slowPeriod = 2 fastPeriod = 32
res = 130 slowPeriod = 1 fastPeriod = 24
res = 40 slowPeriod = 4 fastPeriod = 93
res = 60 slowPeriod = 1 fastPeriod = 67
BTCUSD
RSI in Bull and Bear Market V2.0RSI oversold at 60/40 in bullish market
And Overbought at 40/60 in Bearish market
for more info of this Strategy
WaveTrend [MastroFran]Great indicator to show short term price movements. 5 day moving average oscillator. When green crosses red and under the 60 mark, buy with caution. when over the 60 mark and red crosses green sell immediately for highest profits.
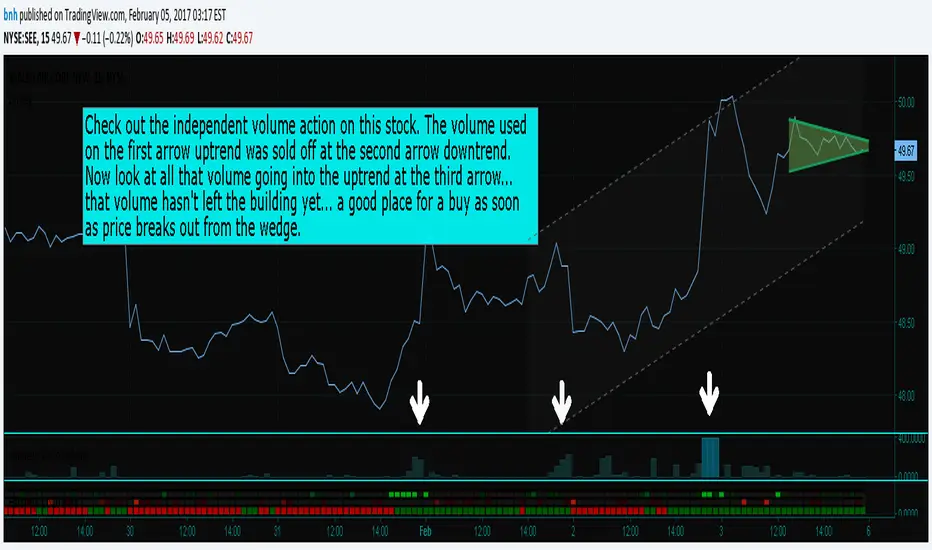
Hersheys CoCo VolumeCoCo Volume shows you volume movement of your symbol after subtracting the movement from another symbol, preferrably the sector or market the stock belongs to.
My latest update to my CoCoVolume Indicator. It calculates today's volume percent over the 60 period average for both your symbol and index, and displays that difference. If the percent is over the max it highlights the color, showing BIG action for that stock.
The last version was calculating the percent volume difference from yesterday to today for the stock and index and displaying the difference. The prior method had large swings on low volume stocks... this one shows the independent volume action much better. The default values will suit most stocks.
You can set three variables...
- the index symbol, default is SPY
- the period for averaging, default is 60
- the max volume percent, default is 500
Good trading!
Brian Hershey
close-hl2 Price actionStill not tested, but looks very good ; it is the difference between EMA median price and EMA close in different time frame, I used 240, 60, and the current Time frame ,plus one more customed period ; can forcast the price movement , but it s not in scale, so it can not show how much higher or lower the price can goes but just the next direction. I think intraday on 5 ,15 ,60 better then high frame.If you need to try on Daily frame have to change the period to higher then Daily
Everyday 0002 _ MAC 1st Trading Hour WalkoverThis is the second strategy for my Everyday project.
Like I wrote the last time - my goal is to create a new strategy everyday
for the rest of 2016 and post it here on TradingView.
I'm a complete beginner so this is my way of learning about coding strategies.
I'll give myself between 15 minutes and 2 hours to complete each creation.
This is basically a repetition of the first strategy I wrote - a Moving Average Crossover,
but I added a tiny thing.
I read that "Statistics have proven that the daily high or low is established within the first hour of trading on more than 70% of the time."
(source: )
My first Moving Average Crossover strategy, tested on VOLVB daily, got stoped out by the volatility
and because of this missed one nice bull run and a very nice bear run.
So I added this single line: if time("60", "1000-1600") regarding when to take exits:
if time("60", "1000-1600")
strategy.exit("Close Long", "Long", profit=2000, loss=500)
strategy.exit("Close Short", "Short", profit=2000, loss=500)
Sweden is UTC+2 so I guess UTC 1000 equals 12.00 in Stockholm. Not sure if this is correct, actually.
Anyway, I hope this means the strategy will only take exits based on price action which occur in the afternoon, when there is a higher probability of a lower volatility.
When I ran the new modified strategy on the same VOLVB daily it didn't get stoped out so easily.
On the other hand I'll have to test this on various stocks .
Reading and learning about how to properly test strategies is on my todo list - all tips on youtube videos or blogs
to read on this topic is very welcome!
Like I said the last time, I'm posting these strategies hoping to learn from the community - so any feedback, advice, or corrections is very much welcome and appreciated!
/pbergden
SNIPER ORB V3# 🎯 SNIPER ORB TRADING CHEAT SHEET
## Quick Reference Guide for Live Trading
---
## 📊 VISUAL IDENTIFICATION GUIDE
```
═══════════════════════════════════════════════════════════════════
YOUR CHART AT A GLANCE
═══════════════════════════════════════════════════════════════════
🔵 BRIGHT BLUE LINES (3px) → 5min ORB High/Low
🔷 CYAN LINES (2px) → 15min ORB High/Low
🟣 PURPLE LINES (2px) → 30min ORB High/Low (PRIMARY)
🟢 GREEN DASHED LINES (1px) → Upside targets (1x, 2x, 3x from 30min ORB)
🔴 RED DASHED LINES (1px) → Downside targets (1x, 2x, 3x from 30min ORB)
🟡 GOLD LINE (2px) → Anchored VWAP (9:30 AM anchor for NY, 3:00 AM for London)
📋 INFO TABLE (top-right) → Shows live ORB ranges, VWAP price, status
═══════════════════════════════════════════════════════════════════
```
**KEY DIFFERENCE FROM OTHER ORB INDICATORS:**
- You see **ALL 3 ORB PERIODS SIMULTANEOUSLY** (5min, 15min, 30min)
- Targets calculated from **30min ORB ONLY** (not 5min or 15min)
- **NO BOX FILLS** - clean line-only display for sniper precision
- Auto-disappears at session end (no clutter from old sessions)
---
## 🔘 NEW FEATURE: ORB DISPLAY TOGGLES
**You now have FULL CONTROL over which ORB periods to display!**
```
In indicator settings → "ORB Display" section:
☑ Show 5min ORB → Toggle blue lines ON/OFF
☑ Show 15min ORB → Toggle cyan lines ON/OFF
☑ Show 30min ORB → Toggle purple lines ON/OFF
USE CASES:
━━━━━━━━━━━━━━━━━━━━━━━━━━━━━━━━━━━━━━━━━━━━━━━
1. FOCUS MODE (30min only)
☐ 5min ☐ 15min ☑ 30min
→ Clean chart, just your primary trading range
→ Best for beginners or minimalist traders
2. EARLY WARNING MODE (5min + 30min)
☑ 5min ☐ 15min ☑ 30min
→ See early breaks with 5min, trade 30min confirmation
→ Reduces visual noise from 15min
3. CONFLUENCE MODE (all 3 ORBs)
☑ 5min ☑ 15min ☑ 30min
→ Maximum information, all alignment signals
→ For advanced traders seeking highest probability
4. INTRADAY SCALP MODE (5min only)
☑ 5min ☐ 15min ☐ 30min
→ Ultra-fast entries on 5min breaks
→ High-risk, high-frequency approach
━━━━━━━━━━━━━━━━━━━━━━━━━━━━━━━━━━━━━━━━━━━━━━━
💡 PRO TIP: Start with 30min only, then add 5min/15min as you gain experience
```
---
## 🎯 FIXED: ANCHORED VWAP (TIMESTAMP-BASED)
**The VWAP now anchors with SURGICAL PRECISION to the exact session start candle!**
```
LONDON SESSION:
• Anchors at the EXACT 3:00 AM ET candle
• Uses timestamp checking: hour == 3 AND minute == 0
• Resets every morning at London Open
NEW YORK SESSION:
• Anchors at the EXACT 9:30 AM ET candle
• Uses timestamp checking: hour == 9 AND minute == 30
• Resets every day at NY Open
WHAT THIS MEANS:
✅ VWAP starts accumulating from the first tick of the session
✅ No more "off by one bar" errors
✅ Institutional-grade VWAP anchoring
✅ Perfect alignment with your ORB start times
HOW TO VERIFY IT'S WORKING:
1. Load indicator on 1min or 5min chart
2. Find the exact 9:30 AM candle (NY) or 3:00 AM candle (London)
3. VWAP should START appearing from that exact bar
4. Not the bar before, not the bar after - THAT EXACT BAR
```
---
## ⏰ SESSION TIMING MATRIX
| Session | Start Time | 5min Complete | 15min Complete | 30min Complete | Session End |
|---------|-----------|---------------|----------------|----------------|-------------|
| **London** | 3:00 AM ET | 3:05 AM | 3:15 AM | 3:30 AM | 9:30 AM ET (disappears) |
| **New York** | 9:30 AM ET | 9:35 AM | 9:45 AM | 10:00 AM | 5:00 PM ET (disappears) |
**💡 GOLDEN RULES:**
1. **WAIT FOR 30MIN ORB TO COMPLETE** before trading targets (10:00 AM NY / 3:30 AM London)
2. Use 5min and 15min ORBs as **early warning signals** only
3. All ORB lines + VWAP **auto-delete** at session end (clean chart)
---
## 🎯 THE 3-ORB SYSTEM: HOW IT WORKS
### **Hierarchical ORB Structure**
```
TIME: 9:30 AM ─────────────────────────────────> 10:00 AM ──────> 5:00 PM
↓ ↓
SESSION START 30min ORB COMPLETE
(all 3 ORBs begin forming) (targets appear)
📍 5min ORB (9:30-9:35 AM): ━━━━━━━━━━━━━━━━━━━━━━━━━━━━━━━━━━━━━>
Purpose: EARLY breakout signal, fastest-moving boundary
📍 15min ORB (9:30-9:45 AM): ━━━━━━━━━━━━━━━━━━━━━━━━━━━━━━━━━━━━━>
Purpose: MID-TERM institutional reference level
📍 30min ORB (9:30-10:00 AM): ━━━━━━━━━━━━━━━━━━━━━━━━━━━━━━━━━━━━━>
Purpose: PRIMARY TRADING RANGE - all targets calculated from this
🎯 TARGETS (10:00 AM onward): ▪ ▪ ▪ ▪ ▪ (1x, 2x, 3x from 30min ORB)
Purpose: Profit-taking levels based on 30min range
```
**Why 3 ORBs Instead of 1?**
- **5min ORB**: Captures early institutional positioning (first 5 minutes)
- **15min ORB**: Confirms directional bias (more stable than 5min)
- **30min ORB**: Full market digestion of overnight news + opening orders
- **Confluence = Higher Win Rate**: When all 3 align, breakouts are extremely reliable
---
## 🎯 THE 5 HIGH-PROBABILITY SETUPS
### **SETUP #1: TRIPLE ORB BREAKOUT CONFLUENCE** ⭐⭐⭐⭐⭐
```
CONDITIONS:
✅ 30min ORB complete (10:00 AM NY / 3:30 AM London)
✅ Price breaks ALL 3 ORBs simultaneously:
• 5min high/low (blue line)
• 15min high/low (cyan line)
• 30min high/low (purple line)
✅ VWAP confirms direction (below price = bullish, above = bearish)
✅ Volume spike on breakout candle
ENTRY: Close of breakout candle (must close beyond ALL 3 ORBs)
STOP: Inside 30min ORB at 30m low (long) or 30m high (short)
TARGET 1: First green/red dashed line (0.5x 30m range)
TARGET 2: Second target (1x 30m range)
TARGET 3: Third target (1.5x 30m range)
WIN RATE: 75-85% | R:R = 1:2.5 minimum
NOTES: When all 3 ORBs align, institutional order flow is unanimous
```
---
### **SETUP #2: 5MIN EARLY BREAKOUT → 30MIN CONFIRMATION** ⭐⭐⭐⭐
```
CONDITIONS:
✅ Price breaks 5min ORB first (blue line crossed)
✅ 15min ORB holds initially (cyan line not crossed yet)
✅ After 30min ORB completes, price breaks 30min boundary (purple)
✅ VWAP alignment confirms direction
✅ All 3 ORBs now broken in same direction
ENTRY: When 30min ORB breaks (purple line) + 5min/15min already broken
STOP: 30min ORB opposite boundary
TARGET 1-3: Standard targets from 30min ORB
WIN RATE: 70-80% | R:R = 1:2+
NOTES: 5min gave early warning, 30min confirms institutional commitment
```
---
### **SETUP #3: FALSE 5MIN BREAKOUT → 30MIN REVERSAL** ⭐⭐⭐⭐⭐
```
CONDITIONS:
✅ Price breaks 5min ORB (blue line)
✅ Fails to break 15min or 30min ORBs (cyan/purple lines hold)
✅ Price reverses back inside 5min ORB
✅ Then breaks OPPOSITE side of 30min ORB (purple line)
✅ VWAP flips to confirm new direction
ENTRY: When 30min ORB breaks in OPPOSITE direction of failed 5min break
STOP: Failed 5min breakout high/low (now a liquidity grab zone)
TARGET 1-3: Standard targets
WIN RATE: 80-90% | R:R = 1:3+ (trapped traders forced to exit)
NOTES: Most profitable setup - 5min breakout was liquidity hunt
```
---
### **SETUP #4: TIGHT COMPRESSION → EXPLOSION** ⭐⭐⭐⭐
```
CONDITIONS:
✅ All 3 ORBs tightly overlapping (5m, 15m, 30m within 50 points on YM)
✅ Range < 0.3% of price (very tight consolidation)
✅ VWAP sitting in middle of compression
✅ 30min ORB complete, price still inside all 3
ENTRY: Simultaneous break of ALL 3 ORBs + VWAP cross
STOP: Middle of compression zone
TARGET: 2x-4x normal targets (volatility expansion)
WIN RATE: 65-75% | R:R = 1:5+ (explosive breakout)
NOTES: Low volatility → high volatility shift, institutions coiling spring
```
---
### **SETUP #5: VWAP BOUNCE WITHIN 30MIN ORB** ⭐⭐⭐⭐
```
CONDITIONS:
✅ Price stayed inside 30min ORB for 1+ hours post-formation
✅ VWAP acting as dynamic support (long) or resistance (short)
✅ Price bouncing between VWAP and 30min ORB boundaries
✅ Clear rejection candles at VWAP
ENTRY: When price bounces off VWAP toward 30min ORB boundary
• Long: VWAP bounce up toward 30m high (purple)
• Short: VWAP rejection down toward 30m low (purple)
STOP: Beyond VWAP by 20 points
TARGET: 30min ORB opposite boundary
WIN RATE: 70-80% | R:R = 1:1.5-2
NOTES: Range-bound play, NOT for breakout traders
```
---
## 🛡️ RISK MANAGEMENT RULES
### **Position Sizing by ORB Range**
```
30min ORB Range | Stop Distance | Risk $500 (1%) | YM Contracts
-----------------|------------------|-----------------|-------------
< 50 points | 50 pts | $500 ÷ $250 = | 2 contracts
50-100 points | 100 pts | $500 ÷ $500 = | 1 contract
100-150 points | 150 pts | $500 ÷ $750 = | 0.66 (use 1)
150-200 points | 200 pts | $500 ÷ $1000 = | 0.5 (use 1)
> 200 points | Don't trade | Too wide | Skip setup
Formula: Risk $ ÷ (Stop Distance × $5 per YM point) = Max Contracts
```
### **The 3-Strike Rule (MANDATORY)**
```
✅ Trade 1: Full position size (based on 30m ORB range)
❌ Stop hit → Trade 2: HALF position size
❌ Stop hit → Trade 3: QUARTER position size
❌ Stop hit → DONE FOR THE DAY (no exceptions)
```
### **Profit Taking Ladder**
```
TARGET 1 (0.5x 30m range): Take 50% off, move stop to breakeven
TARGET 2 (1.0x 30m range): Take 30% off, trail stop by 25 points
TARGET 3 (1.5x 30m range): Take 15% off, let 5% run with 50pt trail
```
---
## ⚠️ DO NOT TRADE IF...
```
🚫 30min ORB incomplete (< 10:00 AM NY / < 3:30 AM London)
🚫 30min ORB range < 40 points YM (too tight, likely chop)
🚫 30min ORB range > 250 points YM (too wide, unpredictable)
🚫 All 3 ORBs wildly divergent (5m=100pts, 15m=180pts, 30m=240pts)
🚫 Major news release within 30 minutes (wait for ORB to reform)
🚫 You've hit 3 losses in the session (3-strike rule)
🚫 You're tired, emotional, revenge trading, or distracted
🚫 Time > 12:00 PM ET (lunch, avoid until 1:00 PM)
🚫 Time > 3:00 PM ET unless Power Hour (3:00-4:00 PM) momentum
```
---
## 🔍 PRE-SESSION CHECKLIST
**15 Minutes Before London (2:45 AM ET) or NY (9:15 AM ET):**
```
□ Check economic calendar (FOMC? NFP? CPI? → extra caution)
□ Review previous session's ORB ranges (context for today's volatility)
□ Load SNIPER ORB on 1min or 5min chart
□ Select correct session: "London" or "New York"
□ Verify indicator settings:
• Number of Targets: 3
• Target % of 30min Range: 50%
• Show Anchored VWAP: ON
□ Set TradingView alerts:
• 30min ORB complete (10:00 AM or 3:30 AM)
• Price crossing 30min high/low
• VWAP crosses
□ Prepare bracket orders mentally (entry, stop, 3 targets)
□ Review yesterday's P&L and lessons learned
□ Set phone to "Do Not Disturb" mode
```
---
## 🎨 INDICATOR SETTINGS GUIDE
### **Core Settings (Updated with Toggles)**
```
SESSION SETTINGS:
━━━━━━━━━━━━━━━━━━━━━━━━━━━━━━━━━━━━━━━━
• Active Session: "London" or "New York"
ORB DISPLAY (NEW!):
━━━━━━━━━━━━━━━━━━━━━━━━━━━━━━━━━━━━━━━━
☑ Show 5min ORB (toggle blue lines)
☑ Show 15min ORB (toggle cyan lines)
☑ Show 30min ORB (toggle purple lines)
💡 Turn OFF any ORB to declutter your chart!
TARGET SETTINGS:
━━━━━━━━━━━━━━━━━━━━━━━━━━━━━━━━━━━━━━━━
• Number of Targets: 3 (default)
• Target % of 30min Range: 50% (default)
VWAP SETTINGS:
━━━━━━━━━━━━━━━━━━━━━━━━━━━━━━━━━━━━━━━━
☑ Show Anchored VWAP
• VWAP Color: Gold (#FFC107)
• VWAP Width: 2px
```
### **Color Customization (Optimized for Dark Charts)**
```
DEFAULT COLORS:
━━━━━━━━━━━━━━━━━━━━━━━━━━━━━━━━━━━━━━━━
5min ORB: Bright Blue (#2196F3) - 3px wide
15min ORB: Cyan (#00BCD4) - 2px wide
30min ORB: Purple (#9C27B0) - 2px wide
Upside Targets: Green (#4CAF50) - 1px dashed
Downside Targets: Red (#F44336) - 1px dashed
VWAP: Gold (#FFC107) - 2px solid
━━━━━━━━━━━━━━━━━━━━━━━━━━━━━━━━━━━━━━━━
WHY THESE COLORS?
• Blue family (5m/15m) = short-term, high-frequency
• Purple (30m) = primary, institutional level
• Green/Red = universal up/down
• Gold VWAP = fair value anchor (stands out)
```
### **Settings by Trading Style**
**BEGINNER (Clean & Simple):**
```
ORB Display:
☐ Show 5min ORB
☐ Show 15min ORB
☑ Show 30min ORB (30min only - focus mode)
Number of Targets: 2-3
Target % of 30min Range: 50%
Chart Timeframe: 5-minute
```
**SCALPER (5-15 min holds):**
```
ORB Display:
☑ Show 5min ORB (early signals)
☐ Show 15min ORB
☑ Show 30min ORB (confirmation)
Number of Targets: 5
Target % of 30min Range: 30-40%
Label Size: Tiny
Chart Timeframe: 1-minute
```
**DAY TRADER (30-90 min holds):**
```
ORB Display:
☑ Show 5min ORB
☑ Show 15min ORB
☑ Show 30min ORB (all 3 - confluence mode)
Number of Targets: 3
Target % of 30min Range: 50%
Label Size: Small
Chart Timeframe: 5-minute (RECOMMENDED)
```
**SWING TRADER (2-4 hour holds):**
```
ORB Display:
☐ Show 5min ORB (too noisy for swings)
☑ Show 15min ORB
☑ Show 30min ORB
Number of Targets: 2-3
Target % of 30min Range: 75-100%
Label Size: Normal
Chart Timeframe: 15-minute
```
---
## 📈 TIMEFRAME SELECTION GUIDE
| Your Timeframe | What You See | Best For |
|---------------|--------------|----------|
| **1-minute** | Every tick, high noise | Scalping, precision entries |
| **5-minute** | Balanced clarity | Day trading (RECOMMENDED) |
| **15-minute** | Clean structure | Swing positions |
| **30-minute** | Too compressed | Not recommended (can't see ORB form) |
**💡 PRO TIP:**
- **Primary chart: 5-minute** (for entries and monitoring)
- **Secondary chart: 1-minute** (for precise timing)
- **Never go above 15-minute** (ORBs won't form properly)
---
## 🧠 READING THE 3-ORB STRUCTURE
### **Bullish Alignment Patterns**
```
PATTERN 1: "Staircase Expansion"
5min: ━━━━ (tight, 60 pts)
15min: ━━━━━━ (wider, 90 pts)
30min: ━━━━━━━━ (widest, 120 pts)
→ Bullish expansion, expect upside breakout
PATTERN 2: "Nested Compression"
5min: ━━ (30 pts)
15min: ━━━ (35 pts)
30min: ━━━━ (40 pts)
→ All tight, explosive breakout likely
PATTERN 3: "Early Commitment"
5min: ━━━━━━ (100 pts, already broken up)
15min: ━━━━━ (80 pts, holding)
30min: ━━━━━ (110 pts, about to break)
→ 5min led the way, 30min confirmation coming
```
### **Bearish Alignment Patterns**
```
PATTERN 1: "Waterfall Setup"
5min: ━━━━ (50 pts, broke down)
15min: ━━━━━ (70 pts, broke down)
30min: ━━━━━━ (90 pts, about to break)
→ Sequential breakdown, strong bearish momentum
PATTERN 2: "Failed Highs"
5min: ━━━━━━ (upper wick rejections)
15min: ━━━━━━ (couldn't break)
30min: ━━━━━━━ (topped out)
→ All 3 rejecting highs, bearish reversal likely
```
### **Neutral/Chop Patterns (AVOID TRADING)**
```
PATTERN 1: "Wide Divergence"
5min: ━━ (30 pts)
15min: ━━━━━━━ (120 pts)
30min: ━━━━━━━━━━━ (200 pts)
→ No consensus, unpredictable, skip
PATTERN 2: "Whipsaw City"
• Price breaking 5min up, then down, then up again
• 15min and 30min not aligned
• VWAP getting crossed every 5 minutes
→ Chop day, step aside, wait for clarity
```
---
## 📊 INTEGRATION WITH YM ULTIMATE SNIPER v8.1
**The 2-System Confluence Method:**
```
┌─────────────────────────────────────────────────────────────┐
│ STEP 1: SNIPER ORB → Defines "Zones That Matter" │
│ • 30min ORB = primary institutional range │
│ • VWAP = fair value anchor │
│ • Targets = profit zones │
│ • 5min/15min = early warning signals │
└─────────────────────────────────────────────────────────────┘
↓
┌─────────────────────────────────────────────────────────────┐
│ STEP 2: YM ULTIMATE SNIPER → Triggers precise entry │
│ • Wait for GOD MODE signal AT 30min ORB boundary │
│ • 6-gate filter: Score ≥9, fat body ≥70%, delta ≥70% │
│ • Candle Dominance Index (CDI) ≥7 │
│ • Intrabar pressure consistent throughout formation │
└─────────────────────────────────────────────────────────────┘
↓
┌─────────────────────────────────────────────────────────────┐
│ STEP 3: EXECUTE TRADE │
│ • ORB breakout + GOD MODE = MAXIMUM PROBABILITY │
│ • Enter ONLY when BOTH systems align │
│ • This is TRUE "sniper" trading (2-5 trades/day max) │
└─────────────────────────────────────────────────────────────┘
```
**Confluence Scoring for Combined System:**
```
SNIPER ORB Criteria:
□ 30min ORB complete (10:00 AM+) +2 points
□ All 3 ORBs broken in same direction +2 points
□ VWAP alignment (below=bull, above=bear) +1 point
□ Volume spike on breakout candle +1 point
□ Tight 3-ORB compression (<100pt divergence) +1 point
YM ULTIMATE SNIPER Criteria:
□ GOD MODE signal at ORB boundary +3 points
□ Score ≥9.0 (tier classification) +1 point
□ Candle Dominance Index (CDI) ≥8 +1 point
TOTAL POSSIBLE: 12 points
TRADE EXECUTION RULES:
• 10-12 points = MAX SIZE (this is the holy grail setup)
• 8-9 points = FULL SIZE (high probability)
• 6-7 points = HALF SIZE (moderate probability)
• <6 points = NO TRADE (wait for better alignment)
```
---
## 💡 COMMON MISTAKES & FIXES
```
❌ MISTAKE: Trading before 30min ORB completes
✅ FIX: Wait until 10:00 AM (NY) or 3:30 AM (London), NO EXCEPTIONS
❌ MISTAKE: Ignoring 5min and 15min ORBs (only watching 30min)
✅ FIX: Use all 3 for confluence - they're your early warning system
❌ MISTAKE: Chasing breakouts 100+ points beyond 30min ORB
✅ FIX: Wait for pullback to VWAP or 30min boundary for re-entry
❌ MISTAKE: Not adjusting target % for market conditions
✅ FIX: Volatile day (ORB >200pts)? Use 75-100% targets
Calm day (ORB <80pts)? Use 30-40% targets
❌ MISTAKE: Trading when all 3 ORBs are wildly different sizes
✅ FIX: Skip the day if 5m/15m/30m diverge by >100pts - no consensus
❌ MISTAKE: Forgetting VWAP position
✅ FIX: VWAP MUST confirm bias:
• Long: price > VWAP
• Short: price < VWAP
• If VWAP contradicts, skip the trade
❌ MISTAKE: Not respecting the 3-strike rule
✅ FIX: 3 losses = DONE for the session, no rationalization
❌ MISTAKE: Trading during lunch (12:00-1:00 PM ET)
✅ FIX: Volume dies, ORBs lose relevance, false signals increase
```
---
## 🔔 ALERT SETUP (ESSENTIAL)
**TradingView Alerts You MUST Set:**
```
ALERT 1: "30min ORB Complete"
• Type: Time-based
• Trigger: 10:00 AM ET (NY) or 3:30 AM ET (London)
• Message: "🎯 30min ORB complete - targets now active"
ALERT 2: "30min ORB High Breakout"
• Type: Crossing Up
• Value 1: Close
• Value 2: 30min ORB High (purple line)
• Message: "🚀 30m ORB HIGH broken - check for long setup"
ALERT 3: "30min ORB Low Breakdown"
• Type: Crossing Down
• Value 1: Close
• Value 2: 30min ORB Low (purple line)
• Message: "📉 30m ORB LOW broken - check for short setup"
ALERT 4: "VWAP Cross"
• Type: Crossing
• Value 1: Close
• Value 2: VWAP
• Message: "⚡ VWAP crossed - check institutional bias shift"
ALERT 5: "Target 1 Hit"
• Type: Crossing
• Value 1: High (for longs) or Low (for shorts)
• Value 2: First target line
• Message: "🎯 Target 1 hit - take 50% off, move stop to BE"
```
---
## 📱 MOBILE TRADING WORKFLOW
**TradingView Mobile App Setup:**
```
1. SAVE LAYOUT
• Chart: 5-minute timeframe
• SNIPER ORB indicator loaded
• YM Ultimate SNIPER v8.1 loaded (if using)
• Save as "SNIPER ORB - YM"
2. ENABLE NOTIFICATIONS
• Settings → Notifications → Push Alerts: ON
• All 5 alerts above configured
3. QUICK ACCESS
• Add YM futures to Watchlist: "MYM" or "YM1!"
• Pin SNIPER ORB layout to favorites
4. EXECUTION READY
• Broker app (TastyTrade, NinjaTrader, etc.) logged in
• Preset bracket orders:
- Entry: market order
- Stop: 30m ORB opposite boundary
- Targets: 3 levels (50%, 30%, 20% of position)
5. BATTERY & CONNECTIVITY
• Phone charged 100% before session
• Stable WiFi or LTE connection
• Backup power bank available
```
---
## 🎓 DAILY PERFORMANCE JOURNAL
**After Each Trading Session (MANDATORY):**
```
═══════════════════════════════════════════════════════════════
DATE: __________ SESSION: □ London □ New York
═══════════════════════════════════════════════════════════════
ORB DATA:
• 5min ORB Range: ______ points
• 15min ORB Range: ______ points
• 30min ORB Range: ______ points
• Alignment: □ Tight □ Moderate □ Wide (skip if wide)
VWAP BEHAVIOR:
• Opening position: □ Above price □ Below price □ Mixed
• Did VWAP act as support/resistance? □ Yes □ No
TRADES TAKEN:
Total Setups Identified: _____
Trades Executed: _____
Win/Loss Record: _____ W / _____ L
Win Rate: _____%
Gross P&L: $_______
Net P&L (after commissions): $_______
BEST TRADE:
• Setup: ____________________ (which of the 5 setups?)
• Entry Price: ______ Exit Price: ______
• Profit: $_______
• What went RIGHT: _________________________________
_________________________________________________
WORST TRADE:
• Setup: ____________________
• Entry Price: ______ Exit Price: ______
• Loss: $_______
• What went WRONG: _________________________________
_________________________________________________
• Lesson Learned: ___________________________________
3-STRIKE RULE STATUS:
□ No losses (great day)
□ 1 loss (still in game)
□ 2 losses (caution, half size)
□ 3 losses (stopped for day, as required)
TOMORROW'S ADJUSTMENTS:
□ _________________________________________________
□ _________________________________________________
□ _________________________________________________
EMOTIONAL STATE TODAY:
□ Calm & focused (optimal)
□ Anxious/rushed (need to work on patience)
□ Overconfident (dial back position size)
□ Fearful (review winning trades to build confidence)
═══════════════════════════════════════════════════════════════
```
---
## 🚀 YOUR FIRST LIVE TRADE WALKTHROUGH
**Step-by-Step for New York Session (Most Common):**
```
⏰ 9:15 AM ET - PREPARATION
□ Load SNIPER ORB on YM 5-minute chart
□ Select "New York" session in indicator settings
□ Verify VWAP is showing (gold line)
□ Check economic calendar (any big news at 9:30?)
□ Prepare mentally: "I will wait for 30min ORB to complete"
⏰ 9:30 AM ET - SESSION OPENS
□ Watch 3 ORBs begin forming:
• Blue lines (5min) will lock in at 9:35 AM
• Cyan lines (15min) will lock in at 9:45 AM
• Purple lines (30min) will lock in at 10:00 AM
□ Observe VWAP anchoring at 9:30 AM candle
□ DO NOT TRADE YET - just observe
⏰ 9:35 AM - 5MIN ORB COMPLETE
□ Note 5min high/low (blue lines locked)
□ Check info table: "5m Range = XX points"
□ If 5min ORB breaks early, note direction but DON'T ENTER
⏰ 9:45 AM - 15MIN ORB COMPLETE
□ Note 15min high/low (cyan lines locked)
□ Compare to 5min ORB: Aligned? Expanding?
□ Still waiting... patience pays
⏰ 10:00 AM - 30MIN ORB COMPLETE (TARGETS APPEAR!)
□ Purple lines locked (30m high/low)
□ Green/red dashed target lines appear automatically
□ Info table shows "Status: ✓ Complete"
□ NOW you can trade breakouts
⏰ 10:00 AM - 11:30 AM - TRADING WINDOW
□ Wait for price to break purple line (30m ORB high or low)
□ Confirm:
1. All 3 ORBs broken in same direction?
2. VWAP confirming (below=bullish, above=bearish)?
3. Volume spike visible?
4. YM SNIPER GOD MODE signal? (if using)
□ If all YES → ENTER TRADE:
• Market order at breakout close
• Stop at 30m ORB opposite boundary
• Targets at green/red dashed lines
⏰ TARGET MANAGEMENT
□ Price hits first target (1x) → Take 50% off, move stop to BE
□ Price hits second target (2x) → Take 30% off, trail stop
□ Price hits third target (3x) → Take 15% off, let 5% run
⏰ 12:00 PM - LUNCH (AVOID TRADING)
□ Volume dies down
□ ORBs become less relevant
□ Take a break, review morning trades
⏰ 1:00 PM - 3:00 PM - AFTERNOON SESSION
□ ORBs still valid but less reliable
□ Consider waiting for Power Hour (3:00-4:00 PM)
⏰ 5:00 PM - SESSION END
□ All ORB lines disappear automatically
□ VWAP disappears automatically
□ Chart cleans itself - ready for tomorrow
□ Fill out daily journal
```
---
## 🏆 WINNING MINDSET AFFIRMATIONS
Read these BEFORE each trading session:
```
"I trade ORBs, not chaos. Structure gives me edge."
"3 high-quality trades beat 20 mediocre ones."
"The 30min ORB is my anchor. I wait for it. Every. Single. Time."
"When all 3 ORBs align, institutions are unified. I follow."
"VWAP is my institutional compass. I respect its guidance."
"3 strikes and I'm out. Discipline > Ego."
"I am a SNIPER, not a machine gunner. Precision wins."
"My edge is patience. Let the ORBs complete."
"I don't predict. I react to proven structure."
"One perfect setup is worth waiting all morning."
```
---
## 📞 TROUBLESHOOTING
**"ORB lines not showing on chart!"**
→ Check timeframe: Must be 1min-30min (not daily/weekly)
→ Verify session time: Must be during London (3AM-9:30AM) or NY (9:30AM-5PM)
→ Check indicator status: Should say "⏳ Forming" or "✓ Complete" in table
**"Targets not appearing!"**
→ 30min ORB must be complete (10:00 AM NY / 3:30 AM London)
→ Check "Number of Targets" setting (must be ≥1)
→ Verify "Target % of 30min Range" is set (default 50%)
**"VWAP disappeared!"**
→ Normal behavior: VWAP auto-deletes at session end (5PM NY / 9:30AM London)
→ Toggle "Show Anchored VWAP" OFF then ON to reset
→ Check if you're viewing chart outside session hours
**"All 3 ORBs look the same!"**
→ This is actually GOOD - means tight alignment (high-probability setup)
→ If they're diverging wildly (>100pts difference), that's a skip signal
**"Info table blocking my view!"**
→ Info table is in top-right corner by default
→ Drag it to a different position (TradingView allows moving)
→ Or minimize it by clicking the small arrow
**"Colors are hard to see on my chart!"**
→ Go to indicator settings:
• "5min ORB", "15min ORB", "30min ORB" color pickers
• "Upside Targets", "Downside Targets" color pickers
• Recommended: Use contrasting colors vs your chart background
---
## 📚 ADVANCED INTEGRATION TECHNIQUES
### **Combining with Market Profile**
```
• Use Volume Profile to identify Value Area High (VAH) and Low (VAL)
• If 30min ORB aligns with VAH/VAL → extra confluence
• POC (Point of Control) acts similar to VWAP
```
### **Combining with Cumulative Delta**
```
• Check if delta is positive on 30min ORB high break (bullish confirmation)
• Negative delta on low break confirms bearish institutional flow
• Your YM SNIPER already tracks this - use together!
```
### **Combining with Options Flow**
```
• Large call buying near 30min ORB high? Institutions positioning for breakout
• Large put buying near 30min ORB low? Smart money hedging/shorting
• Tools: Unusual Whales, Cheddar Flow, OptionStrat
```
---
## 🎯 FINAL PRE-LIVE CHECKLIST
**DO NOT GO LIVE UNTIL ALL CHECKED:**
```
□ Practiced on TradingView Replay for 2+ weeks
□ Can identify all 5 setups by pattern recognition
□ Understand why targets come from 30min ORB only
□ Know difference between 5min/15min/30min roles
□ Risk management rules memorized (position sizing, 3-strike)
□ YM Ultimate SNIPER v8.1 loaded (optional but recommended)
□ All 5 TradingView alerts configured
□ Broker platform tested with demo account
□ Stop/target orders can be placed in <10 seconds
□ Daily journal template prepared
□ Emotional state: calm, patient, focused
□ Account size: Minimum $10,000 recommended
□ Understand auto-disappear behavior (ORBs delete at session end)
□ Know NOT to trade before 30min ORB complete
□ Comfortable with looking at chart and seeing 6+ lines (3 ORBs + targets)
IF ALL CHECKED → YOU'RE READY TO SNIPE! 🎯
IF ANY UNCHECKED → KEEP PRACTICING, DON'T RUSH
```
---
## 💎 THE CORE PRINCIPLE
```
╔═══════════════════════════════════════════════════════════╗
║ ║
║ "The ORB doesn't predict the market. ║
║ The ORB reveals where institutions are positioned. ║
║ ║
║ When you see all 3 ORBs align and break, ║
║ you're not guessing direction— ║
║ you're following the billion-dollar order flow." ║
║ ║
║ THAT'S YOUR EDGE. ║
║ ║
╚═══════════════════════════════════════════════════════════╝
```
**🎯 Good luck, stay patient, and happy sniping! 🎯**
═══════════════════════════════════════════════════════════════════
END OF SNIPER ORB TRADING CHEAT SHEET v3.0
═══════════════════════════════════════════════════════════════════


