BayesStack RSI [CHE]BayesStack RSI — Stacked RSI with Bayesian outcome stats and gradient visualization
Summary
BayesStack RSI builds a four-length RSI stack and evaluates it with a simple Bayesian success model over a rolling window. It highlights bull and bear stack regimes, colors price with magnitude-based gradients, and reports per-regime counts, wins, and estimated win rate in a compact table. Signals seek to be more robust through explicit ordering tolerance, optional midline gating, and outcome evaluation that waits for events to mature by a fixed horizon. The design focuses on readable structure, conservative confirmation, and actionable context rather than raw oscillator flips.
Motivation: Why this design?
Classical RSI signals flip frequently in volatile phases and drift in calm regimes. Pure threshold rules often misclassify shallow pullbacks and stacked momentum phases. The core idea here is ordered, spaced RSI layers combined with outcome tracking. By requiring a consistent order with a tolerance and optionally gating by the midline, regime identification becomes clearer. A horizon-based maturation check and smoothed win-rate estimate provide pragmatic feedback about how often a given stack has recently worked.
What’s different vs. standard approaches?
Reference baseline: Traditional single-length RSI with overbought and oversold rules or simple crossovers.
Architecture differences:
Four fixed RSI lengths with strict ordering and a spacing tolerance.
Optional requirement that all RSI values stay above or below the midline for bull or bear regimes.
Outcome evaluation after a fixed horizon, then rolling counts and a prior-smoothed win rate.
Dispersion measurement across the four RSIs with a percent-rank diagnostic.
Gradient coloring of candles and wicks driven by stack magnitude.
A last-bar statistics table with counts, wins, win rate, dispersion, and priors.
Practical effect: Charts emphasize sustained momentum alignment instead of single-length crosses. Users see when regimes start, how strong alignment is, and how that regime has recently performed for the chosen horizon.
How it works (technical)
The script computes RSI on four lengths and forms a “stack” when they are strictly ordered with at least the chosen tolerance between adjacent lengths. A bull stack requires a descending set from long to short with positive spacing. A bear stack requires the opposite. Optional gating further requires all RSI values to sit above or below the midline.
For evaluation, each detected stack is checked again after the horizon has fully elapsed. A bull event is a success if price is higher than it was at event time after the horizon has passed. A bear event succeeds if price is lower under the same rule. Rolling sums over the training window track counts and successes; a pair of priors stabilizes the win-rate estimate when sample sizes are small.
Dispersion across the four RSIs is measured and converted to a percent rank over a configurable window. Gradients for bars and wicks are normalized over a lookback, then shaped by gamma controls to emphasize strong regimes. A statistics table is created once and updated on the last bar to minimize overhead. Overlay markers and wick coloring are rendered to the price chart even though the indicator runs in a separate pane.
Parameter Guide
Source — Input series for RSI. Default: close. Tips: Use typical price or hlc3 for smoother behavior.
Overbought / Oversold — Guide levels for context. Defaults: seventy and thirty. Bounds: fifty to one hundred, zero to fifty. Tips: Narrow the band for faster feedback.
Stacking tolerance (epsilon) — Minimum spacing between adjacent RSIs to qualify as a stack. Default: zero point twenty-five RSI points. Trade-off: Higher values reduce false stacks but delay entries.
Horizon H — Bars ahead for outcome evaluation. Default: three. Trade-off: Longer horizons reduce noise but delay success attribution.
Rolling window — Lookback for counts and wins. Default: five hundred. Trade-off: Longer windows stabilize the win rate but adapt more slowly.
Alpha prior / Beta prior — Priors used to stabilize the win-rate estimate. Defaults: one and one. Trade-off: Larger priors reduce variance with sparse samples.
Show RSI 8/13/21/34 — Toggle raw RSI lines. Default: on.
Show consensus RSI — Weighted combination of the four RSIs. Default: on.
Show OB/OS zones — Draw overbought, oversold, and midline. Default: on.
Background regime — Pane background tint during bull or bear stacks. Default: on.
Overlay regime markers — Entry markers on price when a stack forms. Default: on.
Show statistics table — Last-bar table with counts, wins, win rate, dispersion, priors, and window. Default: on.
Bull requires all above fifty / Bear requires all below fifty — Midline gate. Defaults: both on. Trade-off: Stricter regimes, fewer but cleaner signals.
Enable gradient barcolor / wick coloring — Gradient visuals mapped to stack magnitude. Defaults: on. Trade-off: Clearer regime strength vs. extra rendering cost.
Collection period — Normalization window for gradients. Default: one hundred. Trade-off: Shorter values react faster but fluctuate more.
Gamma bars and shapes / Gamma plots — Curve shaping for gradients. Defaults: zero point seven and zero point eight. Trade-off: Higher values compress weak signals and emphasize strong ones.
Gradient and wick transparency — Visual opacity controls. Defaults: zero.
Up/Down colors (dark and neon) — Gradient endpoints. Defaults: green and red pairs.
Fallback neutral candles — Directional coloring when gradients are off. Default: off.
Show last candles — Limit for gradient squares rendering. Default: three hundred thirty-three.
Dispersion percent-rank length / High and Low thresholds — Window and cutoffs for dispersion diagnostics. Defaults: two hundred fifty, eighty, and twenty.
Table X/Y, Dark theme, Text size — Table anchor, theme, and typography. Defaults: right, top, dark, small.
Reading & Interpretation
RSI stack lines: Alignment and spacing convey regime quality. Wider spacing suggests stronger alignment.
Consensus RSI: A single line that summarizes the four lengths; use as a smoother reference.
Zones: Overbought, oversold, and midline provide context rather than standalone triggers.
Background tint: Indicates active bull or bear stack.
Markers: “Bull Stack Enter” or “Bear Stack Enter” appears when the stack first forms.
Gradients: Brighter tones suggest stronger stack magnitude; dull tones suggest weak alignment.
Table: Count and Wins show sample size and successes over the window. P(win) is a prior-stabilized estimate. Dispersion percent rank near the high threshold flags stretched alignment; near the low threshold flags tight clustering.
Practical Workflows & Combinations
Trend following: Enter only on new stack markers aligned with structure such as higher highs and higher lows for bull, or lower lows and lower highs for bear. Use the consensus RSI to avoid chasing into overbought or oversold extremes.
Exits and stops: Consider reducing exposure when dispersion percent rank reaches the high threshold or when the stack loses ordering. Use the table’s P(win) as a context check rather than a direct signal.
Multi-asset and multi-timeframe: Defaults travel well on liquid assets from intraday to daily. Combine with higher-timeframe structure or moving averages for regime confirmation. The script itself does not fetch higher-timeframe data.
Behavior, Constraints & Performance
Repaint and confirmation: Stack markers evaluate on the live bar and can flip until close. Alert behavior follows TradingView settings. Outcome evaluation uses matured events and does not look into the future.
HTF and security: Not used. Repaint paths from higher-timeframe aggregation are avoided by design.
Resources: max bars back is two thousand. The script uses rolling sums, percent rank, gradient rendering, and a last-bar table update. Shapes and colored wicks add draw overhead.
Known limits: Lag can appear after sharp turns. Very small windows can overfit recent noise. P(win) is sensitive to sample size and priors. Dispersion normalization depends on the collection period.
Sensible Defaults & Quick Tuning
Start with the shipped defaults.
Too many flips: Increase stacking tolerance, enable midline gates, or lengthen the collection period.
Too sluggish: Reduce stacking tolerance, shorten the collection period, or relax midline gates.
Sparse samples: Extend the rolling window or increase priors to stabilize P(win).
Visual overload: Disable gradient squares or wick coloring, or raise transparency.
What this indicator is—and isn’t
This is a visualization and context layer for RSI stack regimes with simple outcome statistics. It is not a complete trading system, not predictive, and not a signal generator on its own. Use it with market structure, risk controls, and position management that fit your process.
Metadata
- Pine version: v6
- Overlay: false (price overlays are drawn via forced overlay where applicable)
- Primary outputs: Four RSI lines, consensus line, OB/OS guides, background tint, entry markers, gradient bars and wicks, statistics table
- Inputs with defaults: See Parameter Guide
- Metrics and functions used: RSI, rolling sums, percent rank, dispersion across RSI set, gradient color mapping, table rendering, alerts
- Special techniques: Ordered RSI stacking with tolerance, optional midline gating, horizon-based outcome maturation, prior-stabilized win rate, gradient normalization with gamma shaping
- Performance and constraints: max bars back two thousand, rendering of shapes and table on last bar, no higher-timeframe data, no security calls
- Recommended use-cases: Regime confirmation, momentum alignment, post-entry management with dispersion and recent outcome context
- Compatibility: Works across assets and timeframes that support RSI
- Limitations and risks: Sensitive to parameter choices and market regime changes; not a standalone strategy
- Diagnostics: Statistics table, dispersion percent rank, gradient intensity
Disclaimer
The content provided, including all code and materials, is strictly for educational and informational purposes only. It is not intended as, and should not be interpreted as, financial advice, a recommendation to buy or sell any financial instrument, or an offer of any financial product or service. All strategies, tools, and examples discussed are provided for illustrative purposes to demonstrate coding techniques and the functionality of Pine Script within a trading context.
Any results from strategies or tools provided are hypothetical, and past performance is not indicative of future results. Trading and investing involve high risk, including the potential loss of principal, and may not be suitable for all individuals. Before making any trading decisions, please consult with a qualified financial professional to understand the risks involved.
By using this script, you acknowledge and agree that any trading decisions are made solely at your discretion and risk.
Best regards and happy trading
Chervolino.
Do not use this indicator on Heikin-Ashi, Renko, Kagi, Point-and-Figure, or Range charts, as these chart types can produce unrealistic results for signal markers and alerts.
Rsicrossover

RSI-EMA-Crossing with Donchian-Stop-LossThe Donchian RSI Indicator is a visual tool that combines momentum and trend analysis to identify high-quality long opportunities based on RSI crossovers, price action, and Donchian channel dynamics.
How It Works
Momentum Signal: A bullish RSI crossover is detected when the RSI crosses above its moving average.
Trend Filter: A signal is only valid if the crossover occurs while the price is above its moving average – filtering out entries against the prevailing trend.
Signal Candle: The high of the crossover candle is stored.
Entry Trigger: A valid signal occurs when a later candle closes above that signal high.
Stop-Loss (Visual Only)
The lower band of the Donchian Channel acts as a visual reference for a dynamic stop-loss level.
Features
Customizable RSI, Donchian Channel, and moving average lengths
Selectable MA types: SMA, EMA, WMA, VWMA, HMA
Signal candle highlighted (yellow background)
Entry points labeled on the chart
Price MA and Donchian Channel plotted
Trend filter improves signal quality by confirming upward bias
Use Case
Designed for swing and position traders
Optimized for use on daily or 4H charts

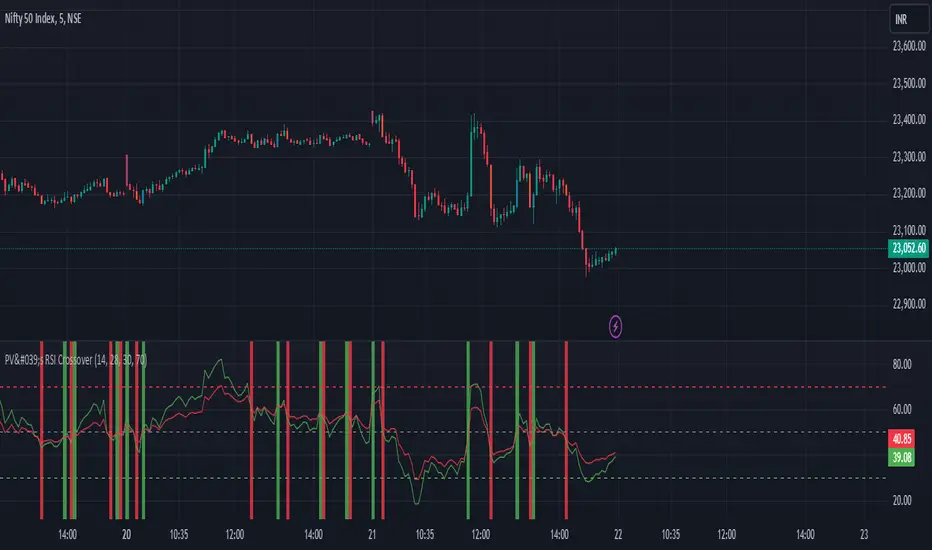
PV's Dual RSI Crossover StrategyIntroduction to the Dual RSI Two-Cross Indicator
The Relative Strength Index (RSI) is a widely used technical indicator in finance that measures the magnitude of recent price changes to determine overbought or oversold conditions. The RSI Two-Cross indicator takes this concept a step further by introducing a unique twist: it plots two RSI lines with different lengths and generates alerts based on their crossovers.
Key Features:
Dual RSI Lines: The indicator plots two RSI lines with user-defined lengths, allowing traders to compare the short-term and long-term momentum of an asset.
Crossover Alerts: The indicator generates alerts when the shorter RSI line crosses above or below the longer RSI line, indicating potential trend reversals or continuations.
Customizable Parameters: Users can adjust the lengths of the RSI lines, oversold and overbought levels, and other parameters to suit their trading strategy and asset of choice.
Visual Aids: The indicator features colored bars and backgrounds to highlight crossover events, making it easy to identify trading opportunities at a glance.
Trading Applications:
Trend Reversal Detection: The RSI Two-Cross indicator can help traders identify potential trend reversals by monitoring crossovers between the two RSI lines.
Momentum Confirmation: The indicator can be used to confirm momentum shifts in an asset's price, helping traders to filter out false signals and make more informed trading decisions.
Scalping and Day Trading: The indicator's short-term focus makes it suitable for scalping and day trading strategies, where traders aim to capitalize on small price movements.
By combining the versatility of the RSI with the power of crossover analysis, the RSI Two-Cross indicator offers a unique perspective on market momentum and trend dynamics. Whether you're a seasoned trader or just starting out, this indicator can help you navigate the markets with greater confidence and precision.
RSI BB StdDev SignalOverview
The RSI BB StdDev Signal Indicator is a powerful tool designed to enhance your trading strategy by combining the Relative Strength Index (RSI) with Bollinger Bands (BB). This unique combination allows traders to identify potential buy and sell signals more accurately by leveraging the strengths of both indicators. The RSI helps in identifying overbought and oversold conditions, while the Bollinger Bands provide a dynamic range to assess volatility and potential price reversals.
Key Features
— RSI Calculation: The indicator calculates the RSI based on user-defined parameters, allowing for customization to fit different trading styles.
— Bollinger Bands Integration: The RSI values are smoothed using a moving average, and Bollinger Bands are applied to this smoothed RSI to generate buy and sell signals.
— Divergence Detection: The indicator includes an optional feature to detect and alert on bullish and bearish divergences between the RSI and price action.
— Customizable Alerts: Users can set up alerts for buy and sell signals, as well as for divergences, ensuring they never miss a trading opportunity.
— Visual Aids: The indicator plots the RSI, Bollinger Bands, and signals on the chart, making it easy to visualize and interpret the data.
How It Works
1. RSI Calculation:
— The RSI is calculated using the change in the source input (default is close price) over a specified period.
— The RSI values are then plotted on the chart with customizable overbought and oversold levels.
2. Smoothing and Bollinger Bands:
— The RSI values are smoothed using a moving average (SMA, EMA, SMMA, WMA, VWMA) selected by the user.
— Bollinger Bands are applied to the smoothed RSI to create dynamic upper and lower bands.
3. Signal Generation:
—Buy signals are generated when the RSI crosses above the lower Bollinger Band.
—Sell signals are generated when the RSI crosses below the upper Bollinger Band.
—These signals are plotted on both the RSI pane and the main price chart for easy reference.
4. Divergence Detection:
— The indicator can detect and alert on regular bullish and bearish divergences between the RSI and price action.
— Bullish divergences occur when the price makes a lower low, but the RSI makes a higher low.
— Bearish divergences occur when the price makes a higher high, but the RSI makes a lower high.
Usage
1. Setting Up:
— Add the indicator to your TradingView chart.
— Customize the RSI length, source, and other parameters in the settings panel.
— Enable or disable the divergence detection based on your trading strategy.
2. Interpreting Signals:
— Use the buy and sell signals generated by the RSI crossing the Bollinger Bands as potential entry and exit points.
— Pay attention to divergences for additional confirmation of trend reversals.
3. Alerts:
— Set up alerts for buy and sell signals to receive notifications in real-time.
— Enable divergence alerts to be notified of potential trend reversals.
Conclusion
The RSI BB StdDev Signal Indicator is a comprehensive tool that combines the strengths of the RSI and Bollinger Bands to provide traders with more accurate and reliable signals. Whether you are a beginner or an experienced trader, this indicator can enhance your trading strategy by offering clear visual cues and customizable alerts.
Note
This indicator is provided with open-source code, allowing users to understand its logic and customize it further if needed. The detailed description and customizable settings ensure that traders of all levels can benefit from its unique features.

Multiple RSITitle: MultiRSI: A Versatile Multi-Timeframe RSI Indicator
Short Description:
A powerful RSI-based indicator that incorporates three RSI lengths (Fast, Medium, and Slow) to help traders analyze trends, momentum, and potential reversals with clear visual signals.
Full Description:
Overview:
The MultiRSI script provides traders with a dynamic tool to assess market conditions across multiple RSI timeframes. It calculates Fast, Medium, and Slow RSI values, assigns meaningful colors based on trend analysis, and highlights key crossover points for actionable insights.
Key Features:
Triple RSI Display:
Fast RSI (default: 8): Ideal for capturing short-term momentum.
Medium RSI (default: 12): Provides a balanced perspective.
Slow RSI (default: 16): Helps identify longer-term trends.
Trend Analysis:
Color-coded RSI lines:
Green, blue, and aqua for uptrends.
Yellow, orange, and red for potential downtrends.
Visual differentiation for easy interpretation.
Crossover Signals:
Upward Cross (triangle up): Indicates potential bullish momentum.
Downward Cross (triangle down): Suggests possible bearish momentum.
Marked directly on the chart for clarity.
Customizable Inputs:
Adjust RSI lengths to suit your trading strategy.
Grouped input settings for a seamless configuration experience.
Usage Scenarios:
Identify trend strength and reversals in different timeframes.
Spot key momentum shifts with crossover signals.
Combine with other indicators for a comprehensive trading strategy.
How It Works:
The script compares the Fast RSI against the Medium RSI and the Medium RSI against the Slow RSI to determine short-, medium-, and long-term trends. Crossovers between Medium and Slow RSI values signal potential momentum shifts.
Visualization:
Clear, color-coded plots for the three RSI levels.
Highlighted crossovers for quick decision-making.
License:
This script is open-source under the Mozilla Public License 2.0. Feel free to use, modify, and share!

Scalping Strategy (5min)This indicator is designed for scalping strategies on a 5-minute timeframe. It generates signals based on two RSI crossovers and incorporates moving averages to identify trends. Additionally, a Bollinger Band is included to eliminate the need for an additional Bollinger Band on the chart.
Please note that this indicator does not guarantee 100% accurate signals and may produce false signals. It is recommended to use this indicator in conjunction with other indicators such as Stochastic, MACD, SuperTrend, or any other suitable indicators to enhance the accuracy of trading decisions.
1) Signal Generation: The indicator generates buy and sell signals based on two RSI crossovers. A buy signal is generated when the fast RSI crosses above the slow RSI, indicating potential bullish momentum. Conversely, a sell signal is generated when the fast RSI crosses below the slow RSI, suggesting potential bearish momentum.
2) To adjust the indicator to your specific chart and trading preferences, you have the flexibility to modify the RSI and moving average (MA) values. By changing the RSI values (slow RSI length and fast RSI length), you can fine-tune the sensitivity of the RSI crossovers to suit different timeframes and market conditions. Similarly, adjusting the MA values (slow MA period and fast MA period) allows you to adapt the indicator to the desired trend identification and short-term trend confirmation.
3) Pay attention to trades that are confirmed by the short-term moving average (MA) aligning with the desired direction. For buy signals, ensure that the short MA is tending upward, indicating a potential uptrend. For sell signals, confirm that the short MA is trending downward, suggesting a potential downtrend.
4) Moving Averages: The indicator uses a 200-period moving average (MA) to identify the overall trend and a short-term MA for additional confirmation.
5) Bollinger Band: The included Bollinger Band is not directly used in the indicator's calculations. However, it is provided for convenience so that users don't need to add another Bollinger Band to their chart separately.
6) Exercise caution when the short MA is below the 200-period MA but showing signs of attempting an upward move. These situations may indicate a potential reversal or consolidation, and it is advisable to avoid taking trades solely based on the 200-period MA crossover in such cases.
Remember that these guidelines are intended to provide additional insights and should be used in combination with your trading judgment and analysis.

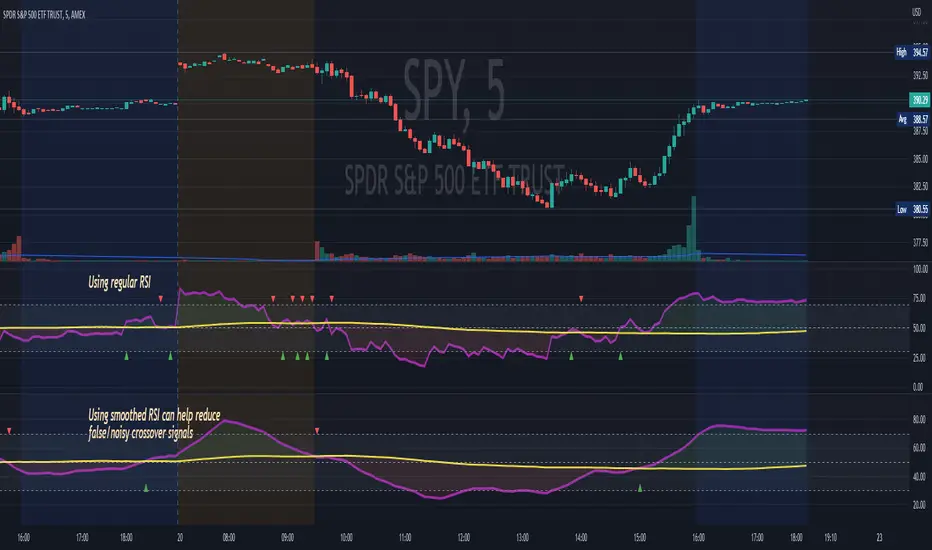
RSI MA CrossBuilding onto the standard RSI indicator, with the following modification and improvements:
- Added signals for RSI moving average crossovers, which usually indicator a bull or bear trend
- Added option to use smoothed RSI line
- Added alert for crossover signals
Enjoy~~~!