Fixed Risk + Contracts 2.0This is the upgraded version of my Contracts/Risk indicator, released in January 2026. Users will trade responsibly (and never overleverage again!)
1. Pre-Select Your Ticker
MES ES
NQ MNQ
MYM YM
M2K MCL MGC
GC SIL SI
2. Input Current Account Balance and Risk % Each Trade To Grow Your Account
3. Input Stop Amount In Ticks (Use Position Tool for ease)
4. Contract Risk Is Calculated Automatically!
Add to your favourites and comment below if you have any suggestions :)
Risk-management

ADR**Overview**
This indicator displays the **Average Daily Range (ADR)** and **ADR Percentage** in a customizable table on your chart.
While the standard ATR (Average True Range) is a popular metric for volatility, it accounts for price gaps (e.g., overnight moves). **ADR**, on the other hand, strictly measures the average distance between the **High** and **Low** of price bars, completely ignoring gaps.
**Why use ADR instead of ATR?**
* **Day Trading:** For intraday traders (Forex, Crypto, Futures), ADR is often preferred because it calculates the "tradable" range of the day. It answers the question: *"On average, how much does this asset move from High to Low?"*
* **Target Setting:** ADR is excellent for projecting daily highs and lows. If price has already moved 100% of its ADR, the statistical probability of further extension decreases.
* **Pure Volatility:** It filters out the noise of overnight gaps to show pure intraday volatility.
**Calculation Logic**
* **ADR:** Calculated using a Simple Moving Average (SMA) of the `High - Low` range over the specified length.
* Formula: `SMA(High - Low, Length)`
* **ADR%:** Shows the ADR relative to the current price.
* Formula: `(ADR / Current Close) * 100`
**Features**
* **Clean Dashboard:** A minimalist table displays the ADR value and the ADR %.
* **Customizable:** You can change the calculation length (default is 14) and move the table to any corner of the chart (Top/Bottom, Left/Right) to fit your workspace.
**Settings**
* **ADR Length:** The lookback period for the average (Default: 14).
* **Display Position:** Choose where the table appears on your screen.

A Perfectly Simple Risk CalculatorA Perfectly Simple Risk Calculator
I use bad risk.
I learned my lesson.
This tool will tell me how many contracts to use according to my risk amount.
Thank you Grok for writing me this code.

Maor Beniash | Pro DashboardMB-PRO | Smart Info & Risk Dashboard
Description The MB-PRO indicator is a minimalist dashboard designed to provide traders with rapid situational awareness and critical risk management data, without cluttering the chart. This tool consolidates fundamental and technical data into one organized corner, helping avoid common errors such as entering a trade right before an earnings report or incorrect stop-loss calculations.
Key Features:
Full Company Name: Displays the complete name of the entity.
Market Cap: Shows the current market capitalization.
Sector & Industry: Quickly identifies the sector and industry classification.
Risk Management (ATR): Displays the Average True Range (14) in both absolute value and percentage (crucial for stop-loss sizing).
Earnings Alert: A smart warning mechanism where the text automatically turns orange when the report date is approaching (default: 21 days, adjustable). This helps prevent holding positions during high-risk periods.

DkS Market Structure Breakout Strategy Crypto & ForexDkS Market Structure Breakout Strategy Crypto & Forex
🔍 Overview
DkSPro – Universal Market Analysis is a structure-based trading strategy designed for Crypto and Forex markets, focused on trend alignment, breakout confirmation, and volume validation.
This strategy is built to filter low-quality trades, avoid ranging conditions, and reduce false breakouts by requiring multiple layers of confirmation before any trade is executed.
It is intended for scalping and intraday trading, prioritizing consistency and risk control over trade frequency.
🧠 Strategy Logic (How It Works)
DkSPro follows a sequential decision process, not a single-indicator signal:
Trend Bias (EMA Structure)
A fast and slow EMA define the directional bias.
Long trades are only allowed during bullish EMA alignment.
Short trades are only allowed during bearish EMA alignment.
This prevents counter-trend and ranging-market entries.
Market Structure & Breakout Validation
The strategy identifies recent swing highs and lows.
Trades are triggered only after a confirmed breakout of structure, not during consolidation.
This avoids early entries and false momentum moves.
Volume Confirmation
Volume must exceed its moving average by a defined multiplier.
This ensures participation and filters out low-liquidity breakouts.
Volume thresholds adapt depending on the selected trading mode.
Momentum Confirmation (RSI)
RSI is used strictly as a momentum filter, not as a standalone signal.
It confirms that price movement aligns with the breakout direction.
Risk Management (Mandatory)
Every position includes a predefined Stop Loss and Take Profit.
Position sizing is based on a fixed percentage of equity, keeping risk per trade within sustainable limits.
All conditions must align simultaneously; otherwise, no trade is executed.
⚙️ Trading Modes
SAFE Mode
Stronger volume and RSI thresholds
Fewer trades, higher selectivity
Designed for risk control and consistency
AGGRESSIVE Mode
Slightly relaxed filters
Higher trade frequency during strong momentum
Intended for experienced users only
📊 Markets & Assets
This strategy has been actively used and tested on:
🟢 Crypto (Binance / Binance.US)
SOL-USDT
XRP-USDT
Other high-liquidity pairs (BTC, ETH)
Crypto mode benefits from stronger volume confirmation to adapt to higher volatility.
🔵 Forex
Major pairs such as EURUSD, GBPUSD, USDJPY
Optimized for liquid markets with lower relative volume
The same structural logic applies to both markets, with volume behavior naturally adapting to each asset class.
⏱ Recommended Timeframes
Crypto: 5m – 15m
Forex: 15m – 1H
Lower timeframes (1m) are not recommended due to noise and unreliable volume behavior.
🧪 Backtesting & Settings Transparency
Default strategy properties are intentionally conservative to reflect realistic conditions:
Initial capital: $20,000
Position size: 2% of equity
Commission: 0.08%
Slippage: 1 tick
Fixed Stop Loss and Take Profit on every trade
Backtests should be performed on sufficient historical data (ideally 6–12 months) to ensure a statistically meaningful sample size (100+ trades).
📈 Originality & Usefulness
DkSPro is not a simple indicator mashup.
Each component serves a specific role in a layered confirmation system:
EMAs define direction
Structure defines timing
Volume validates participation
RSI confirms momentum
Risk management controls exposure
Removing any layer significantly reduces signal quality. The strategy is designed as a complete decision framework, not a signal generator.
⚠️ Important Notes
This script is an analysis and execution tool, not financial advice.
Market conditions change, and no strategy performs well in all environments.
Users are encouraged to backtest, forward test, and adjust position sizing according to their own risk tolerance.
🧩 Version Notice
This publication represents a consolidated and refined version of an internal experimental script.
No parallel or duplicate versions are intended.
All future improvements will be released exclusively using TradingView’s Update feature.
🇪🇸 Descripción en Español (Resumen)
DkSPro es una estrategia basada en estructura de mercado, diseñada para Crypto y Forex, que combina tendencia, ruptura de estructura, volumen y control de riesgo.
Solo opera cuando todas las condiciones se alinean, evitando rangos, falsas rupturas y sobreoperar.
Ha sido utilizada en Binance con pares como SOL-USDT y XRP-USDT, así como en Forex, siempre con gestión de riesgo fija y condiciones realistas.

XAUUSD Lot Size Calculator1. What This Indicator Does
This tool is a Visual Risk Management System. Instead of using a calculator on your phone or switching tabs, it allows you to calculate the exact lot size for your trade directly on the TradingView chart by dragging lines.
It automates the math for:
Lot Size: How big your position should be to risk exactly X% of your account.
Take Profit: Where your target should be based on your Risk-to-Reward ratio.
Safety Checks: It warns you if your stop loss is too tight for the minimum lot size (0.01).
2. Visual Features
🔴 The Red Line (Stop Loss): This is your interactive line. You can grab it with your mouse and drag it to your desired invalidation point (e.g., below a support wick).
🟢 The Green Line (Take Profit): This line moves automatically. You cannot drag it. It calculates where your Take Profit must be to satisfy your Risk:Reward ratio (Default 1:1) based on where you placed the Red line.
⚫ The Info Table: A high-contrast black box in the corner that displays your calculated Lot Size, Risk amount, and Trade direction (Long/Short).
3. How to Use It (Step-by-Step)
Step 1: Initial Setup
When you first add the indicator to the chart, you need to tell it about your account:
Double-click the Black Table (or the Red Line) to open Settings.
Inputs Tab:
Account Balance: Enter your current trading balance (e.g., 10,000).
Risk %: Enter how much you want to lose per trade (e.g., 1.0%).
Contract Size: Keep this at 100 for Gold (XAUUSD) or standard Forex pairs.
Risk : Reward Ratio: Set your target (e.g., 1.0 for 1:1, or 2.0 for 1:2).
Step 2: Planning a Trade
Look at the chart and identify where you want to enter (current price) and where you want your Stop Loss.
Find the Red Line on your chart. (If you don't see it, go to Settings and change "Stop Loss Level" to a price near the current candle).
Click and Drag the Red Line to your specific Stop Loss price.
Step 3: Reading the Signals
Direction: If you drag the Red Line below the price, the table shows LONG. If you drag it above, it shows SHORT.
Lot Size: Read the big green number in the table (e.g., 0.55). This is the exact lot size you should enter in your broker.
TP Target: Look at the Green Line on the chart. That is your exit price.
Step 4: The "Orange Warning"
If you place your Stop Loss very close to the entry, or if your account is small, the math might suggest a lot size smaller than is possible (e.g., 0.004).
The table text will turn ORANGE.
The Lot Size will stick to 0.01 (the minimum).
The "Risk ($)" row will show you the actual risk. (Example: Instead of risking your desired $100, you might be forced to risk $105 because you can't trade smaller than 0.01 lots).

Quality-Controlled Trend StrategyOverview
This strategy demonstrates a clean, execution-aware trend framework with fully isolated risk management.
Entry conditions and risk logic are intentionally separated so risk parameters can be adjusted without altering signal behavior.
All calculations are evaluated on confirmed bars to ensure backtest behavior reflects real-time execution.
Design intent
Many scripts mix entries and exits in ways that make results fragile or misleading.
This strategy focuses on structural clarity by enforcing:
confirmed-bar logic only
fixed and transparent risk handling
consistent indicator calculations
one position at a time
It is intended as a baseline framework rather than an optimized system.
Trading logic (high level)
Trend context
EMA 50 vs EMA 200 defines directional bias
Entry
Price alignment with EMA 50
RSI used as a momentum confirmation, not as an overbought/oversold signal
Risk management
Stop-loss based on ATR
Fixed risk–reward structure
Risk logic is isolated from entry logic
Editing risk without affecting signals
All stop-loss and take-profit calculations are handled in a dedicated block.
Users can adjust:
ATR length
stop-loss multiplier
risk–reward ratio
without modifying entry conditions.
This allows controlled experimentation while preserving signal integrity.
Usage notes
Results vary by market, timeframe, and volatility conditions.
This script is provided for testing and educational purposes and should be validated across multiple symbols and forward-tested before use in live environments.

ML-Inspired Adaptive Momentum Strategy (TradingView v6)This strategy demonstrates an adaptive momentum approach using volatility-normalized trend strength. It is designed for educational and analytical purposes and uses deterministic, fully transparent logic compatible with Pine Script v6.
ML-Inspired Concept (Educational Context)
Pine Script cannot train or execute real machine-learning models.
Instead, this strategy demonstrates ML-style thinking by:
Converting price data into features
Normalizing features to account for volatility differences
Producing a bounded confidence score
Applying thresholds for decision making
This is not predictive AI and does not claim forecasting capability.
Strategy Logic
EMA is used to measure directional bias
EMA slope represents momentum change
ATR normalizes the slope (feature scaling)
A clamped score between −1 and +1 is generated
Trades trigger only when the score exceeds defined thresholds
Risk & Execution
Position size capped at 5% equity
Commission and slippage included for realistic testing
Signals are calculated on closed bars only
Purpose
This script is intended to help traders explore adaptive momentum concepts and understand how feature normalization can be applied in systematic trading strategies.

Live Position Sizer (LPS)Description (EN)
(Magyar leíráshoz görgess lejjebb!)
Live Position Sizer (LPS) is a discretionary trading utility designed to visualize risk, reward, and position size directly on the chart in real time.
The indicator draws a TradingView-style long or short position box and calculates the required position size based on your defined capital, maximum risk, stop-loss distance, and a user-defined lot conversion factor.
LPS is intended strictly as a decision-support and risk management tool. It does not place trades or generate automated signals.
Core features:
Automatic Long / Short position visualization
Dynamic Entry, Stop Loss, and Take Profit levels
Real-time position size calculation
Configurable Risk/Reward ratio
Fully customizable colors, transparency, and line styles
Clean, minimal on-chart labels showing direction, RR, and lot size
Only one active position box at a time for a clutter-free chart
Position sizing logic:
TradingView internally calculates position size in units, not broker-specific lots.
To bridge this difference, LPS uses a user-defined “Units per 1 Lot” multiplier.
Examples:
Forex (standard lot): 100000
Gold (XAUUSD): 1 or 100 (broker dependent)
Indices (e.g. NAS100): 1
The indicator first calculates the position size in TradingView units and then converts it to lots using this multiplier.
The displayed lot size is rounded to 0.01 lots.
Stop Loss logic:
The Stop Loss level is derived from the High or Low of a selectable previous candle.
Increasing the bar-back value places the Stop Loss further away, which:
increases stop distance
reduces position size for the same risk
Intended use:
Manual / discretionary trading
Risk management and position sizing
Trade planning and visualization
Educational purposes
Important notes:
This indicator does not execute trades
No alerts or automation by default
Lot size and contract specifications vary by broker
Always verify the exact lot or contract size with your broker before trading
------------------------------------
Description (HU)
A Live Position Sizer (LPS) egy diszkrecionális kereskedést támogató segédindikátor, amely valós időben jeleníti meg a kockázatot, a célárat és a pozícióméretet közvetlenül a charton.
Az indikátor TradingView-stílusú long vagy short pozíció boxot rajzol, és kiszámolja a szükséges pozícióméretet a megadott tőke, maximális kockázat, stop-loss távolság és egy felhasználó által definiált LOT szorzó alapján.
Az LPS nem stratégia, kizárólag döntéstámogató és kockázatkezelési eszköz.
Fő funkciók:
Automatikus Long / Short pozíció megjelenítés
Entry, Stop Loss és Take Profit szintek vizuális ábrázolása
Valós idejű pozícióméret számítás
Állítható Risk/Reward arány
Teljesen testreszabható színek, átlátszóság és vonalstílus
Letisztult chart label (irány, RR, lot méret)
Egyszerre csak egy aktív pozíció box
Pozícióméretezési logika:
A TradingView belsőleg egységekben (units) számol, nem bróker-specifikus LOT-okban.
Ennek kezelésére az LPS egy „Units per 1 Lot” beállítást használ.
Példák:
Forex standard lot: 100000
Arany (XAUUSD): 1 vagy 100 (brókertől függ)
Indexek (pl. NAS100): 1
Az indikátor először TradingView egységekben számol, majd ezt átváltja LOT-ra a megadott szorzó segítségével.
A kijelzett LOT méret 0.01-re van kerekítve.
Stop Loss logika:
A Stop Loss szint a kiválasztott korábbi gyertya high vagy low értékéből kerül meghatározásra.
Nagyobb bar-back érték:
távolabb helyezi a stopot
azonos kockázat mellett kisebb pozícióméretet eredményez
Ajánlott felhasználás:
Manuális, diszkrecionális kereskedés
Kockázatkezelés és pozícióméretezés
Trade tervezés
Oktatási célok
Fontos megjegyzések:
Az indikátor nem köt automatikusan
Alapértelmezetten nincs alert vagy automatizmus
A LOT és contract méret brókerenként eltérhet
Kereskedés előtt mindig ellenőrizd a pontos LOT / contract specifikációt a brókerednél

Goal Setting Strategies Viprasol# 🎯 Goal Setting Strategies Viprasol
A powerful goal tracking tool designed for disciplined traders who want to monitor their trading objectives, milestones, and progress directly on their charts.
## ✨ KEY FEATURES
### 📊 Flexible Goal Management
- Track anywhere from 1 to 20 trading goals simultaneously
- Adjustable goal count via simple input slider
- Each goal has its own unique emoji identifier
- Real-time progress counter
### ✅ Visual Tracking System
- Interactive checkbox system for goal completion
- Clear visual indicators (✅ completed, ⬜️ pending)
- Customizable goal names and descriptions
- Dynamic progress display
### 🎨 Full Customization
- **4 Position Options**: Top Left, Top Right, Bottom Left, Bottom Right
- **5 Font Sizes**: Tiny, Small, Normal, Large, Huge (optimized for all screen sizes)
- **Custom Colors**: Header, labels, background, achievement text
- **Premium Styling**: Modern cyber-themed design with professional appearance
### 💡 Perfect For:
- Daily/Weekly trading goal tracking
- Risk management milestones
- Profit target monitoring
- Trading plan compliance
- Personal development objectives
- Learning milestones
## 🔧 HOW TO USE
1. **Set Your Primary Goal**: Enter your main objective in "Primary Goal" field
2. **Choose Goal Count**: Select how many goals you want (1-20)
3. **Name Your Goals**: Customize each goal name in the "Goal Definitions" section
4. **Track Progress**: Check off goals as you complete them
5. **Customize Display**: Adjust colors, sizes, and position to match your chart setup
## 📐 INPUT GROUPS
### 🎯 Viprasol Goal Configuration
- Primary Goal Name
- Number of Goals (1-20)
### 📋 Goal Definitions
- All 20 goals with individual names and checkboxes
- Only enabled goals (based on count) will display
### 🌈 Premium Styling
- Goal Header Color
- Label Color
- Panel Background Color
- Achievement Color
- Header Font Size
- Milestone Font Size (Tiny/Small optimized for space)
### 📍 Elite Display
- Dashboard Position selector
## 💎 UNIQUE FEATURES
- **Space Efficient**: Tiny and Small font options for compact displays
- **Scalable**: Grow from 1 goal to 20 as your needs evolve
- **Non-Intrusive**: Overlay indicator that doesn't interfere with price action
- **Professional Design**: Clean, modern interface with cyber aesthetic
## 🎓 USE CASES
**Day Traders**: Track daily profit targets, trade count limits, max loss thresholds
**Swing Traders**: Monitor weekly/monthly goals, position management rules
**New Traders**: Learning milestones, strategy development checkpoints
**Experienced Traders**: Advanced risk management, portfolio objectives
## ⚙️ TECHNICAL DETAILS
- Version: Pine Script v5
- Type: Overlay Indicator
- Max Labels: 500
- Table-based display system
- No repainting
- Lightweight performance
## 🚀 GETTING STARTED
1. Add indicator to your chart
2. Set "Number of Goals" to your desired count (start small, scale up)
3. Customize goal names
4. Check boxes as you achieve goals
5. Watch your progress build!
## 📊 DISPLAY OPTIMIZATION
- Use "Tiny" or "Small" for maximum goals on small screens
- Use "Normal" or "Large" for standard monitors
- Use "Huge" for presentation or large displays
- Adjust position to avoid chart overlap
## 🎯 TRADING DISCIPLINE
This tool helps reinforce:
- Goal-oriented trading mindset
- Progress tracking accountability
- Milestone celebration
- Structured approach to trading development
---
**© viprasol**
*Designed for traders who take their goals seriously.*

APEX TREND: Macro & Hard Stop SystemAPEX TREND: Macro & Hard Stop System
The APEX TREND System is a composite trend-following strategy engineered to solve the "Whipsaw" problem inherent in standard breakout systems. It orchestrates four distinct technical theories—Macro Trend Filtering, Volatility Squeeze, Momentum, and Volatility Stop-Loss—into a single, hierarchical decision-making engine.
This script is not merely a collection of indicators; it is a rules-based trading system designed for Swing Traders (Day/Week timeframes) who aim to capture major trend extensions while strictly managing downside risk through a "Hard Stop" mechanism.
🧠 Underlying Concepts & Originality
Many trend indicators fail because they treat all price movements equally. The APEX TREND differentiates itself by applying an "Institutional Filter" logic derived from classic Dow Theory and Modern Volatility Analysis.
1. The Macro Hard Stop (The 200 EMA Logic)
Origin: Based on the institutional mandate that “Nothing good happens below the 200-day moving average.”
Function: Unlike standard super trends that flip constantly in sideways markets, this system integrates a 200-period Exponential Moving Average (EMA) as a non-negotiable "Hard Stop."
Synergy: This acts as the primary gatekeeper. Even if the volatility engine signals a "Buy," the system suppresses the signal if the price is below the Macro Baseline, effectively filtering out counter-trend traps.
2. The Volatility Engine (Squeeze Theory)
Origin: Derived from John Carter’s TTM Squeeze concept.
Function: The script identifies periods where Bollinger Bands (Standard Deviation) contract inside Keltner Channels (ATR). This indicates a period of potential energy build-up.
Synergy: The system only triggers an entry when this energy is released (Breakout) AND coincides with Linear Regression Momentum, ensuring the breakout is genuine.
3. Anti-Chop Filter (ADX Integration)
Origin: J. Welles Wilder’s Directional Movement Theory.
Function: A common failure point for trend systems is low-volatility chop. This script utilizes the Average Directional Index (ADX).
Synergy: If the ADX is below the threshold (Default: 20), the market is deemed "Choppy." The script visually represents this by painting candles GRAY, signaling a "No-Trade Zone" regardless of price action.
4. The "Run Trend" Stop Loss (Factor 4.0 ATR)
Origin: Adapted from the Turtle Trading rules regarding volatility-based stops.
Function: Standard Trailing Stops (usually Factor 3.0) are too tight for crypto or volatile equities on daily timeframes.
Optimization: This system employs a wider ATR Multiplier of 4.0. This allows the asset to fluctuate naturally within a trend without triggering a premature exit, maximizing the "Run Trend" potential.
🛠 How It Works (The Algorithm)
The script processes data in a specific order to generate a signal:
Check Macro Trend: Is Price > EMA 200? (If No, Longs are disabled).
Check Volatility: Is ADX > 20? (If No, all signals are disabled).
Check Volume: Is Current Volume > 1.2x Average Volume? (Confirmation of institutional participation).
Trigger: Has a Volatility Breakout occurred in the direction of the Macro Trend?
Execution: If ALL above are true -> Generate Signal.
🎯 Strategy Guide
1. Long Setup (Bullish)
Signal: Look for the Green "APEX LONG" Label.
Condition: The price must be ABOVE the White Line (EMA 200).
Execution: Enter at the close of the signal candle.
Stop Loss: Initial stop at the Green Trailing Line.
2. Short Setup (Bearish)
Signal: Look for the Red "APEX SHORT" Label.
Condition: The price must be BELOW the White Line (EMA 200).
Execution: Enter at the close of the signal candle.
Stop Loss: Initial stop at the Red Trailing Line.
3. Exit Rules (Crucial)
This system employs a Dual-Exit Mechanism:
Soft Exit (Profit Taking): Close the position if the price crosses the Trailing Stop Line (Green/Red line). This locks in profits during a trend reversal.
Hard Exit (Emergency): Close the position IMMEDIATELY if the price crosses the White EMA 200 Line against your trade. This prevents holding a position during a major market regime change.
⚙️ Settings
Momentum Engine: Adjust Bollinger Band/Keltner Channel lengths to tune breakout sensitivity.
Apex Filters: Toggle the EMA 200 or ADX filters on/off to adapt to different asset classes.
Risk Management: The ATR Multiplier (Default 4.0) controls the width of the trailing stop. Lower values = Tighter stops (Scalping); Higher values = Looser stops (Swing).
Disclaimer: This script is designed for trend-following on higher timeframes (4H, 1D, 1W). Please backtest on your specific asset before live trading.

Average True Range % infoATR% is a modified version of the classic Average True Range indicator that displays price volatility as a percentage of the instrument's value, rather than in absolute values. This allows you to easily compare the volatility of different assets (e.g., Bitcoin vs Tesla stock) regardless of their price.
Main Features
1. ATR% Chart
The red line shows the average volatility from the last N candles (default 14), expressed as a percentage. For example:
ATR% = 2.5% means that the average daily move is approximately 2.5% of the asset's value
Higher values = greater volatility (higher profit potential, but also greater risk)
Lower values = lower volatility (calmer market)
2. Volatility Trend Analysis
The indicator automatically detects whether volatility is rising, falling, or stable:
Up arrow (↑) - volatility is rising (price becomes more "nervous")
Down arrow (↓) - volatility is falling (market is calming down)
Horizontal arrow (⮆) - volatility is stable (within ±3% of the moving average)
3. Information Table
In the upper right corner of the chart you will see Current ATR% value and Trend arrow with color coding:
- Green = rising volatility
- Red = falling volatility
- Gray = stable volatility
Parameters to Configure
Indicator Length (default: 14) - How many candles back to include in calculations:
Lower values (5-10): more sensitive to sudden changes, reacts faster
Higher values (20-30): more smoothed, shows long-term volatility picture
Trend Length (default: 10) - Period to analyze whether volatility is rising/falling:
Lower values: faster trend change signals
Higher values: more reliable, but slower signals
Sample Interpretations
ATR% Volatility Asset Type/Situation
< 1% Very low Stable blue-chip stocks, calm market
1-3% Low-medium Typical stocks, normal conditions
3-5% Medium-high Volatile stocks, cryptocurrencies at rest
5-10% High Cryptocurrencies, penny stocks
> 10% Extremely high Market panic, crash, pump & dump

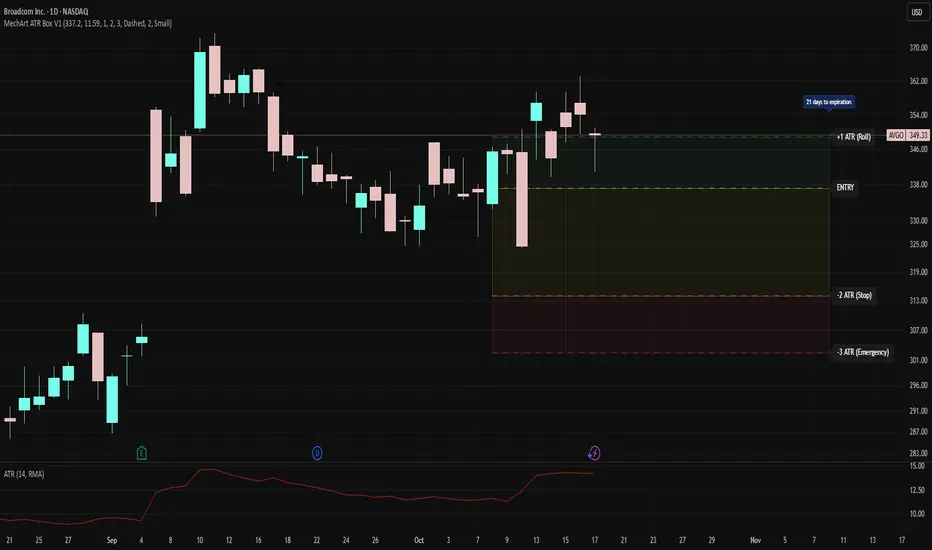
MechArt ATR Box V1MechArt ATR Box V1
Description:
The MechArt ATR Box V1 is a precision trade-planning and risk-management tool that visualizes your entire position framework using customizable ATR-based zones.
It automatically plots your key decision levels from a defined entry price and ATR value — helping you clearly see when to roll, hold, or exit a trade.
Features:
Configurable ATR multipliers for roll, stop, and emergency zones.
Automatically updates labels and price levels based on your custom ATR settings.
Distinct color-coded boxes for:
✅ +1 ATR (Roll Zone) – visualize profit or roll targets.
⚠️ –2 ATR (Stop Zone) – manage risk boundaries.
🚨 –3 ATR (Emergency Stop) – mark hard exit thresholds.
Adjustable ATRs, line style, width, color, and opacity for visual clarity.
Optional Days Until Expiration label for time-sensitive trades.
Ideal for:
Traders using mechanical, ATR driven systems (like OVTLYR Plan M), or anyone who wants a clear, rule-based visualization of risk vs. reward directly on the chart.
NQ Position Size CalculatorNQ Position Size Line Calculator is designed specifically for Nasdaq 100 futures (NQ) and micro futures (MNQ) traders who want to maintain disciplined risk management. This visual tool eliminates the guesswork from position sizing by displaying distance lines and contract calculations directly on your chart.
The indicator creates horizontal lines at 10-tick intervals from your stop loss level, showing you exactly how many contracts to trade at each distance to maintain your predetermined risk amount. Whether you're trading regular NQ contracts or micro MNQ contracts, this calculator ensures you never risk more than intended while providing instant visual feedback for optimal position sizing decisions.
How to Use the Indicator
Step 1: Configure Your Settings
Stop Loss Price: Enter your exact stop loss level (e.g., 20000.00)
Risk Amount ($): Set your maximum dollar risk per trade (e.g., $500)
Contract Type: Choose between:
NQ (Regular): $5 per tick - for larger accounts
MNQ (Micro): $0.50 per tick - for smaller accounts or conservative sizing
Display Options:
Max Lines: Number of distance lines to show (default: 30)
Show Labels: Toggle tick distance and contract count labels
Line Color: Customize the color of distance lines
Label Size: Choose tiny, small, or normal label sizes
Step 2: Read the Visual Display
Once configured, the indicator displays:
Stop Loss Line:
Thick yellow line marking your exact stop loss level
Yellow label showing the stop loss price
Distance Lines:
Dashed red lines at 10-tick intervals above and below your stop loss
Lines appear on both sides for long and short position planning
Labels (if enabled):
Green labels (right side): For long positions above your stop loss
Red labels (left side): For short positions below your stop loss
Format: "20T 5x" means 20 ticks distance, 5 contracts maximum
Step 3: Use the Information Tables
The indicator provides two helpful tables:
Position Size Table (top-right):
Shows common tick distances (10, 20, 40, 80, 160 ticks)
Displays risk per contract at each distance
Contract count for your specified risk amount
Total risk with rounded contract numbers
Settings Table (bottom-right):
Confirms your current risk amount
Shows selected contract type
Displays current settings for quick reference
Step 4: Apply to Your Trading
For Long Positions:
Look at the green labels on the right side of your chart
Find your desired entry level
Read the label to see: distance in ticks and maximum contracts
Example: "30T 8x" = 30 ticks from stop, buy 8 contracts maximum
For Short Positions:
Look at the red labels on the left side of your chart
Find your desired entry level
Read the label for tick distance and contract count
Example: "40T 6x" = 40 ticks from stop, sell 6 contracts maximum
Step 5: Trading Execution
Before Entering a Trade:
Identify your stop loss level and input it into the indicator
Choose your entry point by looking at the distance lines
Note the contract count from the corresponding label
Verify the risk amount matches your trading plan
Execute your trade with the calculated position size
Risk Management Features:
Contract rounding: All position sizes are rounded down (never up) to ensure you don't exceed your risk limit
Zero position filtering: Lines only show where position size is at least 1 contract
Dual-sided display: Plan both long and short opportunities simultaneously

Micro Futures Contract Calculator Micro Futures Contract Calculator
Synopsis: The Micro Futures Contract Calculator is a sleek, minimalist indicator that calculates the number of Micro E-mini Nasdaq-100 (MNQ) or S&P 500 (MES) contracts you can trade based on a fixed dollar risk and stop-loss (in ticks). Displayed in a compact, professional table in the top-right corner, it shows your risk, stop-loss, contract type, and calculated contracts, helping traders maintain consistent risk management.
How to Use:
Add the indicator to your chart (search “Micro Futures Contract Calculator”).
In settings, input:
Maximum Risk ($): Your total risk per trade (e.g., $100).
Stop-Loss (Ticks): Stop-loss size in ticks (e.g., 20 ticks = 5 points).
Contract Type: Select MNQ or MES.
Check the top-right table for:
Risk, stop-loss, contract type, and number of contracts (e.g., “10” for MNQ, “4” for MES).
Use the contract number to size trades, ensuring risk stays fixed.
Why Standardized Risk is Important:
Consistency: Fixed risk per trade (e.g., $100) prevents oversized losses, stabilizing long-term performance.
Discipline: Removes emotional guesswork, enforcing a systematic approach across MNQ/MES trades.
Capital Protection: Limits exposure, preserving your account during losing streaks and volatile markets.
Scalability: Aligns position sizing with your risk tolerance, enabling confident scaling as your account grows.
This indicator simplifies risk management, making it essential for disciplined futures trading.

Correlation MA – 15 Assets + Average (Optional)This indicator calculates the moving average of the correlation coefficient between your charted asset and up to 15 user-selected symbols. It helps identify uncorrelated or inversely correlated assets for diversification, pair trading, or hedging.
Features:
✅ Compare your current chart against up to 15 assets
✅ Toggle assets on/off individually
✅ Custom correlation and MA lengths
✅ Real-time average correlation line across enabled assets
✅ Horizontal lines at +1, 0, and -1 for easy visual reference
Ideal for:
Portfolio diversification analysis
Finding low-correlation stocks
Mean-reversion & pair trading setups
Crypto, equities, ETFs
To use: set the benchmark chart (e.g. TSLA), choose up to 15 assets, and adjust settings as needed. Look for assets with correlation near 0 or negative values for uncorrelated performance.

RiskCalc FX & GoldRiskCalc FX & Gold is a multi-market position sizing tool designed to help you manage risk quickly and accurately. With this script, simply enter your account capital, the percentage of risk you wish to take, and your stop in ticks. Depending on the selected market—Forex or XAUUSD—the script automatically adjusts its calculations:
Forex: Assumes 1 lot equals 100,000 units.
XAUUSD: Assumes 1 lot equals 100 ounces.
The script calculates your risk in dollars and, using a fixed value of 1 USD per tick per lot, determines the ideal position size in both lots and total contracts. Results are displayed in a clear, centralized table at the top of the chart for real-time decision-making.
Perfect for traders operating across multiple markets who need an automated and consistent approach to risk management.

MTF Signal XpertMTF Signal Xpert – Detailed Description
Overview:
MTF Signal Xpert is a proprietary, open‑source trading signal indicator that fuses multiple technical analysis methods into one cohesive strategy. Developed after rigorous backtesting and extensive research, this advanced tool is designed to deliver clear BUY and SELL signals by analyzing trend, momentum, and volatility across various timeframes. Its integrated approach not only enhances signal reliability but also incorporates dynamic risk management, helping traders protect their capital while navigating complex market conditions.
Detailed Explanation of How It Works:
Trend Detection via Moving Averages
Dual Moving Averages:
MTF Signal Xpert computes two moving averages—a fast MA and a slow MA—with the flexibility to choose from Simple (SMA), Exponential (EMA), or Hull (HMA) methods. This dual-MA system helps identify the prevailing market trend by contrasting short-term momentum with longer-term trends.
Crossover Logic:
A BUY signal is initiated when the fast MA crosses above the slow MA, coupled with the condition that the current price is above the lower Bollinger Band. This suggests that the market may be emerging from a lower price region. Conversely, a SELL signal is generated when the fast MA crosses below the slow MA and the price is below the upper Bollinger Band, indicating potential bearish pressure.
Recent Crossover Confirmation:
To ensure that signals reflect current market dynamics, the script tracks the number of bars since the moving average crossover event. Only crossovers that occur within a user-defined “candle confirmation” period are considered, which helps filter out outdated signals and improves overall signal accuracy.
Volatility and Price Extremes with Bollinger Bands
Calculation of Bands:
Bollinger Bands are calculated using a 20‑period simple moving average as the central basis, with the upper and lower bands derived from a standard deviation multiplier. This creates dynamic boundaries that adjust according to recent market volatility.
Signal Reinforcement:
For BUY signals, the condition that the price is above the lower Bollinger Band suggests an undervalued market condition, while for SELL signals, the price falling below the upper Bollinger Band reinforces the bearish bias. This volatility context adds depth to the moving average crossover signals.
Momentum Confirmation Using Multiple Oscillators
RSI (Relative Strength Index):
The RSI is computed over 14 periods to determine if the market is in an overbought or oversold state. Only readings within an optimal range (defined by user inputs) validate the signal, ensuring that entries are made during balanced conditions.
MACD (Moving Average Convergence Divergence):
The MACD line is compared with its signal line to assess momentum. A bullish scenario is confirmed when the MACD line is above the signal line, while a bearish scenario is indicated when it is below, thus adding another layer of confirmation.
Awesome Oscillator (AO):
The AO measures the difference between short-term and long-term simple moving averages of the median price. Positive AO values support BUY signals, while negative values back SELL signals, offering additional momentum insight.
ADX (Average Directional Index):
The ADX quantifies trend strength. MTF Signal Xpert only considers signals when the ADX value exceeds a specified threshold, ensuring that trades are taken in strongly trending markets.
Optional Stochastic Oscillator:
An optional stochastic oscillator filter can be enabled to further refine signals. It checks for overbought conditions (supporting SELL signals) or oversold conditions (supporting BUY signals), thus reducing ambiguity.
Multi-Timeframe Verification
Higher Timeframe Filter:
To align short-term signals with broader market trends, the script calculates an EMA on a higher timeframe as specified by the user. This multi-timeframe approach helps ensure that signals on the primary chart are consistent with the overall trend, thereby reducing false signals.
Dynamic Risk Management with ATR
ATR-Based Calculations:
The Average True Range (ATR) is used to measure current market volatility. This value is multiplied by a user-defined factor to dynamically determine stop loss (SL) and take profit (TP) levels, adapting to changing market conditions.
Visual SL/TP Markers:
The calculated SL and TP levels are plotted on the chart as distinct colored dots, enabling traders to quickly identify recommended exit points.
Optional Trailing Stop:
An optional trailing stop feature is available, which adjusts the stop loss as the trade moves favorably, helping to lock in profits while protecting against sudden reversals.
Risk/Reward Ratio Calculation:
MTF Signal Xpert computes a risk/reward ratio based on the dynamic SL and TP levels. This quantitative measure allows traders to assess whether the potential reward justifies the risk associated with a trade.
Condition Weighting and Signal Scoring
Binary Condition Checks:
Each technical condition—ranging from moving average crossovers, Bollinger Band positioning, and RSI range to MACD, AO, ADX, and volume filters—is assigned a binary score (1 if met, 0 if not).
Cumulative Scoring:
These individual scores are summed to generate cumulative bullish and bearish scores, quantifying the overall strength of the signal and providing traders with an objective measure of its viability.
Detailed Signal Explanation:
A comprehensive explanation string is generated, outlining which conditions contributed to the current BUY or SELL signal. This explanation is displayed on an on‑chart dashboard, offering transparency and clarity into the signal generation process.
On-Chart Visualizations and Debug Information
Chart Elements:
The indicator plots all key components—moving averages, Bollinger Bands, SL and TP markers—directly on the chart, providing a clear visual framework for understanding market conditions.
Combined Dashboard:
A dedicated dashboard displays key metrics such as RSI, ADX, and the bullish/bearish scores, alongside a detailed explanation of the current signal. This consolidated view allows traders to quickly grasp the underlying logic.
Debug Table (Optional):
For advanced users, an optional debug table is available. This table breaks down each individual condition, indicating which criteria were met or not met, thus aiding in further analysis and strategy refinement.
Mashup Justification and Originality
MTF Signal Xpert is more than just an aggregation of existing indicators—it is an original synthesis designed to address real-world trading complexities. Here’s how its components work together:
Integrated Trend, Volatility, and Momentum Analysis:
By combining moving averages, Bollinger Bands, and multiple oscillators (RSI, MACD, AO, ADX, and an optional stochastic), the indicator captures diverse market dynamics. Each component reinforces the others, reducing noise and filtering out false signals.
Multi-Timeframe Analysis:
The inclusion of a higher timeframe filter aligns short-term signals with longer-term trends, enhancing overall reliability and reducing the potential for contradictory signals.
Adaptive Risk Management:
Dynamic stop loss and take profit levels, determined using ATR, ensure that the risk management strategy adapts to current market conditions. The optional trailing stop further refines this approach, protecting profits as the market evolves.
Quantitative Signal Scoring:
The condition weighting system provides an objective measure of signal strength, giving traders clear insight into how each technical component contributes to the final decision.
How to Use MTF Signal Xpert:
Input Customization:
Adjust the moving average type and period settings, ATR multipliers, and oscillator thresholds to align with your trading style and the specific market conditions.
Enable or disable the optional stochastic oscillator and trailing stop based on your preference.
Interpreting the Signals:
When a BUY or SELL signal appears, refer to the on‑chart dashboard, which displays key metrics (e.g., RSI, ADX, bullish/bearish scores) along with a detailed breakdown of the conditions that triggered the signal.
Review the SL and TP markers on the chart to understand the associated risk/reward setup.
Risk Management:
Use the dynamically calculated stop loss and take profit levels as guidelines for setting your exit points.
Evaluate the provided risk/reward ratio to ensure that the potential reward justifies the risk before entering a trade.
Debugging and Verification:
Advanced users can enable the debug table to see a condition-by-condition breakdown of the signal generation process, helping refine the strategy and deepen understanding of market dynamics.
Disclaimer:
MTF Signal Xpert is intended for educational and analytical purposes only. Although it is based on robust technical analysis methods and has undergone extensive backtesting, past performance is not indicative of future results. Traders should employ proper risk management and adjust the settings to suit their financial circumstances and risk tolerance.
MTF Signal Xpert represents a comprehensive, original approach to trading signal generation. By blending trend detection, volatility assessment, momentum analysis, multi-timeframe alignment, and adaptive risk management into one integrated system, it provides traders with actionable signals and the transparency needed to understand the logic behind them.

Drawdown % (with SMA)This script, titled "Drawdown % (with SMA)" and designed for Pine Script version 5
offers a sophisticated tool for traders to monitor drawdown percentages, a crucial metric in assessing investment risks. The script calculates the drawdown as the percentage decrease from the all-time high value of the selected financial instrument.

Position and Risk Calculator (for Indices) [dR-Algo]Position and Risk Calculator : Your Ultimate Risk Management Tool for Indices
The difference between a novice and a seasoned trader often comes down to one essential element: risk management. While trading indices, the challenges are even more intense due to market volatility and leverage. The Position and Risk Calculator steps in here to bridge the gap, providing you with an efficient tool designed exclusively for indices trading.
Key Features:
User-Friendly Interface: Designed to integrate effortlessly with your TradingView chart, this tool's interface is intuitive and clutter-free.
Dynamic Price Level Adjustment: Move your Entry, Stop Loss, and Take Profit levels directly on the chart for an interactive experience.
Account Balance Input: Customize the tool to understand your unique financial situation by inputting your current account balance.
Trade Risk Customization: Define how much you're willing to risk per trade, and the tool will do the rest.
Automated Calculations: The indicator calculates the maximum monetary risk and translates it into the maximum lot size you can afford. It delivers a full-integer lot size to make your trading decisions easier.
Comprehensive Risk Evaluation: Beyond lot sizes, it provides you with the Cost-to-Reward Ratio (CRV) of your trade, the actual monetary risk according to the calculated lot size, and the potential profit.
How To Use:
Once you add the Position and Risk Calculator to your TradingView chart, a new interactive panel appears. Here’s how it works:
Set Price Levels: Using draggable lines on the chart, set your Entry Price, Stop Loss, and Take Profit levels.
Account Details: Go to settings and enter your Account Balance and your desired risk percentage per trade.
Automatic Calculations: As soon as the above details are set, the indicator goes to work. It first calculates your maximum risk in monetary terms and then translates that into the maximum lot size you can take for the trade.
Review and Trade: The indicator shows you all the vital statistics - CRV of the trade, the money at risk according to the calculated lot size, and the possible profit.
Why Choose This Tool?
Informed Decisions: Your trading decisions will be based on concrete numbers, removing guesswork.
Time-saving: No need for manual calculations or using separate tools; everything is in one place.
Focus on Trading: By automating the risk management aspect, this tool allows you to focus more on your trading strategy and market analysis.
Tailor-Made for Indices: Unlike many other tools that try to serve all markets, the Position and Risk Calculator is designed specifically for indices trading.
Remember, effective risk management is what separates successful traders from those who burn out. The Position and Risk Calculator not only helps you define your risk but also helps you understand it, empowering you to trade with confidence.
So why not give yourself the best chance of success? Add the Position and Risk Calculator to your TradingView setup and experience the difference it can make.

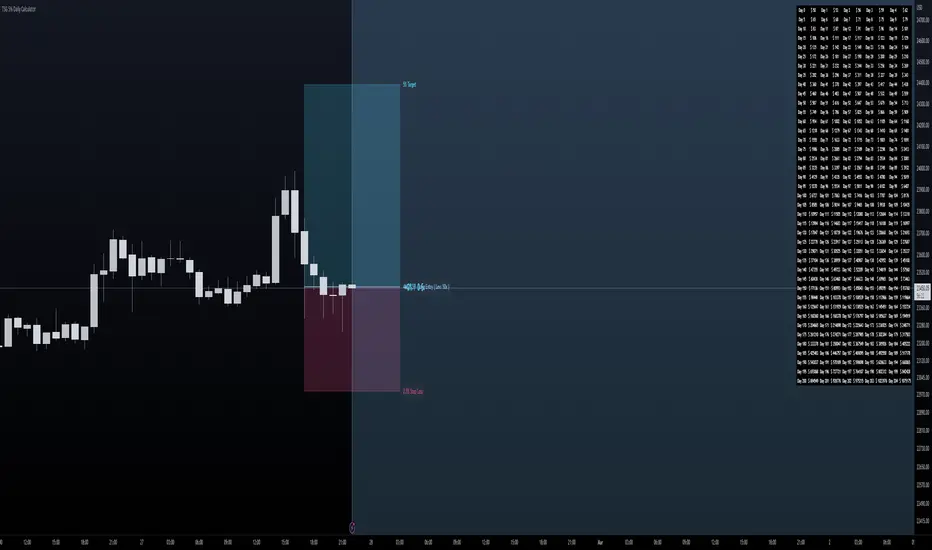
TSG 5% Daily CalculatorThis is a calculator I've created to help visualize Target and Risk Levels based on leverage use to trade crypto.
How to use it ?
Basic Use:
- Set the Direction of your trade - either Long or Short
- Set the Leverage you use in your trade - it is crutial to define the risk and target levels
- Set the Risk Amount you want to risk (in %) of your total balance ( Advised 2-3% )
- Set the Target Amount you want to profit at the target (the idea of this is 5% daily, so 5%).
- Set Entry Price if you have opened a position, and you will visually see your progress. Otherwise the levels will be adjusted to the Close of the candle.
Additions:
- Set your Initial Balance - to help you visualize on the Table your progress
- Set your Current Balance - for visualization purposes on ongoing trades and on the Table
- Entry Date - Advised to set it when you open a trade - you will be tracking the progress of your trade since the candle on which you opened it
- Show Table - to show the table of 5% daily and the target it is set on per day
- Table Size - Set table to be small or normal
- Together with the Table you have a big blue area behind that ends on the day you will become a Millionaire based on the Initial Balance, Current balance and Target % in your inputs
RISK MANAGEMENTHi dear Traders,
Here I would present you my 'Risk Management' tool which is based on your buy orders, trading fees and your desired benefit.
Easily, fulfill the price and volume of each entries. Add to this, you can prepare the info about your next proposed entries, just let them not check at first and by meeting the prices then active the check-box beside it.
Two line will be presented on your candle-plot, one of the indicate the place that without any lose/win you can exit and also the desired exit position by considering user defined benefit.
Use it for free but please do not forget to boost the script.
Best regards and happy trading.
Shakib

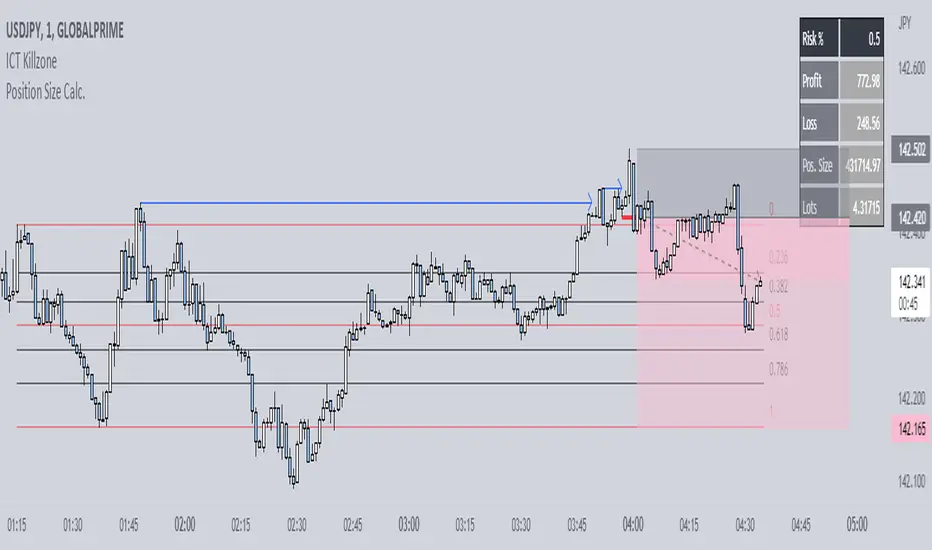
Position Size Calc. (Minimalist)This is a simplified position size calculator in the form of a table.
The reason I published this script is because all other position size calculator scripts try to provide way too much when it should be much simpler, position in strange areas of the chart and leave unwanted chart pollution.
This is a bare-bones functional table that takes your risk level, entry, stop and take profit as inputs, and calculates your loss, profit and required position size for your chosen risk level as a result.
Inspired by a table type position size calculator made by DojiEmoji design/color-wise. Functionally different however.
I hope you find this script useful and include it on your trading journey.