Dynamic Support And Resistance [CC]The Dynamic Support And Resistance Indicator was created by Mike Siroky (Stocks and Commodities pgs 14-18) and this is a handy indicator that will show you useful support and resistance levels no matter how the stock is doing right now. I have color coded the middle line to show buy and sell signals so buy when the line turns green and sell when it turns red.
Let me know if there are any other indicators you want me to publish!
Resistence
Pivot Points by stelmaxFor pivot levels, we use different definitions of the pivot point. In fact, there are three different methods to calculate the reference level using this method.
For these pivot points, we set the variable x, the value of which depends on whether the open is higher or lower than the close.
If the close is less than the open, x = H + 2L + C.
If the close is higher than the open, x = 2H + L + C.
When open equals close, x = H + L + 2C
This final value will be one of the most commonly used designs. This is because, as FX is a 24 hour market, the open is almost always equal to the close.
If you look at the daily chart throughout the week, the close and the open are really just names. This is in contrast to the stock market, where the open and close are very different things, separated by time and price.
Once we have the pivot point and the x-value, we use it to compute the pivot point of the base P.
P = x / 4
Support and resistance levels are also calculated from x (pivot points do not use more than one support and resistance level).
S₁ = x / 2 - H
S₂ = x / 2 - L
Thus, we have seen how to calculate different types of Pivot Points indicator. But how can we now use them in our trade?
First, we can use our anchor point to define the general direction. - If the existing market price is above the key PP level, it suggests a bullish trend.
- If the market is below the key PP level, it suggests a bearish trend.
Pivot levels are set according to the value of the previous trading day.
+ If the price is below the PP pivot level - priority is given to sell deals, if higher - to purchases
+ Confirmatory signals can be candlestick patterns and the Stochastic indicator
+ The SL level can be set either for a signal candle or for the nearest level
+ Target - movement to the nearest support / resistance level
Keep in mind that the Pivot Level Indicator is not a complete trading system!
Remember that there are no indicators in trading that do not make mistakes, Pivot Points, like any others, require confirmation of their signals. When building your own trading system, use several indicators.
Observe Money Management. Never risk more than 2 percent of your capital in one trade. This approach will protect you from ruin and will allow you to consistently make money on Forex using the Pivot Point.
Be clear about your trading strategy. If, according to the pivot point strategy, you need to open a deal - open, if you fix the result - fix it, and it doesn't matter if you are in the black or not. Only following the rules of Pivot Points "from and to" will allow you to earn.

Support Resistance ChannelsHello All,
For Long time I was planning to make Support/Resistance Channels script, finally I had time and here it is.
How this script works?
- it finds and keeps Pivot Points
- when it found a new Pivot Point it clears older S/R channels then;
- for each pivot point it searches all pivot points in its own channel with dynamic width
- while creating the S/R channel it calculates its strength
- then sorts all S/R channels by strength
- it shows the strongest S/R channels, before doing this it checks old location in the list and adjust them for better visibility
- if any S/R channel was broken on last move then it gives alert and put shape below/above the candle
- The colors of the S/R channels are adjusted automatically
You can set/change following settings:
- Pivot Period
- Source : High/Low or Close/Open can be used
- Maximum Channel Width %: this is the maximum channel width rate, this is calculated using Highest/Lowest levels in last 300 bars
- Number of S/R to show : this is the number of Strongest S/R to show
- Loopback Period: While calculating S/R levels it checks Pivot Points in LoopBack Period
- Show S/R on last # Bars: To see S/R levels only on last N bars
- Start Date: the script starts calculating Pivot Point from this date, the reason I put this option is for visuality. Explained below
- You can set colors/transparency
- and You can enable/disable shapes for broken S/R levels
Examples:
You can change colors as you wish:
here " Show S/R on last # Bars " set 100:
Sometimes visuality may corrupt because of old S/R levels, to solve it you need to set "Start Date" in the options to start the script in visual part (last 292 bars)
here in first screenshot it doesn't look good (shrink), then on second screenshot I set the "Start Date" it looks better, if you change time frame don't forget to set it again :)
Enjoy!

Market Makers (PVSRA) - DataCrypto Analytics
Script to track market makers.
Colors candles with higher trading volumes, demonstrating that a lot of smart money is happening.
Exponential moving averages of 100, 200 and 233 periods with VWMAP 25 and DRAGON.
To use this indicator, it is necessary to understand PVSRA strategy.
You can read our PVSRA study on our profile.
//////////////////////////////////////////////////////////////////////////////////////////////////////
// PORTUGUES
//////////////////////////////////////////////////////////////////////////////////////////////////////
Script para rastrear Formadores de Mercado.
Colore velas com volumes de negociação mais altos, demonstrando que muito dinheiro inteligente está acontecendo.
Médias móveis exponenciais de 100, 200 e 233 períodos com VWMAP 25 e DRAGON.
Para usar este indicador, é necessário entender a estratégia PVSRA.
Você pode ler sobre estudo PVSRA em nosso perfil.

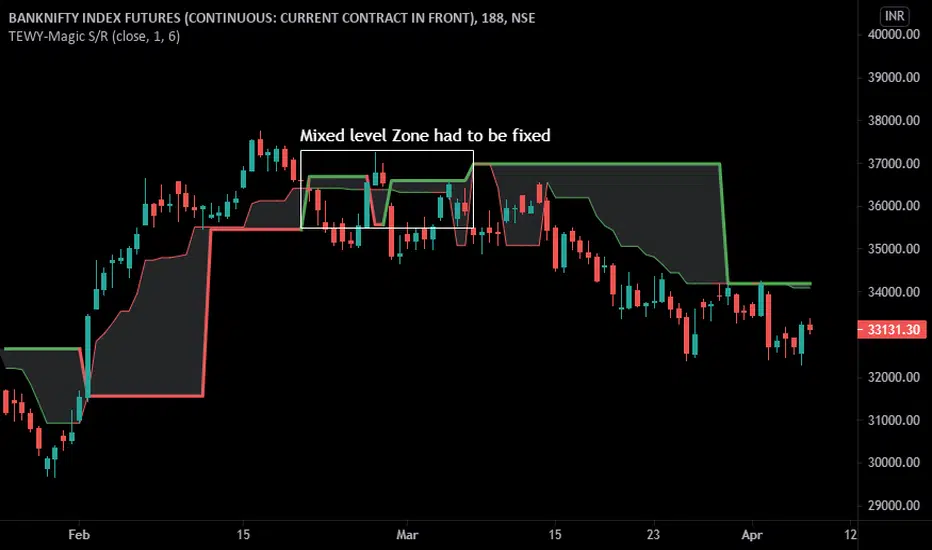
TEWY - Magic Support/Resistance1. This Indicator is used to identify the short-term and longer-term Support/Resistance levels.
2. Please try to keep base inputs as provided though it gives you the opportunity to change ticket price source and length as per your convenience.
3. With default settings:
a. The thick Red line is identified as Longer timeframe support
b. The thin Red line is identified as short timeframe support
c. The thick Green Line is identified as Longer timeframe resistance
d. The thick Green line is identified as short timeframe resistance
e. As per this indicator Gray area is where one can avoided taking a position or exit the existing positions if the candle's low or high Brocken which is closing in gray area as per the trade direction
Calculation Logic Used:
1. I calculated an average of 1-20 ROC average and checked price is above the it
2. I calculated 2 ATR based on 20 period to get the nearest support
3. If price is above both of above then plotted longer-term support based on ATR and shorter-term support based on ROC average.
One can use this indicator on any timeframe, though I created to see charts at a monthly and quarterly level to see for the investment opportunity.
Always respect RISKS and follow stoploss.
Let's understand how to take a position using this indicator
Thin Line = Shorter Time frame
Thick Line = Longer Time frame
Long position:-
1. Wait for the Candle to close above the Thin and Thick lines
2. Please make sure the close is firm above both of these lines.
3. Then enter long with stoploss below the Thick line.
4. Keep trailing stoploss with the thin line, so when the candle closes below thin line keep stoploss below low of that candle.
Short Position:-
1. Wait for the Candle to close below the Thin and Thick lines
2. Please make sure the close is firm below both of these lines.
3. Then enter short with stoploss above the Thick line.
4. Keep trailing stoploss with the thin line, so when the candle closes above the thin line, then keep stoploss above high of that candle.
I have given a sample illustrational image below, which should help you understand this indicator
Best of luck
Price Action - Support & Resistance by DGTSᴜᴘᴘᴏʀᴛ ᴀɴᴅ Rᴇꜱɪꜱᴛᴀɴᴄᴇ , is undoubtedly one of the key concepts of technical analysis
█ Sᴜᴘᴘᴏʀᴛ ᴀɴᴅ Rᴇꜱɪꜱᴛᴀɴᴄᴇ Dᴇꜰɪɴɪᴛɪᴏɴ
Support and Resistance terms are used by traders to refer to price levels on charts that tend to act as barriers, preventing the price of an financial instrument from getting pushed in a certain direction.
A support level is a price level where buyers are more aggressive than sellers. This means that the price is more likely to "bounce" off this level rather than break through it. However, once the price has breached this level it is likely to continue falling until meeting another support level.
A resistance level is the opposite of a support level. It is where the price tends to find resistance as it rises. Again, this means that the price is more likely to "bounce" off this level rather than break through it. However, once the price has breached this level it is likely to continue rising until meeting another resistance level.
A previous support level will sometimes become a resistance level when the price attempts to move back up, and conversely, a resistance level will become a support level as the price temporarily falls back.
█ Iᴅᴇɴᴛɪꜰʏɪɴɢ Sᴜᴘᴘᴏʀᴛ ᴀɴᴅ Rᴇꜱɪꜱᴛᴀɴᴄᴇ
Support and resistance can come in various forms, and the concept is more difficult to master than it first appears. Identification of key support and resistance levels is an essential ingredient to successful technical analysis.
If the price stalls and reverses in the same price area on minimum of two different occasions, then a horizontal line is drawn to show that the market is struggling to move past that area. Those areas are static barriers, one of the most popular forms of support/resistance and are highlighted with horizontal lines.
Repeated test , the more often a support/resistance level is "tested" over an extended period of time (touched and bounced off by price), the more significance is given to that specific level
High volume , the more buying and selling that has occurred at a particular price level, the stronger the support or resistance level is likely to be
Market psychology , plays a major role as traders and investors remember the past and react to changing conditions to anticipate future market movement.
Psychological levels , is a price level that significantly affects the price of an underlying financial instrument. Typically, near round numbers often serve as support and resistance
The following support and resistance related topics are beyond the scope of this study, so they will be mentioned roughly only as a reference for support and resistance concept
Trendlines , Support and resistance levels in trends are dynamic. Throughout an uptrend, levels of support tend to look like a trendline, usually clustering around higher lows. As the price rises, the price where buyers consider the stock to be “too cheap” also changes, which creates new support levels on the way up. The same is also true for resistance levels. In an uptrend, a stock is continuously breaking through perceived resistance levels and making new highs
Moving Averages , is a constantly changing line that smooths out past price data while also allowing the trader to identify support and resistance. In the example Notice how the price of the asset finds support at the moving average when the trend is up, and how it acts as resistance when the trend is down
The Fibonacci Retracement/Extension tool , is a favorite among many short-term traders because it clearly identifies levels of potential support and resistance
Pivot Point Calculations , is another common technical analysis technique, where pivot point is calculated based on the high, low, and closing prices of previous trading session/day and support & resistance levels are projected based on the pivot point, different calculation techniques are available, as presented in this example of an pivot point indicator : PVTvX by DGT
█ Tʀᴀᴅɪɴɢ Bᴀꜱᴇᴅ ᴏɴ Sᴜᴘᴘᴏʀᴛ ᴀɴᴅ Rᴇꜱɪꜱᴛᴀɴᴄᴇ
Once an area or "zone" of support or resistance has been identified, those price levels can serve as potential entry or exit points because, as a price reaches a point of support or resistance, it will do one of two things—bounce back away from the support or resistance level (trading ranges), or violate the price level and continue in its direction (trading breakouts) —until it hits the next support or resistance level
The basic trading method for using support and resistance is to buy near support in uptrends or the parts of ranges or chart patterns where prices are moving up and to sell/sell short near resistance in downtrends or the parts of ranges and chart patterns where prices are moving down. Buying near support or selling near resistance can pay off, but there is no assurance that the support or resistance will hold. Therefore, consider waiting for some confirmation that the market is still respecting that area
Trading breakouts, a breakout is a potential trading opportunity that occurs when an asset's price moves above a resistance level or moves below a support level on increasing volume. The first step in trading breakouts is to identify current price trend patterns along with support and resistance levels in order to plan possible entry and exit points. Once the asset trades beyond the price barrier, volatility tends to increase and prices usually trend in the breakout's direction. Breakouts are such an important trading strategy since these setups are the starting point for future volatility increases, large price swings and, in many circumstances, major price trends. When trading breakouts, it is important to consider the underlying asset's support and resistance levels. The more times an asset price has touched these areas, the more valid these levels are and the more important they become. At the same time, the longer these support and resistance levels have been in play, the better the outcome when the asset price finally breaks out. Asset prices will often move slightly further than we expect them to. This doesn't happen all the time, but when it does it is called a false breakout. Therefore it is important to consider waiting for some confirmation while trading breakouts. It’s also popular for traders to sell 50% of their positions at the resistance level, and hold the rest in anticipation of a breakout above resistance
█ Pʀɪᴄᴇ Aᴄᴛɪᴏɴ - Sᴜᴘᴘᴏʀᴛ & Rᴇꜱɪꜱᴛᴀɴᴄᴇ ʙʏ DGT Sᴛᴜᴅʏ
This experimental study attempts to identify the support and resistance levels. Assumes a simple logic to discover moments where the price is rising or falling consecutively for minimum 3 bars with the condition volume increases on each bar and the last bar’s volume should be bigger than the long term volume moving average. A line will be drawn at the end of the move (highest or lowest, depending on the move direction), the line will be drawn at minimum on the 3rd bar and if condition holds for other consecutive bars the line will switch to 4th, 5th etc bar.
Lines will not be deleted so the historical ones will remain and will emphasis the levels significance when they overlap in feature. Strong levels are more likely to hold and cause the price to move in the other direction, whereas the minor levels may only cause the price to pause and keep moving in the same direction. Determining future levels of support and resistance can drastically improve the returns of a short-term investing strategy
Bar colors will be painted based on the volume of the specific bar to its long term volume moving average. This will help identifying the support and resistance levels significance and emphasis the sings of breakouts
Finally, Volume spikes will be marked on top of the price chart. A high volume usually indicates more interest in the security and the presence of institutional traders. However, a rapidly rising price in an uptrend accompanied by a huge volume may be a sign of exhaustion. Traders usually look for breaks of support and resistance to enter positions. When security break critical levels without volume , you should consider the breakout suspect and prime for a reversal off the highs/lows. Volume spikes are often the result of news-driven events. Volume spike will often lead to sharp reversals since the moves are unsustainable due to the imbalance of supply and demand
A good example with many support and resistance concepts observed on a stock chart and detected by the study
Settings:
Length of volume moving average, where volume moving average is used to detect support and resistance levels, is used as reference to compare with threshold values for volume spikes and colors of the bars
Hint, to get more historical lines scrolling chart to left will enable visualization of them. Please note they may appear to much all 500 line limit is used 😉
Special thanks to @HEMANT Telegram user, for his observations and suggestions
Disclaimer:
Trading success is all about following your trading strategy and the indicators should fit within your trading strategy, and not to be traded upon solely
The script is for informational and educational purposes only. Use of the script does not constitute professional and/or financial advice. You alone have the sole responsibility of evaluating the script output and risks associated with the use of the script. In exchange for using the script, you agree not to hold dgtrd TradingView user liable for any possible claim for damages arising from any decision you make based on use of the script

{INDYAN} Perfect Buy SellA simple indicator based on candle stick strength, with cpr,vwap and support resistance...
search for buy sell signal on 15 min timeframe and wait for second candle to close above/below of signal candle. Cpr pivots would act as support and resistance. Entry should only be based on 15 mins or higher timeframe. 3 and 5 mins timeframe for profit booking.
No supertrend or atr used in this indicator.
This show how a single candle can give u good trade...
Love Indyan
* tested on Banknifty and nifty , kindly share ur experiences on other scrips. Thanks
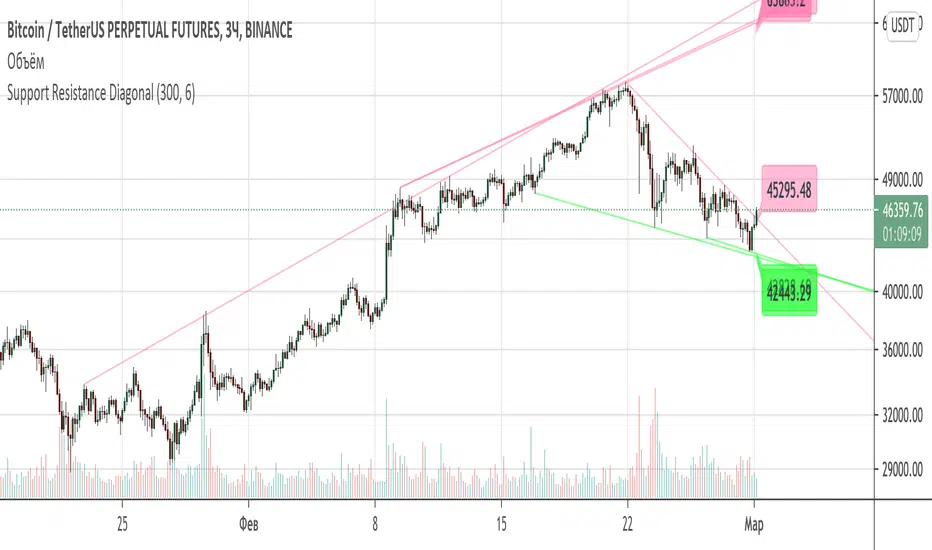
Support Resistance DiagonalClassic diagonal support and resistance based on pivot points. As a result, they form triangles, wedges, channels and other patterns. Realtime update up to 1 second chart.
Range support and resistanceWelcome all
==========
This script specially is for Kunal Saraogi Senani Traders and beginners.
.
With this script you can find support and resistance for input range on any time-frame chart.
You need not draw line by own. You just input your desired range and this script will do your work automatically.
You can adjust range according to your choice.
Also have an option to select range source which help you to find support and resistance on the basis of close price or high/low of input range. Default range source is close price.
.
Latest support and resistance value labels also display on the chart.
.
To use this script, add to favorite and apply on chart.
.
Feel free to comment your suggestions.
.
Thanks all
Auto Pivot Level Drawer [TipsChain]a pivot point is a price level that is used by traders as a possible indicator of market movement. A pivot point is calculated as an average of significant prices (high, low, close) from the performance of a market in the prior trading period. If the market in the following period trades above the pivot point it is usually evaluated as a bullish sentiment, whereas trading below the pivot point is seen as bearish .
Calculation
Several methods exist for calculating the pivot point (P) of a market. Most commonly, it is the arithmetic average of the high (H), low (L), and closing (C) prices of the market in the prior trading period:
P = (H + L + C) / 3.
Sometimes, the average also includes the previous period's or the current period's opening price (O):
P = (O + H + L + C) / 4.
In other cases, traders like to emphasize the closing price, P = (H + L + C + C) / 4, or the current periods opening price, P = (H + L + O + O) / 4.
Support and resistance levels
The first and most significant level of support (S1) and resistance (R1) is obtained by recognition of the upper and the lower halves of the prior trading range, defined by the trading above the pivot point (H − P), and below it (P − L). The first resistance on the up-side of the market is given by the lower width of prior trading added to the pivot point price and the first support on the down-side is the width of the upper part of the prior trading range below the pivot point .
R1 = P + (P − L) = 2×P − L
S1 = P − (H − P) = 2×P − H
Thus, these levels may simply be calculated by subtracting the previous low (L) and high (H) price, respectively, from twice the pivot point value:
The second set of resistance (R2) and support (S2) levels are above and below, respectively, the first set. They are simply determined from the full width of the prior trading range (H − L), added to and subtracted from the pivot point , respectively:
R2 = P + (H − L)
S2 = P − (H − L)
Commonly a third set is also calculated, again representing another higher resistance level (R3) and a yet lower support level (S3). The method of the second set is continued by doubling the range added and subtracted from the pivot point:
R3 = H + 2×(P − L) = R1 + (H − L)
S3 = L − 2×(H − P) = S1 − (H − L)
This concept is sometimes, albeit rarely, extended to a fourth set in which the tripled value of the trading range is used in the calculation.
Qualitatively, the second and higher support and resistance levels are always located symmetrically around the pivot point , whereas this is not the case for the first levels, unless the pivot point happens to divide the prior trading range exactly in half.

Probability Bands [Anan]Hello Friends,,,
===================================
This indicator is based on Bayes' Theorem and is fully based on probabilities.
===================================
Formula For Bayes' Theorem:
P(Bull|Bear) = P(Bear∣Bull) * P(Bull) / P(Bear)
where:
Bull and Bear are events and P is probability
P(Bull|Bear) is the posterior probability, the probability of Bull after taking into account Bear
P(Bear∣Bull) is the conditional probability or likelihood, the degree of belief in Bear given that proposition of Bull belief (Bull true)
P(Bull) is the prior probability, the probability of Bull belief
P(Bear) is the prior probability, the probability of Bear belief
===================================
The indicator output one trend lines and (Bull/Bear) Signal :
Bull/Bear Probability Trend :
when the price is above mid line ==> Up Trend
when the price is below mid line ==> Down Trend
And by using ATR deviation multipliers, we can get (Bullish/Bearish) zones
===================================
Disclaimer:
This script is for informational and educational purposes only.
Use of the script does not constitutes professional and/or financial advice.
You alone the sole responsibility of evaluating the script output and risks associated with the use of the script.
===================================
FlipSignalsFlipSignals is a TradingView indicator designed to help you make smarter, more efficient trading decisions by simplifying your trading. Specific symbols show up directly on price action to help you easily visualize trade setups and interpret market movement. The framework behind FlipSignals is systematic yet simple: First, establish a dominant trend with the Trend Level. Then, identify optimal entry points. With a complete understanding of FlipSignals you'll be able to confidently interpret and navigate any market with strong conviction.
Trend Level
The Trend Level is the step line that runs through price action and establishes a dominant directional trend, either green or red. When the Trend Level is green, buyers are in control and price action is bullish - suggesting buying pressure and higher prices. Conversely, when the Trend Level is red, sellers are in control and price action is bearish - suggesting selling pressure and lower prices.
During an uptrend, price action will trade above the Trend Level and use the Trend Level as support. Conversely in a downtrend, price action will trade below the Trend Level, which will act as resistance. When the Trend Level flat lines and flips from one color to another, this signals that price action is resting and could potentially indicate that the trend is shifting or consolidating for a continuation move.
The Trend Level can also be used as a trail stop level when you are in a position. For example, if you are long when the Trend Level is green and stair stepping higher, you can incrementally place your stop right below the Trend Level as price action increases in order to protect your unrealized profit.
Momentum Shifts - ShiftUp / ShiftDown
Small blue and orange triangles indicate short term momentum shifts in price action. When momentum shifts upwards, a small blue up triangle will appear below the candle and when momentum shifts downwards, a small orange, down triangle will appear above the candle.
ShiftUp and ShiftDown signals generally confirm short term tops/bottoms although consecutive momentum shifts within a short period of candles can indicate consolidation and stalled price action.
Buy/Sell XOB/XOS Levels
FlipSignals’ algorithm calculates a sentiment score that measures the net buying and selling in any given market. This score oscillates above and below zero identifying extended buying and selling pressure. A positive score indicates that buyers are in control whereas a negative score signals that sellers are in control.
FlipSignals generates buy and sell level Dot Clusters and Extreme Overbought/Oversold (XOB/XOS) symbols based on the sentiment score to easily visualize overextended buying or selling directly on price action candles.
Dot Clusters - Buy/Sell Levels
FlipSignals allows users to set 3 buy and 3 sell levels to determine when dot clusters will appear. Dot clusters will appear when sentiment score breaches each level.
Buy level dot clusters will appear below candles indicated by yellow and green circles, while sell level dot clusters will appear as yellow and red circles above candles.
Generally, dot clusters indicate that price action is extended one way or the other. Notice that buy dot clusters appear below the Trend Level while sell dot clusters appear above the Trend Level for the majority of the time.
Extreme Overbought/Oversold Signal
Extreme Overbought (XOB) signals will appear as neon green X's above the candle indicating price action has entered extreme overbought levels. Typically, XOB signals serve as a warning that prices could continue higher.
Extreme Oversold (XOS) signals will appear as red X's below the candle indicating price action has entered extreme oversold levels. Typically, XOS signals serve as a warning that prices could continue lower.
Generally, sentiment scores of +/-4 are considered extreme readings although this can vary by asset. User defined inputs of buy/sell and XOB/XOS levels determine when signals will appear.
Additional Support/Resistance Indicators Include:
VWAP
3 EMAs
3 SMAs
Weekly Pivot Points
Monthly Pivot Points
Quarterly Pivot Points
Previous Day OHLC
Please use the link below to our website to obtain access to this indicator.

Bjorgum TSI-This script utilizes simple color changes of the TSI output signals to aid in interpretation of the classic TSI indicator.
-Crosses of the TSI value line and signal line are a bullish or bearish indication. TSI value line is colored green or yellow to help identify that the TSI value line is either dropping or rising, while over or under the signal line.
-This can help anticipate a cross, or significant points in the trend. TSI signal line changes color when rising or falling which can help to identify larger prevailing trends.
-Generally, a rising signal line can be an overall bullish move, while falling more bearish regardless of crosses.
*Resolution function enables multiple overlay for "Multi-timeframe analysis"*
Pivots High Low (HH/HL/LH/LL)/Trend [Anan] Hello Friends,,
This is pivot points high low with pivot trend to define the trend direction.
Pivot trend is the pivot points average.
Options:
- Pivot Point Period
- Show/hide Pivot Points Labels
- Show/hide Bull/Bear Labels ( depends on pivot trend)
- Show/hide Pivot Center Line (Bull>Center, Bear

Auto Linear Regression ChannelA Linear Regression Channel gives more objective potential buy and sell signals based on price volatility. It consists of three parts:
Linear Regression Line: A Linear Regression Line is a straight line that best fits the prices between a starting price point and an ending price point. A "best fit" means that a line is constructed where there is the least amount of space between the price points and the actual Linear Regression Line. The Linear Regression Line is mainly used to determine trend direction.
Traders usually view the Linear Regression Line as the fair value price for the stocks. When prices deviate above or below, traders may expect prices to go back towards the Linear Regression Line. As a consequence, when prices are below the Linear Regression Line, this could be viewed by some traders as a good time to buy, and when prices are above the Linear Regression Line, a trader might sell. Of course other technical indicators would be used to confirm these inexact buy and sell signals.
Upper Channel Line: A line that runs parallel to the Linear Regression Line and is usually one to two standard deviations above the Linear Regression Line.
Lower Channel Line: This line runs parallel to the Linear Regression Line and is usually one to two standard deviations below the Linear Regression Line.
The upper and lower channel lines contain between themselves either 68% of all prices (if 1 standard deviation is used) or 95% of all prices (if 2 standard deviations are used). When prices break outside of the channels, either: Buy or sell opportunities are present. Or the prior trend could be ending.
Linear Regression Channel Possible Buy Signal
When price falls below the lower channel line, and a trader expects a continuation of the trend, then a trader might consider it as a buy signal.
Linear Regression Channel Possible Sell Signal
An opportunity for selling might occur when prices break above the upper channel line, but a continuation of the trend is expected by the trader. Other confirmation signs like prices closing back inside the linear regression channel might be used to initiate potential buy or sell orders. Also, other technical indicators might be used to confirm.
Trend Reversals
When price closes outside of the Linear Regression Channel for long periods of time, this is often interpreted as an early signal that the past price trend may be breaking and a significant reversal might be near. Linear Regression Channels are quite useful technical analysis charting tools. In addition to identifying trends and trend direction, the use of standard deviation gives traders ideas as to when prices are becoming overbought or oversold relative to the long term trend.
Default Parameters:
Period: (100) The number of bars to use in the calculation.
This Linear Regression Channel Has 1st, 2nd, and 3rd Deviation lines also the MId Deviation Lines are added for 1.5 and 2.5 area.
Opening LevelsOpening Levels is an indicator to draw lines on the opening prices of the current day, week, and month.
Inputs:
1. Line Width :- Opening Levels Line width, from 1 to 10
2. Right Offset :- Right offset from current bar, from 0 to 50
3. Line Style :- Select line styles from
4. Show Label :- Show or hide price labels
5. Day Level Color :- Current day opening level color
6. Week Level Color :- Current week opening level color
7. Month Level Color :- Current month opening level color
8. Day Label Text Color :- Current day label text color
9. Week Label Text Color :- Current Week label text color
10. Month Label Text Color :- Current month label text color
Happy trading.
Volatility Support & Resistance [LM]Hello guys,
I would like to introduce you volatility support and resistance horizontals. It draws line horizontal on high and low vhighly volatile candles. You can select lines on this timeframe and/or another one. It's done in the same spirit like my other indicators for horizontals
The colors are dynamic depending whether price is below or above the line:
for the current timeframe green is used for support and blue for resistance
for the other timeframe by default 4h orange is used for support and violet for resistance
There are various sections in setting:
general settings - here you can select ATR length, multiplier and show labels
show and hide section of the current timeframe
other timeframe
show and hide other timeframe horizontals
Any suggestions are welcome

Raygun [MS]Support and resistance indicator for any asset and any time frame that makes it simple to visualize S/R flips as well as bullish and bearish bounces and rejections off these levels.
Simple to use, just add to your chart and choose how often you want the levels to update based on the Size setting.
Lower numbers will update more quickly and show more recent levels.
Bigger numbers will update more slowly and show older levels.
Alerts are available for when price nears or bounces off a level of support or resistance, as visualized on the chart.
Settings
• Set the indicator's size
Use the link below or PM us to obtain access to this indicator.

AMA 2Hi
Here is the 2ed edition of the AMA indicator.
what you would know to know?
AMA indicator based on support and resistance in a different way.
Basically, you have the X line (black color) and when you see candles is over it, then you can go long, and when it's below it you may go short or just close your deal and wait for a better chance to re-enter again.
You see the confirmation signs which helps you to get more signals for the deal.
You find a colored background that is based on the volume that could help you to know where if the traders are buying or selling.
AMA is configured to work with Alerts.
We've added EMA and our special moving average to help you in your decision.
Finally, the indicator is tested and works fine with Binance on 1H, 4H, D and you could change the length to have better results for the daily time frame.

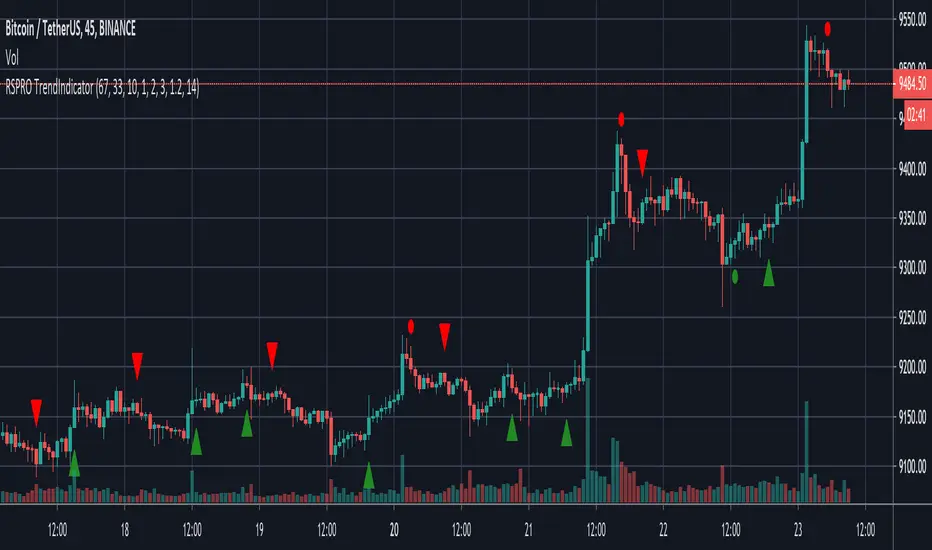
RSPRO TrendIndicatorBased on resistance/support and bollinger band fluctuations this indicator also has filter with x bars after RSI overbought/oversell zones from settings.
Indicator has alerts for LONG(BUY)/SHORT(SELL) signals with green/red squares/triangles. You can setup alerts to use different types of entries.
There are two types of entries and signals: early (usually before trend changes) and main (when trend started to reverse)
Fits for BTC and any altcoins. And any assets. Good for both scalping and position trading (depends on timeframe that you use)
Best use it with big timeframes: 45 and 90min, 2 and 4 hours for position trading.
For scalping 5-30min timeframes are good too.
In Script settings you can specify:
1) RSI period, 14 by default.
2) Show early entries (squares), enabled by defaults.
3) Show main entries (triangles), enabled by defaults.
4) Enable/Disable filter to show main entries only after RSI overbought/oversell regions
Disabled by defaults and RSI is 67 for upper zone and 33 for lower zone.
You can also specify how many bars back before current bar this filter must do. It's 10 by default, you can vary it up to 90.
You can also use only early entries (squares)
Or only main entries (triangles)
Or both (by defaults and i recommend)
This is invite only script. PM me if you want to test it.
Support Resistance HH HL LH LLThis is a very powerful indicator and I'm really happy to show you how it works.
It shows Higher Highs(HH),Higher Lows(HL),Lower Highs(LH),and Lower Lows (LL), the supports and the resistance.
Lets start with the HH, HL, LH and LL.
This points helps a lot who can not identify them yet. They help to identify up trends having HH and HL in sequence, and when the trend is not strong anymore creating LH after.
For down trends, the indicator show LH and LL in sequence and when the trend is not strong anymore showing HL after.
As well this indicator helps to draw trend lines when it shows. For example the LL drawing the line from the low of the first candle (LL) to the low of the second candle showing HL for an uptrend.
It can be done for the down trend, drawing the trend line from the high of the candle showing the HH, to the high of the candle showing LH.
Another use of the HH, HL, LH, LL can be the stop loss this will be explained later in the support and resistance part.
Now let me explain the support and resistance.
The support and resistance can be used as entry when the price break true using the previous HH, HL, LH and LL as stop loss.
For a safer entry I advise to use the retest of the line.
In the settings of the indicator there is the possibility to make the indicators invisible, to change the color, and as well to change how many candles before and after the main candle showing the HH, HL, LH and LL, but I advise to leave it as it is.
Thank you and lets take some pips!

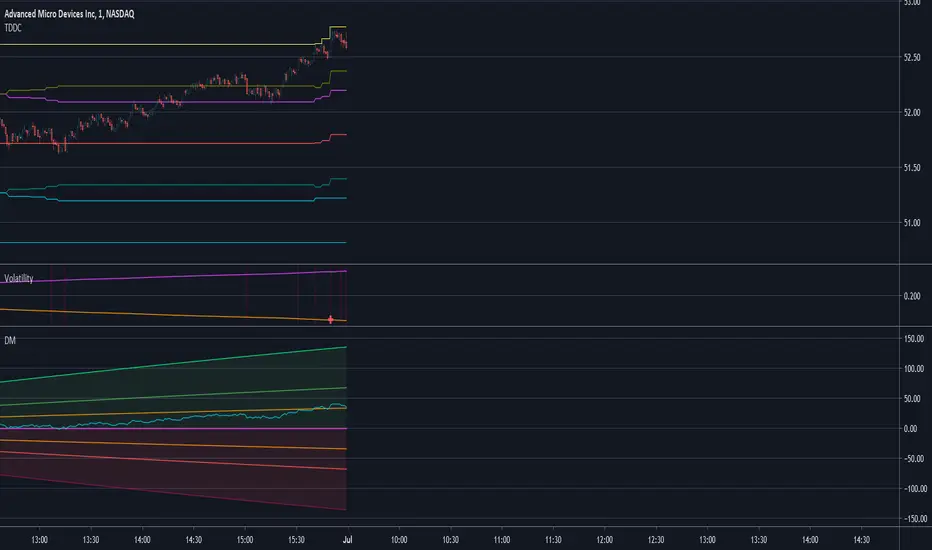
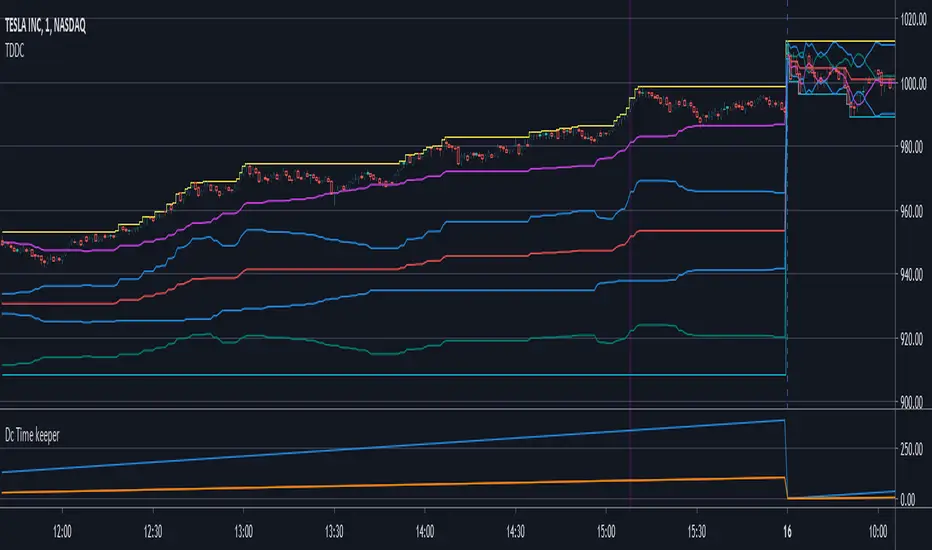
Time Dilated Donchian ChannelBefore anything, take notes of the script limitations :
1) The script has the setting : "Max_bars_back" set to 390. This is required to use dynamic length and an "internal clock"
*390 is the normal number of bars in a typical stock trading day.
2) The script requires volume data to work correctly
* I use a way to represent volatility that requires ( volume + price movement + time, no sma , no stdev)
Why ? Because:
HIGH-LOW = Fail to get gap information, fail to get volume information
TR /ATR = Fail to get volume information
STDEV = Not very good with dynamic length as it use SMA and fails when length <2
SMA = SMA give very strange results when using non-integer numbers.
So a good idea is to use the 1 minute timeframe for this indicator.
Conclusion: this script is basically limited to stock trading.
If I could set Max_bars_back to 23 400 this would even work better with a 1 second time frame as more data would be entered in the system.
The idea behind the script is that volatility exists in two different formats depending on how you observe the situation.
Remember your physics class? Light can be a wave or a particle depending of the situation.
Volatility seems to share a strange similar property.
If volatility share similarities with light, then time dilation effect could be applied to stock movement.
Time Dilation formula
Time observed = (Last time - First time) / sqrt(1-(pow(v,2)/pow(c,2))
I've tried a lot of ways to use this formula as is.
Problem is : C.
C is the speed of light and I haven't found the equivalent stock market constant yet.
So I had to tweak the time dilation formula to make it compatible with my volatility. The result is not perfect but it's interesting.
Sometime my volatility gets over that "unknown C stock market constant" which cause "Time travel"
In order to keep the law of physics like they actually work, when a new time is set, I had to "Protect its value".
protected_new_time = highest_(observed time , normal time)
No time travel is allowed. *yet.
I've "speculated" more signal lines by using mathematical geometry.
(Reflective & Inverted)
I've also created another Script that show you the effect volatility over time named : DC Time Keeper.
The script has no other use in itself. It's really only a way to represent how time gets slowed by speed.
For more information about time dilation:
en.wikipedia.org
Volatility DMBefore anything, take notes of the script limitations :
1) The script has the setting : "Max_bars_back" set to 390. This is required to use dynamic length and an "internal clock"
*390 is the normal number of bars in a typical stock trading day.
2) The script requires volume data to work correctly
* I use a way to represent volatility that requires ( volume + price movement + time, no sma , no stdev)
Why ? Because:
HIGH-LOW = Fail to get gap information, fail to get volume information
TR/ATR = Fail to get volume information
STDEV = Not very good with dynamic length as it use SMA and fails when length <2
Conclusion: this script is basically limited to stock trading.
If I could set Max_bars_back to 23 400 this would even work better with a 1 second time frame as more data would be entered in the system.
The idea behind the script is that volatility exists in two different formats depending on how you observe the situation.
Remember your physics class? Light can be a wave or a particle depending of the situation.
Volatility seems to share a strange similar property.
Format 1) Instant volatility . (Ex. High - Low, TR )
Format 2) Systemic volatility (Ex. Dynamic ATR with variable length)
I then speculate 3 lines. (on both directions, + or -)
What if all transaction were 50% directional according to the instant volatility
What if all transaction were 100% directional according to the instant volatility
What if all transaction were 200% directional according to the instant volatility
sum(0,5*instant volatility , dynamic time)
sum(instant volatility , dynamic time)
sum(2*instant volatility , dynamic time)
This give you potential signals lines and support/resistance .
I then calculate the real price movement
sum(price movement, dynamic time)
Then you need to compare the real price movement VS if all transaction were 100% directional following the system volatility
dif=(sum price movement/sum volatility )*dynamic time
Voila.
If the movement is directional then it follows the system volatility .
If the movement is not directional then it goes back toward the Zero.
Inspirational image :
en.wikipedia.org