Custom Message and Notes Rotator [NAMI-TRADING]Custom Message and Notes Rotator
Display up to five rotating text messages directly on your chart—ideal for notes, reminders or context cues without popping up alerts.
Key Features
Five Custom Messages & Toggles
Define Message 1–5 and switch each on/off independently.
Custom Text & Background Colors
Pick any text color and background shade to suit your chart theme.
Five Text-Size Presets
Choose from tiny, small, normal, large or huge for perfect readability.
Adjustable Rotation Interval
Set how often (in seconds) the display cycles through your messages.
Nine Position Options
Place your message table anywhere: top_left → bottom_right.
Inputs
Message 1–5 (string)
Show Message 1–5 (bool)
Text Color (color)
Background Color (color)
Text Size (tiny | small | normal | large | huge)
Interval (seconds) (int ≥1)
Table Position (top_left, top_center, …, bottom_right)
No guarantees or investment advice. This is a simple visual‐utility overlay. Feel free to experiment with colors, sizes and timing to suit your workflow!
Reminder

Daily PlayDaily Play Indicator
The Daily Play Indicator is a clean and versatile tool designed to help traders organize and execute their daily trading plan directly on their charts. This indicator simplifies your workflow by visually displaying key inputs like market trend, directional bias, and key levels, making it easier to focus on your trading strategy.
Features
Dropdown Selection for Trend and Bias:
• Set the overall market trend (Bullish, Bearish, or Neutral) and your directional bias (Long, Short, or Neutral) using intuitive dropdown menus. No more manual typing or guesswork!
Key Levels:
Quickly input and display the Previous Day High and Previous Day Low. These levels are essential for many trading strategies, such as breakouts.
Real-Time News Notes:
Add a quick note about impactful news or market events (e.g., “Fed meeting today” or “Earnings season”) to keep contextual awareness while trading.
Simple On-Chart Display:
The indicator creates a “table-like” structure on the chart, aligning your inputs in an easy-to-read format. The data is positioned dynamically so it doesn’t obstruct the price action.
Customisable Visual Style:
Simple labels with clear text to ensure that your chart remains neat and tidy.
----
Use Case
The Daily Play Indicator is ideal for:
• Day traders and scalpers who rely on precise planning and real-time execution.
• Swing traders looking to mark critical levels and develop a trade plan before the session begins.
• Anyone who needs a structured way to stay focused and disciplined during volatile market conditions.
By integrating this tool into your workflow, you can easily align your daily preparation with live market action.
----
How to Use
Open the indicator settings to configure your inputs:
• Trend: Use the dropdown to choose between Bullish, Bearish, or Neutral.
• Bias: Select Long, Short, or Neutral to align your personal bias with the market.
• Previous Day Levels: Enter the High and Low of the previous trading session for key reference points.
• News: Add a short description of any relevant market-moving events.

v01 remindersTrading requires focus, discipline, and sometimes a reminder to stay on track.
Many of us know how to take trades and make money - but sometimes struggle to hold on to the gains. By knowing not only when to trade, but also when NOT to trade, we can begin to build better habits.
I built this indicator for my own needs, but I hope this indicator can help someone save money by reminding them when to step away, size down or stay on track.
Inspired by trading psychologists like Mark Douglas, David Paul and others, I decided to make an indicator that deals with the mental aspect of trading.
Dr. David Paul said that you can be 10-15 trades away from the trader you want to be. All it takes is 10-15 trades of doing only the right thing (erasing bad habits). After that time the resistance to execute the trades properly will improve even more.
Good trading should be boring and repetitive. If the trading is exciting and varied it is likely unprofitable (more akin to impulsive gambling).
Perhaps you know how to trade, yet keep trading impulsively sometimes, getting "the itch" to trade or gambling with your gains? Set some reminders and see if you can build better habits. Over time it could make a difference.
You can enable up to 10 different reminders with each instance of the indicator. You can select days of the week and time of day. The visibility is fully customizable to suit any colour theme you may want. They dont actually alert - its a silent visual reminder, which is less intrusive and stays on screen for as long as you want.
Remind yourself when CPI releases or bond auctions are about to hit.
Don't get caught off guard by FED speakers or FOMC announcements.
Manage your emotions by writing a motivational reminder.
Build better habits and stay disciplined with reminders not to gamble.
Remind yourself to stay away from the markets when there is low liquidity, and trade during your best hours.
Wait for the market to establish balance and let the text show when to either wait or when to start trading.
Some basic inspiration:
"FOMC - No trading!"
"CPI Data - Expect Volatility"
"Markets closed tomorrow - Plan ahead"
"Take it slow, it's a marathon, not a sprint." - Dakota
"Wait for cheap risk" - HOAG
"Don't diddle in the middle!" - Brian Watts
You can of course write anything you want. Maybe you would like to remind yourself of a specific algo in crude oil or gold, or have other motivational reminders that work for you. If you have any good suggestions put them in the comments for others to use.
You can also use the script to watermark or put a web link on your charts. The indicator is empty by default - the image is just an example of the different types of labels it can show.
Customize the reminders for specific days, times, and events. Position them anywhere on your chart to suit your workflow. Whether you're a day trader or a long-term investor, theres always things to improve. This lets you keep those reminders right on your charts. You can go into the object tree settings and drag the indicator to the top if you want it to hide the candlesticks, and size up the text to really make it cover the chart for when to really stay away, as in the "FOMC" example in the image. The sample image shows a couple of different labels - but the script has no texts by default. It is up to you what to write and what colours to use. Please share it with others that may benefit.
You can add the script more than once if you need more than 10 alerts. You can also use it on multiple panels in TradingView, and it will remember the reminders for each panel. You can use spaces when positioning text in the top and bottom left corners of the screen, where there is sometimes a logo or ticker name obscuring the text. If two reminders display in the same location it will default to show the higher number of the two. Use specific times to change the reminders to make sure they dont overlap if they have the same position and put them on multiple charts if needed.
This script is dedicated to Brian Watts, who started something in me when he kept repeating "Don't diddle in the middle!" and "Where is purple?". IYKYK. I would like to thank him for the inspiration to better myself.
As above, so below.
v01

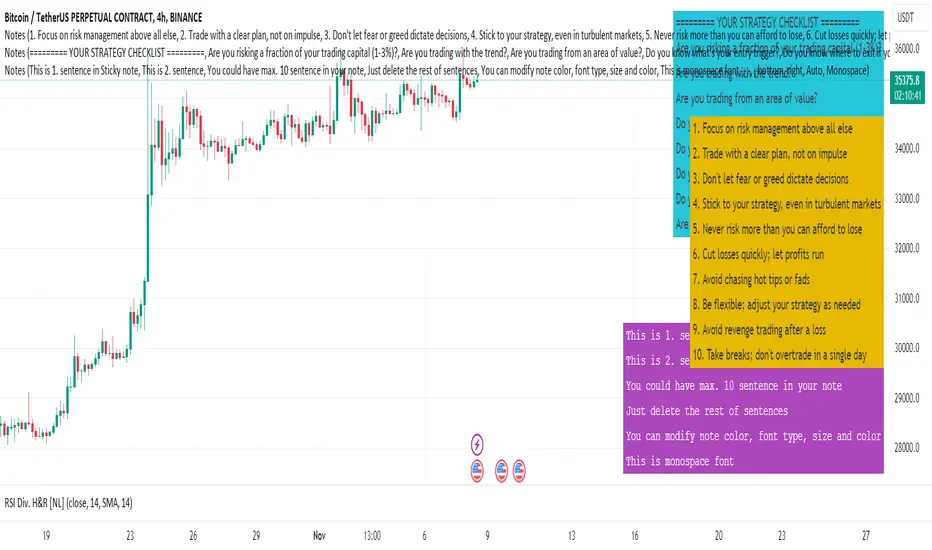
Sticky Notes v1.0 [NL]This Sticky notes.
It can be used for simple reminders, checklists, notes, and strategy descriptions.
You can enter up to 10 sentences.
Notes are highly customizable:
Chose Note Position
Chose Note Color
Chose Font Size
Chose Font Family
Chose Font Color
Screenshots how does it look.
Light theme:
Dark theme:
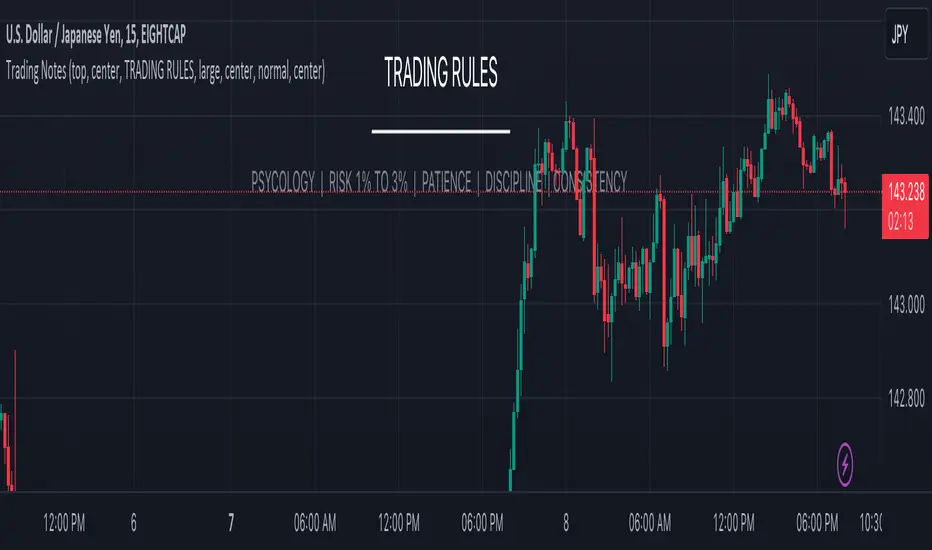
Trading NotesThe "Trading Notes" indicator is a powerful and flexible tool designed to elevate your trading experience by enabling you to effortlessly create, manage, and personalize annotations directly on your trading chart. Whether it's jotting down crucial insights, strategies, risk management rules, or psychological cues, "Trading Notes" ensures that you never miss important details during your trading sessions.
Key Features:
Effortless Annotation: Seamlessly create custom annotations at any position on your chart, ensuring you capture vital trading information in real-time.
Tailored Appearance: Customize your annotations to match your preferences. Adjust text size, color, and alignment to create notes that stand out and are easily readable.
Flexible Positioning: Choose between top, middle, or bottom positions for your annotations, maintaining a clear view of price action while accessing your personalized notes.
Enhanced Focus and Discipline: Maintain trading discipline by keeping track of your trading rules, risk management strategies, and psychological reminders.
BIAS NotesUsage: This indicator allows you to note on your desired pair what is the current state of the trends.
!! How to use: You have to input the values for each table case to your desire in the indicator settings. !!
With this indicator you can note :
-what is the timeframe Bias
-which supply or demand we`ve just hit
I use this as a tool for my analysis with Insitutional Orderflow/SMC (Smart Money Concepts).

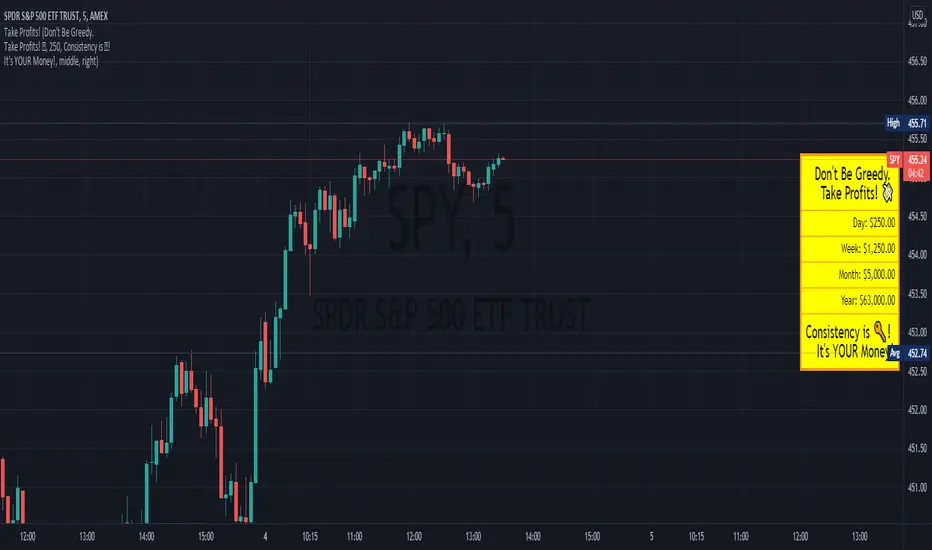
Profit ReminderThis is a Visual Indicator intended to be a reminder to those who need it!
This indicator allows you to set a profit level and displays the calculated values if you were to profit that amount each day.
The vision of this indicator is to get the user more green trades by reminding them to get out while they're ahead, because there are more days ahead!
It also allows for the user to set phrases that might help them with this.
Look forward to what's ahead and don't get caught up in over trading!
[DisDev] Market Maker | Technical Time AnalysisThis indicator has three main components: Days of Week Separators , User-Customized Reminder Notes , and Projected Lines . Each component is explained and demonstrated how it could be used as a trading tool.
The basis of this indicator is to analyze past price movements and then project them as a reminder for traders that previously, at that particular time, there was a price increase/decrease.
1) Vertical lines and labels separate days of the week.
a. The vertical lines allow you to quickly see what day of the week the price movement occurred. For example, if a notable price move happens on Monday, you can use the “Reminder Notes” input to enter a note directly on the chart, as explained below.
b. You can select different colors and styles for the lines or background.
2) Vertical lines can be customized to be displayed in the past and future.
a. This allows you to select a specific time when price has increased/decreased, see how often this has occurred, then notate it as a reminder in the future.
3) User-customized reminder notes for future projected lines.
a. This allows you to input notes to be displayed with the future projected lines.
b. Example: You notice that at 06:45, there had previously been significant price action. Your notes can be updated directly on the chart to remind you of them just before 06:45 on the following days.
Below is the indicator in full use.
You can adjust each line's style, width, color, and reminder notes.
