Dominant Smoothed Volume Pro Smoothed Volume Pro provides a useful tool designed to provide traders with a deeper understanding of market dynamics by analyzing buy and sell volume across multiple timeframes. Unlike traditional volume indicators, this script normalizes volume data from lower timeframes to align with the current chart's timeframe, providing an apples-to-apples comparison. The result is a visual histogram representation of the dominant buy or sell activity, smoothed over 5 different periods to reflect momentum shifts and enhance clarity.
Core Methodology
1. Multi-Timeframe Volume Analysis
This indicator leverages data from five different lower timeframes, each chosen dynamically based on the current chart's timeframe. By aggregating and normalizing these granular data points, the indicator captures subtle shifts in buy and sell volume that might otherwise go unnoticed. This multi-timeframe approach allows for a more detailed and accurate representation of market activity.
2. Data Normalization
Normalization is a critical component of this indicator. It ensures that volume data from lower timeframes is scaled appropriately to match the total volume of the current chart's timeframe. This step eliminates discrepancies caused by varying time intervals, providing a more meaningful comparison of volume trends across different periods.
3. Smoothing for Momentum Representation
The indicator employs five customizable smoothing factors to smooth out noisy volume data.
Each smoothing factor is distinctly color-coded in the histogram and table for intuitive analysis, helping traders quickly identify prevailing trends.
Features and Benefits
➖Customizable Smoothing Factors: Choose from five different smoothing factors, each with its unique settings for line styles, colors, and extensions.
➖Normalized Buy and Sell Volume: Displays normalized buy and sell volumes as a percentage of total activity, aiding in quick decision-making.
➖Visual Cues: Color-coded columns and labels help identify dominant trends at a glance, with high-opacity fills for visual clarity.
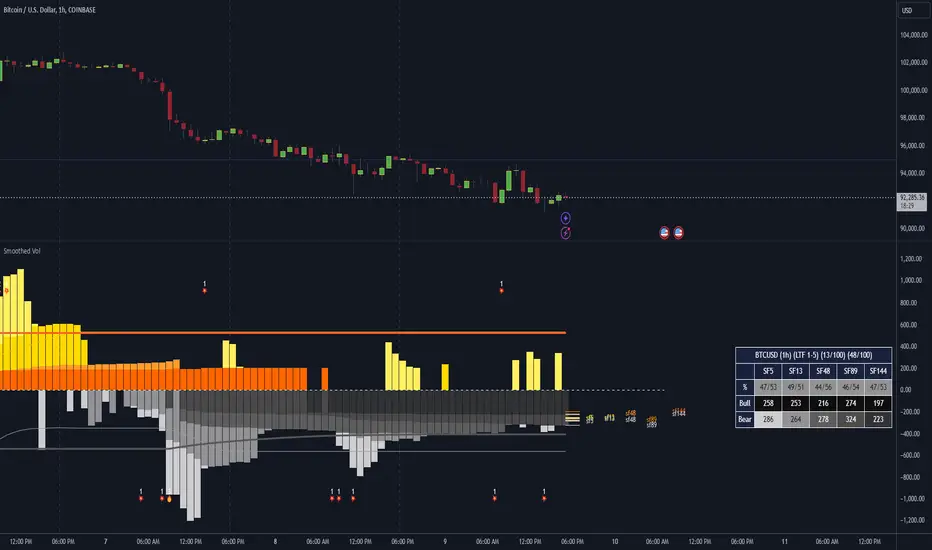
➖Dynamic Table: A built-in table summarizes smoothed volume data for each smoothing factor, offering a quick overview of bullish and bearish percentages.
➖Momentum Signals: Detect significant shifts in volume momentum with visually distinct alerts for high relative volumes, including special symbols like "⚡" and "🔥."
Practical Applications
➖Identifying Market Sentiment: Quickly determine whether the market is dominated by buyers or sellers at any given moment.
➖Spotting Reversals: Use momentum shifts in smoothed volume to anticipate potential trend reversals.
➖Enhancing Entry and Exit Points: Combine this indicator with other technical tools to refine entry and exit points in your trading strategy.
Why This Indicator Stands Out
Many existing volume indicators focus solely on raw or single-timeframe data, which can be misleading or incomplete. This indicator sets itself apart by:
Utilizing multi-timeframe data to provide a holistic view of market activity.
Applying robust normalization techniques to ensure data consistency.
Offering advanced smoothing options to emphasize actionable momentum signals.
This unique combination of features makes it an indispensable tool for traders seeking to enhance their market analysis and decision-making process.
As always, by combining the Smoothed Volume Pro with other tools, traders ensure that they are not relying on a single indicator. This layered approach can reduce the likelihood of false signals and improve overall trading accuracy.
Here's an additional visual representation using the plot fills:
Relative_volume
4C Volume w/ Relative Volume at TimeThis is a Volume indicator that also shows Relative Volume at Time (RVOL).
The RVOL is easily visible as a background color, that changes between Low and High RVOL colors.
The RVOL portion of the indicator is a modified version of the 'Relative Volume At Time' indicator by Tradingview (which has been the best/most accurate RVOL indicator i have seen yet on Tradingview, and seems to closely match the how the "Zanger Volume" indicator works).
Elevated RVOL can be a very important criteria for trading , especially on lower time frames.
This indicator can be used as a simple filter when looking at charts to determine whether it should be traded or not, based on the RVOL.
Higher volume/participation relative to previous time periods can lead to better follow through of moves and price action, and can lead to trending conditions.
Lower RVOL can lead to choppy market conditions, with lower participation and follow through on chart patterns.
The RVOL portion of the indicator draws from the Tradingview 'Relative Volume At Time' indicator developed by authors @e2e4mfck and @LucF , for TradingView.
This indicator takes the Past Volume mark and changes it into a background color.
High RVOL = When the day's cumulative volume is greater than the Past Volume levels, then the background is painted Blue by default
Low RVOL = When the day's cumulative volume is lower than the Past Volume levels, then the background is painted Purple by default
See annotated examples in the chart Below, which compares/contrasts this new indicator with the RVOL indicator by Tradingview:
Portions of the 'Relative Volume At Time' indictor code have been removed to clean up the script.
Plans in the future are to remove more code were possible, to further refine the script and speed up the processing times for the indicator.
If anyone is able to strip out more and keep it functioning the same, please let me know.
Enjoy.
Credit also goes to author @LazyBear . Portions of the Volume indicator is adapted from - HawkEye Volume Indicator
