CK INDEX Strategy Open-source code, Free, No Cost.Aqui está a tradução fiel e técnica para o inglês, ideal para a descrição do seu script no TradingView:
### 1. Requirements (The 3 Principles)
1. **Study** the code.
2. **Modify** the code.
3. **Distribute** copies or derivative versions (respecting the original credits).
Description: Direction and Strength — CK Index
The **CK Index** is a composite indicator formed by the conceptual sum of two CCIs and the PVT (Price Volume Trend) with an arithmetic mean. Its function is to simultaneously validate direction and accumulated flow.
For a **buy operation**, both CCIs must be above zero, indicating bullish dominance across different time horizons, and the PVT must be above its average. For a **sell operation**, the CCIs must be below zero and the PVT below its average.
It is important to emphasize that it acts as an **entry trigger**: the candle will turn **blue** to indicate a buy, **yellow** for a sell, and **white** when there is neutrality (meaning the color will be white when there is no clear definition—these are my personal settings). In its default form, it uses **green, red, and gray**, respectively.
Good trades, and make the world a better and freer place!
Power

Combo 2/20 EMA & Bear Power This is combo strategies for get a cumulative signal.
First strategy
This indicator plots 2/20 exponential moving average. For the Mov
Avg X 2/20 Indicator, the EMA bar will be painted when the Alert criteria is met.
Second strategy
Bear Power Indicator
To get more information please see "Bull And Bear Balance Indicator"
by Vadim Gimelfarb.
WARNING:
- For purpose educate only
- This script to change bars colors.
D_Three Ten Osc Strategy Backtest This indicator allows the user to plot a daily 3-10 Oscillator on a Tick Bar Chart or any intraday interval.
Walter Bressert's 3-10 Oscillator is a detrending oscillator derived
from subtracting a 10 day moving average from a 3 day moving average.
The second plot is an 16 day simple moving average of the 3-10 Oscillator.
The 16 period moving average is the slow line and the 3/10 oscillator is
the fast line.
For more information on the 3-10 Oscillator see Walter Bressert's book
"The Power of Oscillator/Cycle Combinations"
You can change long to short in the Input Settings
Please, use it only for learning or paper trading. Do not for real trading.

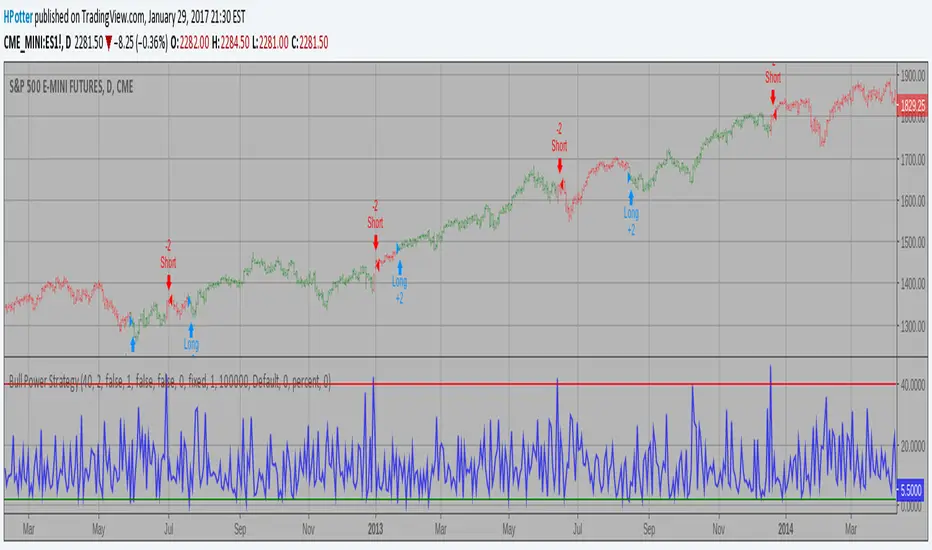
Bull Power Strategy Backtest Bull Power Indicator
To get more information please see "Bull And Bear Balance Indicator"
by Vadim Gimelfarb.