Po3 [Pro]+ |Algo Matrix|█ OVERVIEW
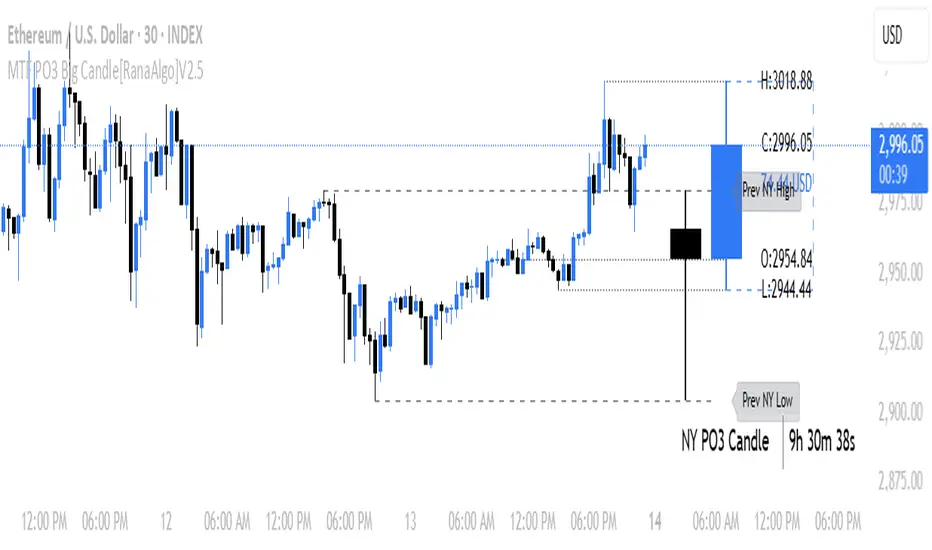
The Po3 + is the definitive market structure engine of the Algo Matrix suite. It is designed to frame the market through the lens of Institutional Dealing Ranges (Power of 3), combining precise Time/Price grids with a multi-layered liquidity mapping system.
This tool integrates three distinct algorithmic modules—PO3 (AMD), LD (Liquidity Depth), and Smart SNR—into a single, clean overlay. It answers the three critical questions of institutional trading: Where is the liquidity? , When is the manipulation? , and Has the delivery state changed?
█ KEY FEATURES
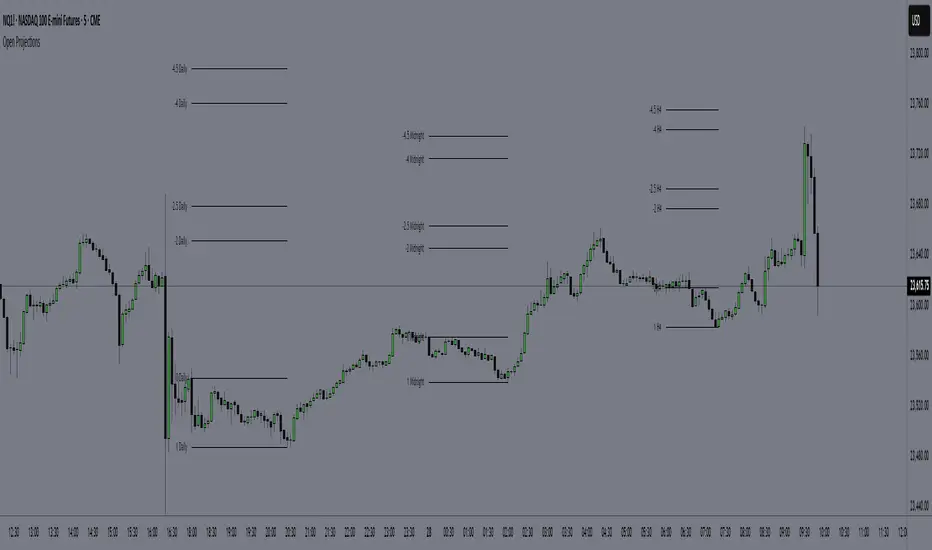
PO3 & AMD Matrix : Automatically projects the institutional "Playing Field" for the session. Time/Price Grid: Vertical and Horizontal delineations based on the chosen timeframe. AMD Time Fibs: Plots specific harmonic time cycles (0.375, 0.625, 0.81) to help identify the shift between Accumulation, Manipulation, and Distribution phases.
Liquidity Engine (CISD/LQ) : A dual-mode logic system for identifying active liquidity pools and trend reversals. Active Mode: plots open liquidity pools (Highs/Lows) that extend until swept. Filter Mode (CISD): Uses "Change In State of Delivery" logic. It waits for a candidate high/low to be broken and then verifies the reversal with a solid Red (Sell) or Green (Buy) line.
LD + Integration : Deep market structure analysis. Major Swings: Identifies Higher Timeframe (HTF) pivot points and visualizes "Sweeps" with dashed vectors. Internal Structure: Can overlay internal MSS (Market Structure Shifts) and CISD levels to refine entry precision within the larger swing.
Smart SNR (Inversion Logic) : An automated Support & Resistance engine that understands order flow. S/R Flip: If a Strong Resistance is broken with body closure, the algorithm automatically "Inverts" the level, repainting it as Support (and vice-versa). Tap Detection: Identifies and marks precise wicks that "Kiss" the level.
█ HOW TO USE
Frame the Session : Use the AMD Time Fibs to anticipate the "Judas Swing" (Manipulation). Manipulation often terminates near the 0.375 or 0.625 time vertical.
Identify the Liquidity : Wait for price to trade into a Major Swing (LD) level. Look for the "Sweep" dashed line to appear, indicating stops have been taken.
Confirm the Reversal : Once a sweep occurs, watch for the CISD Line (Filter Mode) or an MSS trigger. This confirms that the institutional order flow has shifted in your direction.
Target the Flip : Use the Smart SNR levels as targets. If price breaks a resistance, wait for it to invert to support for a continuation entry.
█ DISCLAIMER Trading financial markets involves high risk. This tool is a technical analysis aid for educational purposes and does not constitute financial advice.
By |Algo Matrix|
อินดิเคเตอร์ Pine Script®