กลยุทธ์ Pine Script®
จุดหมุนและระดับ

IQV - Strategy Builder V1IVQ – Strategy Builder V1
A rule-based strategy development tool for TradingView that enables systematic backtesting and evaluation of trading concepts. Combines valuation filters, supply & demand structures, price action rules, and risk management parameters (SL/TP, CRV) to build, visualize, and analyze strategies directly on the chart and in the TradingView strategy tester.
invoriaquant.onepage.me
กลยุทธ์ Pine Script®

ADX Price Movement Strategy. TG:@MrBCNADX Price Movement Strategy is a trading strategy for TradingView that uses the ADX indicator to determine the strength of price movement. The strategy identifies the beginning and end of momentum, filters out flat periods, and generates LONG/SHORT signals only when there is a strong trend. Suitable for cryptocurrencies, forex, and stocks, it is effective on short and medium timeframes.
ADX Price Movement Strategy — торговая стратегия для TradingView, использующая индикатор ADX для определения силы движения цены. Стратегия выявляет моменты начала и окончания импульса, фильтрует флет и подаёт сигналы LONG / SHORT только при наличии сильного тренда. Подходит для криптовалют, форекса и акций, эффективна на младших и средних таймфреймах.
TG:@MrBCN
กลยุทธ์ Pine Script®

Order Block Strategy Pyramiding. TG:@MrBCNOrder Block Strategy Pyramiding is a strategy for TradingView based on the concept of Order Blocks. It identifies areas of interest for major market participants and looks for price reversal points when prices return to these areas. It generates LONG/SHORT signals, is suitable for cryptocurrencies, forex, and stocks, and is effective on short and medium timeframes.
Order Block Strategy Pyramiding — стратегия для TradingView, основанная на концепции Order Blocks. Определяет зоны интереса крупных участников рынка и ищет точки разворота цены при возврате в эти зоны. Генерирует сигналы LONG / SHORT, подходит для криптовалют, форекса и акций, эффективна на младших и средних таймфреймах.
TG:@MrBCN
กลยุทธ์ Pine Script®

Order Block Strategy ReversWIN: 70-100%
8, 3, 3,1
TP 1.6%
Order Block Strategy Revers is a trading indicator that identifies key order block zones (areas of accumulation by large players) and looks for price reversal points. The indicator tracks impulsive movements, forms supply and demand levels, and generates LONG/SHORT signals when the price returns to the order block with confirmation. Suitable for crypto, forex, and stocks, effective on medium and lower timeframes.
Translated with DeepL.com (free version)
Order Block Strategy Revers — это торговый индикатор, который определяет ключевые order block зоны (области накопления крупных игроков) и ищет точки разворота цены. Индикатор отслеживает импульсные движения, формирует уровни спроса и предложения и подаёт сигналы LONG / SHORT при возврате цены в order block с подтверждением. Подходит для крипты, форекса и акций, эффективен на средних и младших таймфреймах.
กลยุทธ์ Pine Script®

Prismatic Liquidity Engine [JOAT]Prismatic Liquidity Engine v6 - SMC Structure, Liquidity & Confluence Suite
IMPORTANT NOTES (READ FIRST)
This is a strategy script with automated entry/exit logic for backtesting and forward-testing purposes. It does not place live trades without your broker integration.
This script is written in Pine Script® v6 and is intended to be used on standard candlestick charts (not Heikin Ashi, Renko, etc.).
Source code visibility: This script is published as Protected Source (closed-source) to prevent unauthorized copies and maintain versioning integrity. This description documents what the strategy does, how it works, and how to use it.
All backtesting results shown use the default settings documented below. Adjust parameters for your specific instrument and risk tolerance.
Protected Source / Closed-Source Clarification
Protected source means the internal implementation is not publicly viewable.
The operational behavior is documented here: what is detected, what each module does, what each input controls, and how to interpret the output.
If you see unauthorized copies elsewhere, report them via TradingView's plagiarism reporting system.
Overview
Prismatic Liquidity Engine v6 is a Smart Money Concepts (SMC) strategy that combines market structure analysis, liquidity zone detection, and price imbalance identification into a unified decision framework. The strategy identifies trading opportunities by analyzing:
Market structure shifts (Break of Structure / Change of Character)
Liquidity pools (equal highs/lows where stops accumulate)
Price imbalances (Fair Value Gaps created by aggressive institutional participation)
Order blocks (accumulation/distribution zones)
The strategy requires confluence across multiple factors before generating entries, filtering out noise and focusing on setups where structure, liquidity, and momentum align.
What Makes This Strategy Original (Originality & Usefulness)
This is not a simple mashup of standard indicators. The strategy implements a coordinated SMC workflow:
Structure defines the directional bias (BOS confirms trend, CHoCH signals potential reversal).
Liquidity zones identify where stop-hunts are likely to occur before major moves.
FVGs and Order Blocks provide objective entry zones with defined invalidation levels.
Session filtering restricts trading to high-liquidity periods (London/NY overlap).
ATR-based risk management adapts stop/target placement to current volatility.
Confluence scoring requires multiple conditions to align before entry.
The purpose is to systematize SMC concepts into a testable, repeatable framework rather than relying on discretionary interpretation.
1) Chart Visuals — What You See
A) Fair Value Gap (FVG) Zones
The strategy detects three-candle formations that create price imbalances:
Bullish FVGs : Gap between candle 1's high and candle 3's low after aggressive upward movement.
Bearish FVGs : Gap between candle 1's low and candle 3's high after aggressive downward movement.
Zones are drawn as boxes with size labels showing the gap in price terms.
Mitigation tracking marks zones as "used" when price trades back through them.
How to use:
FVGs represent areas where price moved too fast for balanced trading.
Price often returns to these zones before continuing in the original direction.
The strategy uses FVGs as potential entry zones when other confluence factors align.
B) Order Block (OB) Zones
Bullish OBs : Last down-candle before a strong upward move (institutional absorption).
Bearish OBs : Last up-candle before a strong downward move (institutional distribution).
Volume-weighted analysis distinguishes significant blocks from noise.
Breach detection invalidates spent order blocks.
C) Market Structure Labels
BOS (Break of Structure) : Price breaks beyond previous swing high/low, confirming trend continuation.
CHoCH (Change of Character) : Price breaks structure against the prevailing trend, signaling potential reversal.
Swing highs/lows are marked and connected for visual structure tracking.
D) Liquidity Zone Markers
Equal highs : Buy-side liquidity pools (stop losses from shorts).
Equal lows : Sell-side liquidity pools (stop losses from longs).
Sweep detection identifies when liquidity is taken.
E) Session Background Shading
Asian session: 0000-0900 UTC
London session: 0700-1600 UTC
New York session: 1300-2200 UTC
Background tint indicates active session for context.
F) Trend EMAs (Optional)
EMA 20 / 50 / 200 for trend direction context.
Used internally for trend alignment requirements.
2) Strategy Execution Logic (How Entries Work)
Long Entry Conditions (all must be true):
Market bias is bullish (confirmed by BOS or CHoCH analysis).
Price is within a valid bullish FVG or Order Block zone.
EMAs show bullish alignment or recovery.
Volume exceeds 20-period moving average (participation confirmation).
Trade window is active (session filter).
A BOS or CHoCH signal is present.
Short Entry Conditions (all must be true):
Market bias is bearish (confirmed by BOS or CHoCH analysis).
Price is within a valid bearish FVG or Order Block zone.
EMAs show bearish alignment or recovery.
Volume exceeds 20-period moving average.
Trade window is active.
A BOS or CHoCH signal is present.
Exit Logic:
Primary stop loss: ATR-based (default 1.5x ATR).
Fallback stop: Recent swing point if ATR stop is too wide.
Take profit: ATR-based (default 2.5x ATR).
Trailing stop available for locking in profits.
3) Strategy Properties & Backtesting Documentation
Default Strategy Properties (Properties Tab):
Initial Capital : $10,000 USD — realistic for average retail trader
Base Currency : USD
Order Size : 10% of equity per trade
Pyramiding : 1 order (no pyramiding for conservative risk)
Commission : 0.05% per order (realistic for CFD/forex brokers)
Slippage : 2 ticks per order (accounts for market impact)
Risk Per Trade:
With ATR Stop Multiplier at 1.5x and 10% position sizing, typical risk per trade is approximately 1-3% of equity depending on volatility. This is within the sustainable 5-10% maximum recommended by TradingView guidelines.
Published Backtest Results (GOLD 5m, Sep 28, 2025 – Jan 12, 2026):
Total Trades : 37
Profitable Trades : 56.76% (21 of 37)
Profit Factor : 2.067
Net Profit : +$40.90 USD (+0.04%)
Max Drawdown : $98.62 USD (0.10%)
Sample Size Justification:
This strategy intentionally generates fewer trades (37 in this sample) because it requires multi-factor confluence before entry:
Market structure confirmation (BOS or CHoCH)
EMA trend alignment
Valid SMC zone proximity when zone filter is enabled
The confluence requirement filters out low-probability setups, resulting in a positive profit factor (2.07) and controlled drawdown (0.10%) at the cost of trade frequency. This is a deliberate design choice — the strategy prioritizes quality over quantity .
To increase sample size for your own testing:
Test across multiple instruments (EURUSD, BTCUSD, indices)
Extend the historical date range
Reduce Swing Length parameter from 5 to 3
Strategy Input Defaults:
Swing Length : 5 bars
ATR Period : 14 bars
ATR Stop Multiplier : 1.5x ATR
ATR Take Profit Multiplier : 2.5x ATR (1.67:1 reward-to-risk)
Risk % of Equity : 1.0%
Trading Session : 0000-2359 (all sessions)
Require FVG/OB Zone Entry : OFF
Require Volume Confirmation : OFF
Require EMA Alignment : ON
Backtest Limitations & Realistic Expectations:
Backtesting assumes perfect fills at the close price — live execution will differ.
Commission and slippage significantly impact net results. Always test with your broker's actual fees.
Past performance does not guarantee future results.
Results vary across instruments, timeframes, and market regimes.
This strategy performs best in trending markets with clear structure — ranging/choppy conditions will produce more false signals.
Always forward-test on paper before risking real capital.
4) Real-Time Dashboard
The dashboard provides market context at a glance:
Market Bias : BULLISH / BEARISH / NEUTRAL based on structure.
Trend Strength : STRONG / WEAK based on EMA alignment.
ATR : Current volatility level with HIGH / MEDIUM / LOW classification.
Volume : Current volume ratio vs 20-period average (SPIKE / HIGH / NORMAL / LOW).
Session : Active trading session.
Key Levels : Dynamic resistance and support from recent structure.
Signal Count : Active SMC signals with strength indicator.
Trade Window : OPEN / CLOSED based on session filter.
5) Inputs & Settings Reference
Structure Detection
Swing Length : Lookback for swing high/low detection (default: 5). Lower = more signals, Higher = major structure only.
FVG Settings
Show FVGs : Toggle FVG box display.
FVG Extension : How long FVG boxes extend forward (default: 20 bars).
Order Block Settings
Show Order Blocks : Toggle OB display.
OB Extension : How long OB boxes extend forward (default: 20 bars).
Liquidity Settings
Liquidity Range % : ATR percentage for "equal high/low" classification (default: 0.5%).
Show Liquidity Zones : Toggle liquidity pool markers.
Strategy Controls
Enable Long Trades : Allow long entries (default: ON).
Enable Short Trades : Allow short entries (default: ON).
Risk % of Equity : Maximum risk per trade (default: 1.0%).
ATR Period : Length for ATR calculation (default: 14).
ATR Stop Multiplier : Stop distance in ATR units (default: 1.5).
ATR TP Multiplier : Take profit distance in ATR units (default: 2.5).
Trading Session Filter : Restrict entries to specific time windows (default: 0000-2359 = all day).
Require FVG/OB Zone Entry : When ON, price must be inside an FVG or OB zone. When OFF, trades trigger on structure signals alone (default: OFF).
Require Volume Confirmation : When ON, volume must exceed 20-period average (default: OFF).
Require EMA Alignment : When ON, price must be above/below EMAs for direction (default: ON).
Visual Settings
Show Dashboard : Toggle dashboard display.
Show Sessions : Toggle session background shading.
Show Fibonacci : Toggle Fibonacci level display.
Color Customization : Full control over all visual elements.
6) Recommended Workflow
Step 1 — Configure Risk Parameters
Set risk % appropriate for your account (1-2% recommended).
Adjust ATR multipliers based on your instrument's volatility.
Set commission/slippage to match your broker.
Step 2 — Select Appropriate Timeframe
M15-H1 : Best balance of signal frequency and reliability.
H4-D1 : Higher quality signals, fewer false positives.
M1-M5 : Scalping possible but requires tighter risk management.
Step 3 — Backtest on Your Instrument
Run strategy tester with realistic commission/slippage.
Review trade list for entry quality.
Adjust parameters if needed for your specific market.
Step 4 — Forward Test Before Live Trading
Paper trade or use small size to validate real-time behavior.
Monitor for any discrepancies between backtest and live conditions.
7) Suitable Markets
Forex majors (EURUSD, GBPUSD, USDJPY) — 24/5 liquidity, clear structure.
Major indices (SPX, NASDAQ, DAX) — trending behavior, respects levels.
Gold (XAUUSD) — respects structure and liquidity concepts.
Crypto (BTCUSD, ETHUSD) — high volatility, adjust ATR multipliers.
8) Limitations & Best-Use Guidance
This strategy is a decision-support and backtesting tool, not a guaranteed profit system.
Performance varies across market conditions (trending vs ranging).
Low liquidity periods may produce false signals.
News events can override technical analysis.
Overnight gaps may affect stop placement.
Always validate with forward testing before live capital.
9) Alerts
Bullish / Bearish Regime Start
FVG Formation (Bull / Bear)
Order Block Detection
BOS / CHoCH Structure Shift
Liquidity Sweep
High-Volume Confirmation
Recommended: Use "Once Per Bar Close" for most reliable alerts.
Disclaimer
This strategy is for educational and backtesting purposes only. It does not constitute financial advice. Trading involves substantial risk of loss. Past performance does not guarantee future results. Always test configurations on historical data and paper trading before applying them to live capital. You are solely responsible for your trading decisions and risk management.
-Made with passion by officialjackofalltrades
กลยุทธ์ Pine Script®

Stark Overnight Levelsovernight levels with asia high, asia low, midnight open, london high, london low
กลยุทธ์ Pine Script®

B1 (Breakout System)What it is
B1 is a fast-execution intraday breakout framework designed to capture short-duration morning moves with strict risk definitions. It prioritizes repeatability and controlled downside over maximizing signal count.
How it works (high level)
Structure anchor: B1 defines a repeatable morning structure window and only considers trades when that structure produces a valid breakout condition.
Context gate (shared screener): Participation can be gated by a shared analysis filter so the system doesn’t trade every breakout-looking day.
Risk + exits: Stop placement and targets are derived from the same model so trades are comparable across time (not manually improvised).
How it’s different from a generic “breakout script”
B1 is not a mashup of unrelated indicators; the “structure → context → execution” pipeline is one model. Signals are a byproduct of the model, not a collection of bolt-on confirmations.
How to use
Keep defaults at first; treat it as a complete system.
Judge performance by drawdown behavior and stability, not single trades/days.
Initial Capital: 100000
Base Currency: Default
Default Order Size: 100000 USD
Pyramiding: 1
Testing + risk notes
Use realistic commission + slippage, sustainable risk, and sufficient sample size. Default Properties/Inputs used in published results must be documented.
Strategy testing disclosure
Backtests vary by symbol, timeframe, session settings, and fill assumptions. Use realistic commission + slippage, avoid oversized % risk, and evaluate a meaningful sample size before drawing conclusions. Published results must match the default Properties/Inputs shown in the script.
Not financial advice. Futures trading involves risk. Past performance does not guarantee future results.
กลยุทธ์ Pine Script®

P1 (Pivot System)What it is
P1 is a volatility-anchored intraday level framework that maps each session into structured reference levels. It’s designed to help traders stop treating every price area as equal by providing a consistent “session map.”
How it works (high level)
Volatility measurement: P1 estimates session-relevant volatility and uses that measurement to space meaningful levels.
Level generation: Levels are derived from the model (not hand-drawn pivots) so they remain consistent and testable.
Context alignment: The same environment/analysis layer can be used to filter which level interactions matter most in the current regime.
How to use
Use Default Settings & P1 levels as your structure map; use the screener as the gate.
Track results by regime (trend/volatility), not as one uniform edge.
Initial Capital: 1000000
Currency: Default
Default Order Size: 1
Pyramiding: 1
Strategy testing disclosure
Backtests vary by symbol, timeframe, session settings, and fill assumptions. Use realistic commission + slippage, avoid oversized % risk, and evaluate a meaningful sample size before drawing conclusions. Published results must match the default Properties/Inputs shown in the script.
Not financial advice. Futures trading involves risk. Past performance does not guarantee future results.
กลยุทธ์ Pine Script®

ORB Breakout Strategy with VWAP and Volume FiltersOverview
This strategy implements the classic Opening Range Breakout (ORB) methodology, a well-documented approach in trading literature that has been used by institutional and retail traders for decades. The strategy identifies the high and low of the first 15 minutes of the trading session, then trades breakouts with defined risk management.
This implementation includes multiple customizable filters (VWAP, Volume, Candle Strength) that traders can enable, disable, and tune to find configurations that work for their specific markets and trading style.
How It Works
Opening Range Calculation
The strategy captures the high and low of the first N bars after the session open (default: 3 bars on a 5-minute chart = 15 minutes). These levels become the breakout triggers for the session.
Entry Logic
Long Entry: When a bar closes above the ORB High and all enabled filters pass
Short Entry: When a bar closes below the ORB Low and all enabled filters pass
Exit Logic
Take Profit: Configurable multiple of the ORB range (default: 1x = full range beyond breakout level)
Stop Loss: Opposite side of the ORB range
Breakeven: Optional stop adjustment to entry price when trade reaches configurable profit threshold
Session Close: All positions automatically closed at end of trading session
Configurable Filters
All filters can be independently enabled or disabled:
1. VWAP Filter
Requires price above/below session-anchored VWAP
Requires VWAP slope confirmation (configurable lookback and minimum slope)
Purpose: Align trades with intraday trend direction
2. Volume Filter
Requires minimum volume on the breakout bar
Purpose: Confirm institutional participation in the breakout
3. Candle Strength Filter
Requires close in upper/lower portion of the bar range
Purpose: Filter out weak breakouts with poor conviction
Strategy Properties
Initial Capital - $50.000USD
Position Size - 1 contract (fixed)
Commission - $4.00 per contract
Slippage - 2 ticks
Margin - 1%
Pyramiding - Disabled
Backtest Results (NQ)
Recent Performance (Jan 2025 - Jan 2026)
Total Trades - 243
Win Rate - 39.09%
Profit Factor - 1.03
Net P&L - $3,581 (+7.16%)
Max Drawdown - $25,447 (39.96%)
Long-Term Performance (2010 - 2026)
Total Trades - 1699
Win Rate - 37.61%
Profit Factor - 0.756
Net P&L - ($49,632) (-99.26%)
Max Drawdown - $50,262 (99.27%)
Important: Long-term results show negative expectancy with default settings. This strategy is published as a research framework, not a ready-to-trade system. Users are encouraged to experiment with different configurations to find their edge.
Settings Guide
Main Settings
ORB Bars: Number of bars for opening range (3 = 15 min on 5-min chart)
Trading Session: Time window for trading (e.g., 0930-1200 for morning only)
Timezone: Your market's timezone
Take Profit: Multiple of ORB range for target
Breakeven Trigger: Distance to move stop to entry
Max Trades Per Day: Daily trade limit
VWAP Filter
Use VWAP Filter: Enable/disable
VWAP Slope Lookback: Bars to measure VWAP direction
Min VWAP Slope: Minimum slope threshold
Volume Filter
Use Volume Filter: Enable/disable
Min Breakout
Volume: Minimum contracts required
Candle Strength Filter
Use Candle Strength Filter: Enable/disable
Min Candle Strength: Required close position (0.7 = top/bottom 30%)
Research Suggestions
This strategy provides a foundation for exploring ORB-based approaches. Consider testing:
Different ORB periods: 5, 10, 15, or 30 minutes
Session variations: Morning only (0930-1200), afternoon, or full day
Direction bias: Long-only or short-only based on daily trend
Filter combinations: Different mixes of VWAP, volume, and candle filters
Take profit ratios: 0.5x, 1x, 1.5x, or 2x ORB range
Market regimes: Performance may vary in trending vs ranging markets
Different instruments: Test on ES, NQ, MNQ, or other futures
Visual Elements
Orange Background: ORB forming period
Green Background: Active trading session
Green Line: ORB High level
Red Line: ORB Low level
VWAP Line: Green = upslope, Red = downslope, Gray = flat
White Line: Trade entry price
Lime Line: Take profit level
Red Line: Stop loss level
Orange Line: Breakeven trigger level
Blue Background: Breakeven activated
Triangles: Entry signals (only appear when trade executes)
Limitations
Negative long-term expectancy: Default settings do not produce profitable results over extended periods
Parameter sensitivity: Results highly dependent on filter settings and market conditions
Market regime dependent: May perform differently in trending vs choppy markets
Commission impact: Frequent trading accumulates significant transaction costs
Curve fitting risk: Optimized settings may not persist in future markets
Disclaimer
This strategy is provided for educational and research purposes only. It does not constitute financial advice.
Past performance does not guarantee future results
Backtested results may not reflect actual trading conditions
The long-term backtest shows significant negative returns
Always paper trade before risking real capital
Never risk more than you can afford to lose
Conduct your own research and due diligence
This is a research framework designed for traders to explore and customize, not a plug-and-play trading system.
กลยุทธ์ Pine Script®

กลยุทธ์ Pine Script®

Trade X Labs Pivot V2.0 Beta---------------------------------------Pivot Master Trading Tool Beta------------------------------------------
Professional pivot-based strategy for intraday/futures trading with clear risk management and visual clarity.
**Key Features:**
- Classic pivot points (PP) + multiple resistance/support levels (R1–R10 / S1–S10)
- Midpoint levels between pivots (optional minimum gap enforcement)
- Percentage-based trigger zones above/below pivots for high-probability entries
- Configurable target percentage from entry
- Abandonment logic (position closed if price retreats X% from entry without hitting target)
- Strict session time filter + holiday early close support
- Daily max loss/target limits (stop-losses and winners)
- Optional TradersPost webhook integration for auto-trading/alerter platforms
- Built-in trailing stop runner with multiple exit methods
- Breakeven + partial trailing logic
**Main Input Parameters:**
**Pivots**
- Number of Levels Each Direction: how many R/S levels to calculate beyond R1/S1 (default 10)
- Min Gap for Midpoints: minimum points/pips between consecutive midpoints (default 150)
- Enforce Mid Point Gap Limit: whether to skip midpoints that are too close together
**Triggers**
- Trigger Percentage: distance (%) from pivot needed to consider a breakout valid (default 10%)
**Targets**
- Target Percentage: profit target measured from entry price (default 90%)
**Abandonment**
- Abandon Percentage: max adverse move (%) allowed before trade is abandoned (default 50%)
- Show Abandon Label / Show Abandon Hit Label: visual markers for abandoned trades
**Trading Time**
- Trading Start/End Hour:Min – main trading window
- Last Trade Hour: latest time new entries are allowed
- Holiday Eve Close Hour: early close time on holiday eves
- Max Trade Duration (minutes): auto-exit after this many minutes (default 30)
**Limits**
- Max Stop Losses Per Day
- Max Targets (winners) Per Day
**Position & Risk**
- Risk Amount ($): dollar risk per trade used to calculate position size
**Visual & Display**
- Days to Keep Lines/Labels
- Show Breakout Zones / Prices on Scale / Midpoints on Scale
- Custom colors, widths, font sizes for all lines & labels
**Trailing Stop Runner (optional module)**
- Enable TrailingStopRunner
- Trailing Exit Method: High/Low or Close
- Enable Breakeven
- BE Risk:Reward ratio for moving to breakeven
- Trailing Update Ticks: how often trailing stop is recalculated
Perfect for MNQ NQ Futures - Customize and create your own strategies across all markets!
กลยุทธ์ Pine Script®

LR Candles V2.1IMPORTANT: Use this strategy only with Heikin Ashi candles; otherwise, the results will be negative.
The use of this strategy is solely and exclusively under the responsibility of the operator.
To perform testing correctly and as close to market reality as possible, we suggest setting the strategy preferences as follows:
Slippage = 3
Using bar magnifico = Enabled
Commission = Completed
Detail: It is important to include at least 1,000 trades in the test. This provides a certain robustness in the historical analysis of a strategy. Values lower than this may alter the expected results when trading in real life.
Tip:
Play around with different time frames and calibrations on the strategic indicator. Examples include unchecking Ling-Reg, unchecking EMA, or using both in combination. Look for the best probability and results for a specific asset.
The strategy usually performs well on time frames longer than 1 hour; this is what has been observed.
กลยุทธ์ Pine Script®

Bollinger Reversal + Swing ExitBollinger Reversal + Swing Exit is a mean-reversion strategy designed to capture short-term reversals when price stretches to an extreme and then shows the first signs of rejection.
1. Core idea
This strategy assumes that sharp deviations from a central equilibrium are often followed by a corrective move back toward normal pricing. It does not chase trends. Instead, it waits for price to reach an extreme area and then looks for a controlled turn back in the opposite direction.
2. Signal concept
A setup starts only after price reaches an outer extreme zone. The trade is taken only if the market immediately shows a reversal-type reaction rather than continuing to push outward. This reduces entries that happen too early while the move is still accelerating.
3. Long and short behavior
Long trades are allowed only after a downside extreme has been reached and price begins to recover.
Short trades are allowed only after an upside extreme has been reached and price begins to fade.
The goal is to enter close enough to the extreme to keep risk contained, while still requiring evidence that the turn has started.
4. Risk control
Risk is defined tightly. The protective stop is placed where the reversal thesis is clearly invalidated, so the strategy is built to accept small losses when the market does not revert and continues expanding in the same direction.
5. Exit logic
Profits are taken based on local market structure rather than fixed targets. Once in a position, the strategy looks for a clear exhaustion point in the move and closes the trade when the short-term swing structure signals that the rebound or pullback has likely completed. This aims to capture the core of the corrective move without overstaying.
6. Best conditions
This approach performs best in range-bound markets, during consolidations, and in instruments that frequently oscillate around a fair value. It is also useful after impulsive spikes when the move becomes overstretched and liquidity rebalances.
7. When to avoid
Avoid using it during strong, clean trends and during persistent breakout phases, where extremes can keep extending and reversals can fail repeatedly. In these conditions, mean-reversion setups can be systematically punished.
8. What to expect
Expect a higher trade frequency than trend-following systems, with many small-to-medium wins and occasional sharp losses when the market refuses to revert. The edge comes from disciplined entries only after extremes and quick exits when structure signals completion.
กลยุทธ์ Pine Script®

Liquidity Sweep pro📌 Liquidity Sweep Pro – Strategy Description
Liquidity Sweep Pro is a price–action based trading strategy designed to identify liquidity grabs and smart money reversals around key swing highs and lows.
This strategy focuses on moments where price takes out resting liquidity above recent highs or below recent lows, then shows clear rejection and directional intent, which often precedes strong reversals or continuations.
🔍 Core Logic
The strategy is built on three main concepts:
1️⃣ Liquidity Sweep Detection
Identifies recent swing highs and swing lows using pivot structure
Detects when price sweeps above a high or below a low, signaling liquidity collection
2️⃣ CISD Confirmation (Change in State of Delivery)
After a liquidity sweep, the strategy waits for:
Bearish confirmation after sweeping highs
Bullish confirmation after sweeping lows
This confirmation is based on candle behavior and price closing back inside the structure, filtering out false breakouts.
3️⃣ Optional Trend Filter (Hull MA)
An optional Hull Moving Average filter can be enabled to trade:
Longs in bullish conditions
Shorts in bearish conditions
This helps reduce counter-trend trades while keeping the strategy flexible.
🎯 Risk Management
Stop Loss and Take Profit are calculated dynamically using ATR
Fully customizable Risk : Reward ratio
Designed to adapt to different market conditions and volatility levels
⚙️ Recommended Usage
Best suited for intraday and scalping trading
Works well on:
XAUUSD (Gold) – M3 / M5
Crypto – M5 / M15
Indices – M5
The strategy does not repaint and only generates signals after candle close.
⚠️ Disclaimer
This strategy is for educational and research purposes only.
Always test and optimize parameters for your specific market and timeframe before using it in live trading.
กลยุทธ์ Pine Script®

Buy the dips StrategyThis strategy getting in long position only after the price drop- Buy the dips
The % of the drop is Determined by SMA for the first trade
The inputs of SMA and % of the drop can be adjust from the User
After that Strategy start taking safe trades if not take profit from the first trade
The safe trades are Determined by step down deviation % and by quantity
There is no Stop loss is not for one with small tolerance to getting under
if any question ask
กลยุทธ์ Pine Script®

Daily Dynamic Grid StrategyHi everyone,
This strategy is built around a dynamic daily grid concept, using an upper and lower daily range that is automatically divided into multiple grid levels.
The idea is to take advantage of daily volatility by executing DCA entries on specific grid levels, based on predefined conditions.
Key points of the strategy & feature:
I recommend using 1H or 2H timeframe for this strategy
Take profit by grid
When DCA is active (>1 entry), the exit condition switches to close above the average price
A hard stop loss is applied
Includes an optional Trailing TP / SL to help maximize profit during strong moves
Like most DCA-based strategies, it tends to have a high win rate, but during strong market dumps, losses can become relatively large
Can also be used for backtest on Forex markets such as Gold, where using the trailing option is generally more effective
And still trial for the webhook, may continue to improve and update this strategy in future versions.
กลยุทธ์ Pine Script®

Kairos Bands [v1.1]Overview
The Kairos Bands Strategy is a highly modular trading system designed to identify high probability entry points based on volatility exhaustion and momentum shifts... It is built with a proprietary core algorithm that detects when price has extended too far from its mean, but it is wrapped in a Confluence Cloud that allows the user to filter these signals through nine different secondary indicators...
This is not just a static strategy... It is a framework that allows you to build your own edge by toggling specific filters on and off to match current market conditions...
1... The Chameleon Feature (Trend or Reversal)
One of the most powerful features of Kairos Bands is the Inverse Trades logic...
Reversal Mode (Default): By default, the strategy looks for price exhaustion... It buys when the market is oversold and sells when the market is overbought... This is ideal for ranging markets or catching tops and bottoms...
Trend Following Mode (Inversed): By checking the Inverse Trades box in the settings, the logic flips completely... A Buy signal becomes a Sell and vice versa... This transforms the strategy into a breakout or trend following system, entering trades in the direction of the momentum rather than against it...
2... The Confluence Cloud
While the core trigger is based on proprietary volatility calculations, the user has full control over how strictly those trades are filtered... You can toggle any of the following 9 momentum filters independently for both Long and Short setups...
RSI (Relative Strength Index)
Stochastic Oscillator
CCI (Commodity Channel Index)
Williams %R
MFI (Money Flow Index)
CMO (Chande Momentum Oscillator)
Fisher Transform
Ultimate Oscillator
ROC (Rate of Change)
For example, you can require RSI and MFI to agree with the main signal for Longs, but only require Stochastic for Shorts... This allows for granular tuning...
3... Trend Bias & Time Management
To further refine entries, the strategy includes:
EMA Trend Filter: An optional dual EMA system (Fast vs Slow) that forces the strategy to only trade in the direction of the dominant trend...
Precision Time Filtering: You can define exact start and end times (down to the minute) for entries...
No Trade Zone (NTZ): A specific time window where the strategy is forbidden from holding positions... If a trade is open when the NTZ begins, it is immediately force closed to avoid volatility events or market closes...
4... Risk Management
The strategy moves away from vague percentage based stops and uses precision point based targeting...
Fixed Points: Set your Take Profit and Stop Loss in exact price points...
Signal Skipping: An optional feature to cool down the strategy after a trade closes, forcing it to skip a set number of subsequent signals to avoid over trading...
5... Professional Analytics Dashboard
The visual overlay provides a detailed Heads Up Display (HUD) containing institutional grade metrics...
Strategy Grade: An automatic A through F grading system based on the Win Rate Differential (how much better the strategy performs compared to a breakeven coin flip)...
Streak Analysis: Tracks the maximum and average consecutive wins and losses to help you understand the psychological drawdown risk...
Rolling PnL: A secondary dashboard tracks your hypothetical Net PnL over the last 7 trading days and the last 12 months, giving you a clear view of short term and long term performance...
กลยุทธ์ Pine Script®

Daily High/Low Breakout Strategy v2Long and Short trade signal strategy, connects via API key to any exchange, can be used as an indicator. Based on the break of maximum and minimum levels. preferred timeframe 5 minutes.
กลยุทธ์ Pine Script®

ATR ZigZag BreakoutATR ZigZag Breakout
This strategy uses my ATR ZigZag indicator (powered by the ZigZagCore library) to scalp breakouts at volatility-filtered highs and lows.
Everyone knows stops cluster around clear swing highs and lows. Breakout traders often pile in there, too. These levels are predictable areas where aggressive orders hit the tape. The idea here is simple:
→ Let ATR ZigZag define clean, volatility-filtered pivots
→ Arm a stop market order at those pivots
→ Join the breakout when the crowd hits the level
The key to greater success in this simple strategy lies in the ZigZag. Because the pivots are filtered by ATR instead of fixed bar counts or fractals, the levels tend to be more meaningful and less noisy.
This approach is especially suited for intraday trading on volatile instruments (e.g., NQ, GC, liquid crypto pairs).
How It Works
1. Pivot detection
The ATR ZigZag uses an ATR-based threshold to confirm swing highs and lows. Only when price has moved far enough in the opposite direction does a pivot become “official.”
2. Candidate breakout level
When a new swing direction is detected and the most recent high/low has not yet been broken in the current leg, the strategy arms a stop market order at that pivot.
• Long candidate → most recent swing high
• Short candidate → most recent swing low
These “candidate trades” are shown as dotted lines.
3. Entry, SL, and TP
If price breaks through the level, the stop order is filled and a bracket is placed:
• Stop loss = ATR × SL multiplier
• Take profit = SL distance × RR multiplier
Once a level has traded, it is not reused in the same swing leg.
4. Cancel & rotate
If the market reverses and forms a new swing in the opposite direction before the level is hit, the pending order is cancelled and a new candidate is considered in the new direction.
Additional Features
• Optional session filter for backtesting specific trading hours
กลยุทธ์ Pine Script®

A13: Micro MAP Scalping StrategyA13: Micro MAP Scalping Strategy — Institutional Breakout Scalper (Pine Script v6 – Protected Source)
A completely original, professional scalping strategy developed from scratch over several months of research and live-market testing. The system is built around institutional breakout zones with a unique multi-stage validation process, strict confirmation requirements, and sophisticated risk management — all designed specifically for 1–15 minute timeframes.
Why this implementation is original and the source code is protected
The entire logic — from breakout detection to entry confirmation, multi-filter stop-loss engines, and dynamic position sizing — was built independently without relying on any existing public libraries, built-ins, or open-source code beyond standard Pine functions. The proprietary validation rules, ATR-scaled gap filtering, and layered confirmation system required extensive original development to achieve consistent performance in real-market conditions. Protecting the source code is necessary to preserve the unique edge that distinguishes this system from standard or publicly available implementations.
Core concepts and methodology (fully transparent — no code revealed)
1. Institutional Breakout Zone Detection
• Real-time identification of high-probability zones using a custom ATR-based minimum gap filter
• Zones are only considered valid when accompanied by clear price displacement and volume confirmation
• No reliance on standard Fair Value Gap or order block libraries — completely custom validation
2. Strict Dual Confirmation Entry Logic
• Entry requires one of two precise conditions:
— Confirmed pullback retest of the validated breakout zone, or
— Clean inside-bar formation fully contained within the zone
• Both conditions must align with the directional bias of the breakout
3. Five Independent Stop-Loss Engines
• ATR-based (default and recommended)
• Swing Low/High levels
• Pivot Point structure
• Trailing Stop with ATR offset
• Fixed percentage
• Every engine includes minimum and maximum stop-loss filters to prevent unrealistic risk during extreme volatility
4. Professional Risk & Position Sizing Engine
• Fixed percentage risk per trade (default 1%)
• Optional compounding mode for growing accounts
• Real-time calculation based on exact stop distance and current equity
• Full integration with leverage settings
5. Multi-Layer Filtering System
• Multi-timeframe EMA filter (default 60-period, fully customizable timeframe)
• Complete trading session control with UTC offset support
• Date range filtering for strategy deployment control
• Consecutive loss protection (optional multi-stop filter)
• Minimum/maximum stop-loss filters to eliminate low-probability setups
6. Real-Time Performance Dashboard
• Live display of win rate, net profit, maximum drawdown, total trades
• Consecutive win/loss streak tracking
• Current position size and average entry price
• All statistics visible directly on chart
Backtesting settings used in the published chart
• Symbol: BTC/USD
• Timeframe: 15-minute
• Initial capital: $10,000
• Risk per trade: 1%
• Commission: 0.04% (realistic for major brokers)
• Slippage: enabled
• Sample size: 200+ trades
These are the exact default Properties settings of the strategy.
The strategy is completely free to add and use on your charts.
#Scalping #Breakout #Intraday #Institutional #RiskManagement #ProfessionalStrategy
กลยุทธ์ Pine Script®

กลยุทธ์ Pine Script®
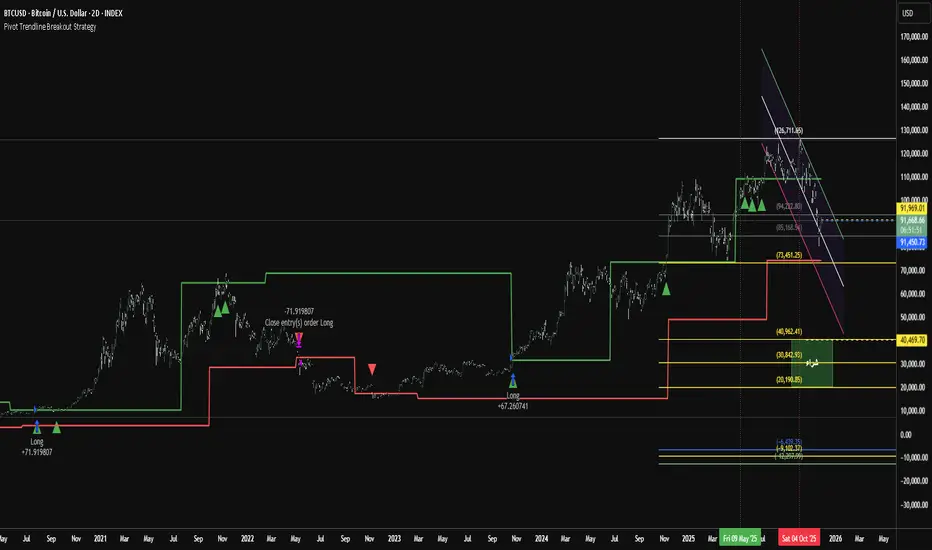
Pivot Trendline Breakout StrategyHow it works:
Long entry: triggered immediately when price closes above the green upper pivot trendline.
Exit (go flat): triggered immediately when price closes below the red lower pivot trendline.
Uses 100% of equity per trade (you can change default_qty_value if you prefer fixed size or risk %).
Works on any timeframe.
กลยุทธ์ Pine Script®