Buy and Sell Signals using EMA, Stochastic and PivotsBuy and Sell Signals using EMA, Stochastic and Pivots
Programmed to best work for short-term strategies.
Less number of signals but more accurate.
Works best on the Hourly chart with Stocks in an uptrend.
Results are tested using an initial capital of 1000.
Disclosure : I have not tested it on many stocks. Hence, please let me know your feedback so I may improvise it.
ไพวอท พ้อยส์

My Custom indicator & Strategy for trading BTC in 5min UTHello,
If your goal is to make some BTC, this script might be for you.
I tested it on the ETH/BTC Binance chart.
About the indicator :
In short, it will help you for several things :
Avoid losing BTC when the trend goes bearish.
Earn BTC during any bullish trend.
Earn BTC when the market is in trading range by bouncing off trend lines, while anticipating a new potential trend.
I based my algorithm on several technical tools such as volume, RSI, pivot, for a total of 6 boolean conditions mixed together with AND and OR gates, resulting in those entry points (shapes)
About the Strategy :
I only used long entries and exits. No shorting.
The commission rate is set to 0.05% (binance)
The backtesting results in only 40€ of net profit for a 1000€ inital capital, it may seem litle BUT during the testing period (18 days, 40 trades) the coin (ETH) dropped in BTC value ( -25% ). You make 4% while a simple Holder would lose -25%, which is 29% difference.
Since I worked hard on this script, I'll grant access to only those willing to make a small donation, that'd really help me reach my goal of making a living with trading. I will also give you any info you want and give you everything need to set up alerts. Thank you very much.

My BTC/USDT 45min Ichimoku Strat v2Improved last version by adding a RSI derivative condition, which is very effective for spotting sheep herd moves, and follow them asap.
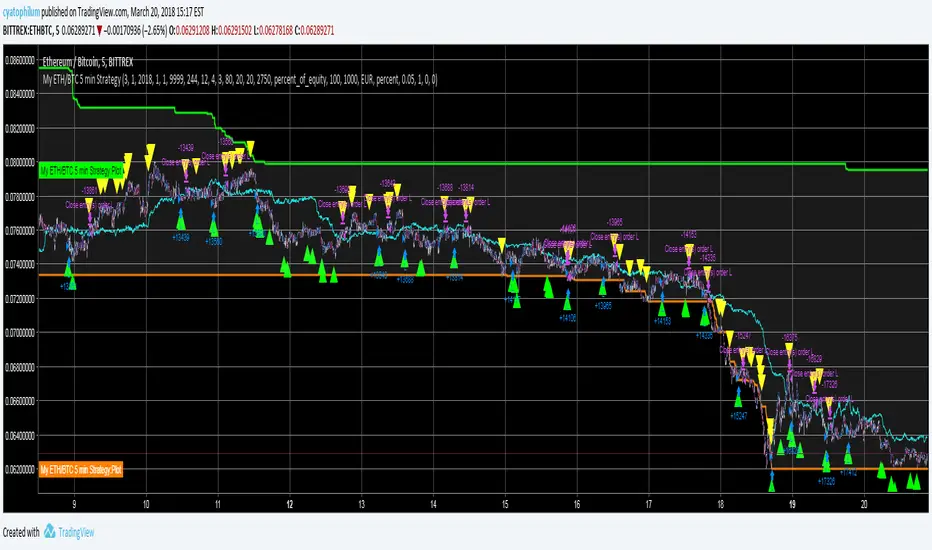
My ETH/BTC 5 min StrategyHello, beginner in trading here. Use this at your own risk.
Commission : 0.05%
Time Unit : 5 min
Backtest range : 15 days (looking like that is the maximum in 5 min UT)
Initial capital : 1000€
How it works :
Long entries and exits. That's all, no pyramiding, no shorting.
It takes the first buy signal (green triangle) and the first sell signal (yellow triangle)
The idea is to scalp while in range using stochastic, and to get out / in when a big trend appears (that is what the tunnel is for).
See the code for details.
I think those are pretty good result when we look at hueg negative buy and hold returns of this month of March. What do you think?
Cypher Core Trading Suite
Reband lol
- RSI overlay indicators (diamond shapes)
- Most commonly used MA types( i.e. SMA, EMA, WMA, VWMA, ZEMA )
- Bands
- Price Action Indicator (color coordinated)
color code:
yellow --- inside bars (breakout)
blue --- outside bars (breakout)
green --- up pin bars (reversal)
red --- down pin bars (reversal)
fuchsia --- down shaved bars (selling pressure, selling likely to continue)
aqua --- up shaved bars (buying pressure, buying likely to continue)
- Reversal candlestick patterns (only a few for now)
- Two strategies for determining buy/sell signals
1. buy/sell signals determined by EMAs crossover (better for position or swing trades)
2. buy/sell signals determined by MAs crossover (better for scalping)


Top/Bottom Strategy with advanced settingsRecommended for BTCUSD 4H.
-red arrow - sell (strong downtrend)
-purple arrow - week downtrend
-green arrow - buy (strong uptrend)
-blue arrow - week uptrend
-yellow - buy

TTM scalper indicator Backtest TTM scalper indicator of John Carter’s Scalper Buys and Sells. The methodology
is a close approximation of the one described in his book Mastering the Trade.
The book is highly recommended. Note the squares are not real-time but will
show up once the third bar has confirmed a reversal.
You can change long to short in the Input Settings
WARNING:
- For purpose educate only
- This script to change bars colors.

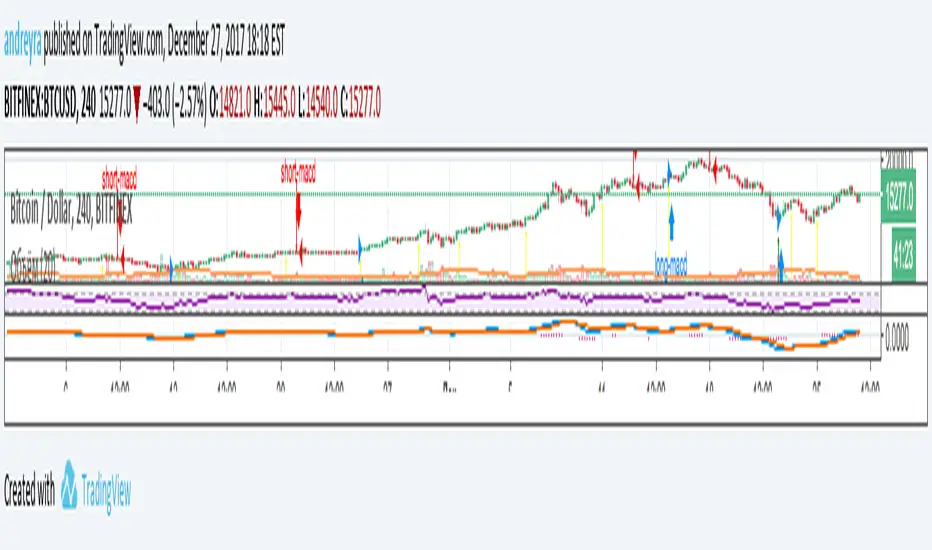
Andrey's Top/Bottom StrategyRecommended for BTCUSD -2.88% 4H.
-red arrow - sell (strong downtrend)
-purple arrow - week downtrend
-green arrow - buy (strong uptrend)
-blue arrow - week uptrend
-yellow - buy
Top/Bottom Strategy with stats v6.0v6.0
Default settings is calibrated for BTCUSD 4H.
-red arrow - sell (strong downtrend)
-purple arrow - week downtrend
-green arrow - buy (strong uptrend)
-blue arrow - week uptrend
-yellow - buy
P.S.
Don't forget to set stop-loss when you are buying at green arrow.

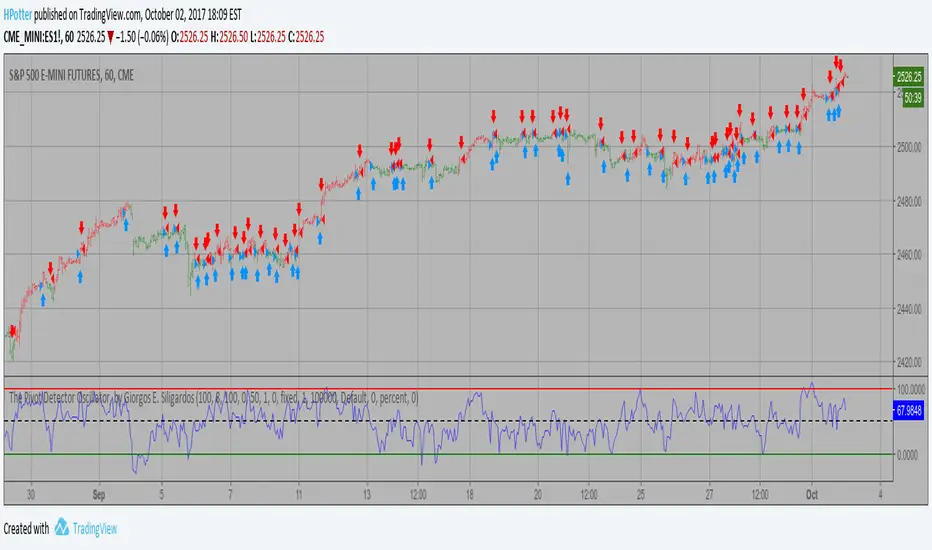
The Pivot Detector Oscillator Backtest The Pivot Detector Oscillator, by Giorgos E. Siligardos
The related article is copyrighted material from Stocks & Commodities 2009 Sep
You can change long to short in the Input Settings
WARNING:
- For purpose educate only
- This script to change bars colors.
Critical Level Hybrid Strategy (private beta)*This is a private beta version. Public version coming soon.*
-This strategy is based off the MTFCLM indicator, and Kaufman Adaptive Moving Averages.
-Perform in-depth technical analysis within seconds.
-Buy and sell signals, plus custom alert script included.
Note: To see the most accurate levels displayed on the screen, refresh your chart whenever new levels are drawn.

HMA_PPT StrategyHMA_X & Pivot Profit Taker combo
LOL!
change the settings to suit your favorite pair/TF before cry yourself to sleep.
doesnt repaint? ----> YOU TELL ME :-D


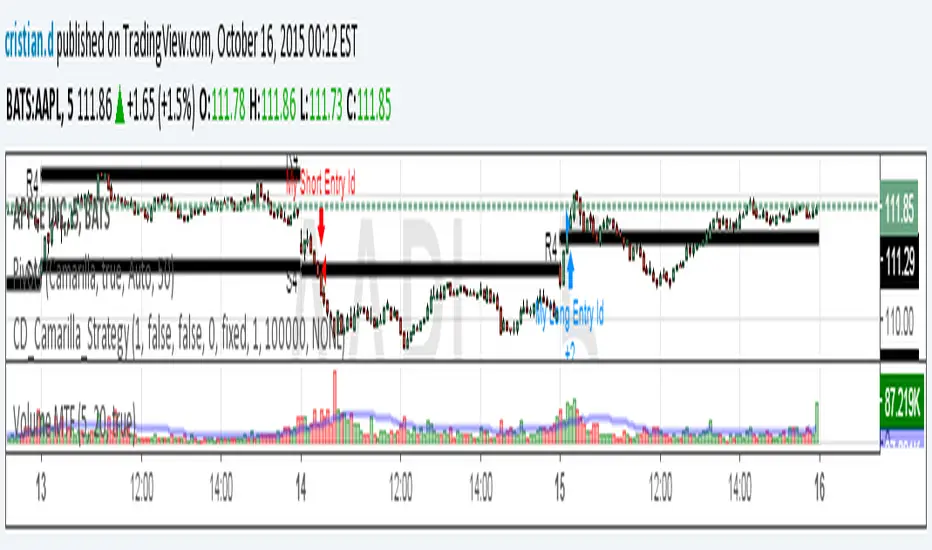
CamarillaStrategy -V1 - H4 and L4 breakout - exits addedExits added using trailing stops.
2.6 Profit Factor and 76% Profitable on SPY , 5M - I think it's a pretty good number for an automated strategy that uses Pivots. I don't think it's possible to add volume and day open price in relation to pivot levels -- that's what I do manually ..
Still trying to add EMA for exits.. it will increase profitability. You can play in pinescript with trailing stops entries..

Camarilla Strategy - breakouts of H4 and L4Breakout strategy of H4 and L4 levels. Manual entries and exits - higher profits BUT because I am a novice in pinescript,
Can someone please:
1. Show me how to add exit strategy lines : close> ema(close,3) for exit short and opposite for long. I added myself but I can't make it to work in relation to camarilla entries; instead it shows all ema crossings..
2.Why some entries over/above my pivots are not shown.. Example:11.15 AM (short) and 13.10 PM (long) AAPL, October 15, today? Today would've been 3 signals, not one..
Thank you in advance for any advice. I am a strong Camarilla follower, but I am not a coder.