ไพวอท พ้อยส์
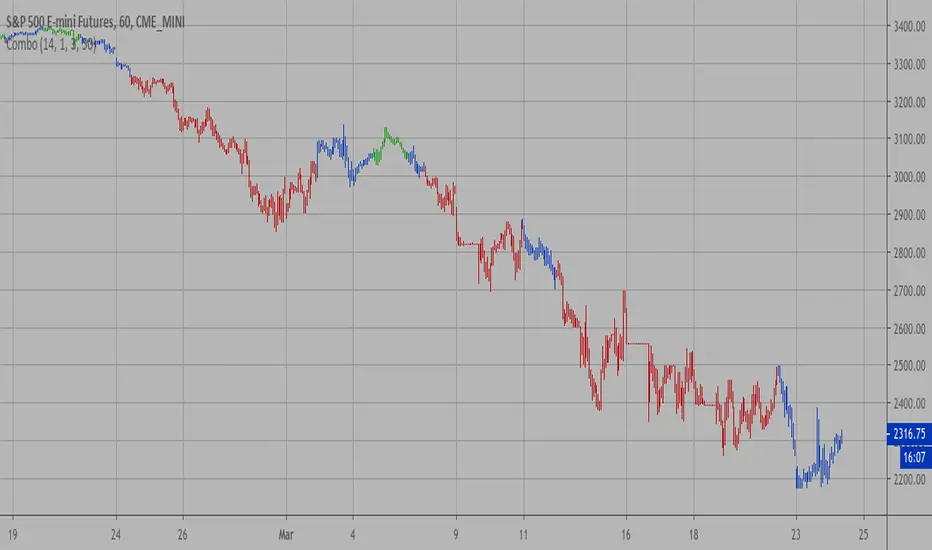
Trendbar IM This script show me iniciative move. It it based on 3, 4 or 5 candles thats contains pivot low/high and hidden gap. I use that with volume profile to confirm that the gap is really made with "big players". It shows me momentum in the market. For intraday i am using that on 1h chart and swing 4h and daily chart.

Highs & Lows of Last [x] Bars===========
Highs & Lows of Last Bars
===========
We have found this indicator invaluable over the past few years - whether you prefer to trade Crypto, Forex, Commodities or something else this indicator could prove really useful. It's always nice to know the highs and lows of the last Week or Month, the problem being the information is only really relevant at the start or end of that chosen time period; throughout the mid-section of that time period the chart will either be displaying irrelevant information or info that has been/is being re-painted. Not good!
Our Highs & Lows of Last Bars Indicator will remove this re-painting problem and display up-to-date information from higher time frames without compromising the integrity of your current chart period.
-----------
Most high & low finder indicators will use, (for example), a 'W' or 'M' as their higher TF to get HTF results - we do things just a little bit differently, it's like this:
Most other High/Low Indicators:
~ MON 1st (get high/low value from 'W' TF) ~
~ MON 8th (get new data and plot from 'W' TF)
etc. - This leads to gaps in the data, re-painting and missing lots of potential mid-week trades.
Our High & Low of Last Bars:
~ MON 1st (get high/low value from LAST 7 DAYS) ~
~ TUE 2nd (get high/low value from LAST 7 DAYS) ~
etc.
This provides a much smoother High/Low plot with more relevant information. You can clearly see areas of support and resistance, updated on the LTF chart using data from a HTF.
Because we've included 2 TF's you can use simultaneously you can see when the lower TF touches the Higher TF this (generally, but not always!) means there's a breakout coming!
Hope this is useful to you guys!
Good Luck and Happy Trading!

Trend Following MAs 3DHello All,
This is Moving Averages Trend Following 3D indicator. The idea is based on direction of MAs and relation between 20 moving averages (5 to 100 period).
Option to show different type of MAs: EMA, SMA, RMA, WMA, VWMA.
As I haved tested it looks succesful at calculating trend direction and trend strength.
For a better look I tried to make it 3D, it looks good I think, waiting comments ;)
Some screenshots:
By using RMA type:
When it gets tiny it means there is no trend:
An example for down trend:
ENJOY!

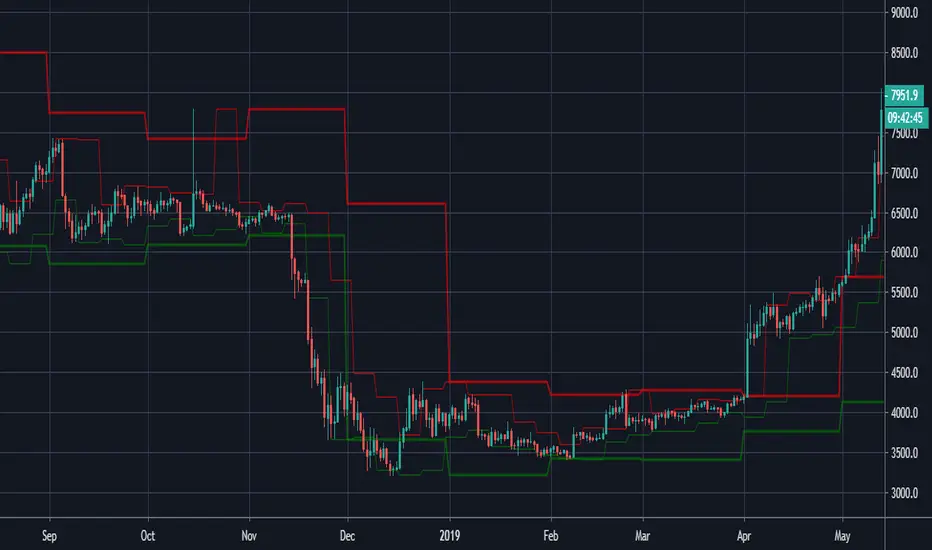
SpiralGrinder Ultimate Trading System SpiralGrinder Ultimate Trading System
SpiralGrinder Ultimate (SGU) is a unique type of Trading System dedicated for leverage-trading BTC on Bitmex platform. Since it's highly customized to give statistically reliable signals based exclusively on BTC/USD Perpetual Swaps BITMEX chart BITMEX:XBTUSD , using it with other BTC charts will give usable, but less reliable signals!
SpiralGrinder’s Ultimate first iteration was SpiralSwinger V1 indicator released in march 2019, since then much has been changed, different algos were developed and then thrown into the bin, until after 6 months of intensive work current version was developed, backtested on XBT/USD Perpetual Inverse Swap Contract chart from Bitmex exchange on whole chart history from late 2015 until January 2020, on these timeframes – 1d, 12h, 8h, 6h, 4h, 3h, 2h, 90m, 1h.
Indicator algo is based on idea of price being a so called "fractal" - when same price action patterns occur over and over from time to time on different timeframes be it 1D, 4h, 1h or even 15m! Every time a particular timeframe (TF) has suitable volatility and price action is exhibiting wave structure with distinct highs and lows there will be a situations when high probability trade setups are possible. To predict those recurrent situations SGU tracks more than 30 parameters (godmode oscillator and some it’s experimental derivatives, historical volatility coefficients, some time-based variables, ATR-based Trend lines, regular divergences… etc) comparing them against each other, so when “all stars are aligned” based on statistical model built into its algo and when price has enough potential to move in particular direction reaching some measured move target a SIGNAL to enter position is generated.
Theoretical True Winrate of this indicator is around 60%, while practical is somewhat under 50%. True Winrate is a percentage of trades that reached PREDICTED target be it 1R or 20R prediction, instead of just being a common winrate (used by most traders) - percentage of all profitable trades even though many of them didn’t reach initially predicted targets. True WinRate is tied to a signal generating algo implemented in SGU and cannot be changed unless a new more sophisticated algo is found by the developer of this indicator and is implemented in future updates!
Main User Interface of SGU consists of many elements that are developed to help manage trades more efficiently without any emotional impact on decision making process. Apart from obvious Long/Short signals there are also predicted targets that should be hit with some probability for every given signal, suggested stop loss levels corresponding to predicted RR. There are 4 ATR-based trendlines that help determine trend bias on current timeframe and to set intermediate take profit points on the way toward target, also there are indicators of regular divergences to show us weakness during uptrends and downtrends, also there are special warnings included when price closes behind particularly important ATR line with strength enough to continue further it’s movement in initial direction. Also there are 2 candle color-based systems available: one of monitoring how overbought or oversold is price on current TF, second is created to tell us overall trend sentiment - how strong is movement of price in particular direction.
Since price could move in the same fashion during prolonged periods of time there could be a particular TF when signals will be absent till price volatility and oscillator readings doesn’t change its character and become favorable (become synchronized with price action) for signals to be generated. That’s why this indicator should be monitored on multiple TFs at once – you’ll never know on which TF next signal will appear. There will be a multiple signals going on parallel at the SAME TIME, simultaneously in DIFFERENT DIRECTIONS: for example swing long trade based on signal from 12h TF, while having a scalp short at the same time based on 1h chart. Exploring this kind of optimized multi-tasking could be done only by splitting bankroll on multiple accounts registered on Bitmex platform.
Suggested timeframes to monitor for potential signals are empirically chosen that their round multiples should give 24H or 1440m=(24h x 60m) : 12h x 2 = 24h, 3h x 8 = 24h, 144m x 10 = 1440m=24h.
Therefore main timeframes are: 1D, 12h, 8h, 6h, 4h, 3h, 2h, 90m and 1h.
Additional timeframes to watch are: 288m, 144m, and 72m.
Timeframes under 1h aren’t tested yet, but could be traded with additional caution: 45m, 36m and 30m.
To track effectively all signals generated by SGU one should have at least PRO subscription plan paid on TradingView as this allows to use non-standard timeframes and maximum of 10 server-side alerts on price/indicators necessary to work with this indicator.
To do in near future: add volume weighted macd with custom settings as an additional confluence in algo to increase average win rate of signals.
Attention! Past performance of this indicator is not indicative of future results!
For those interested to dig deeper into logic behind using SGU a full 20-page pdf user manual is available for download here: drive.google.com
To gain free test access just write me a DM.

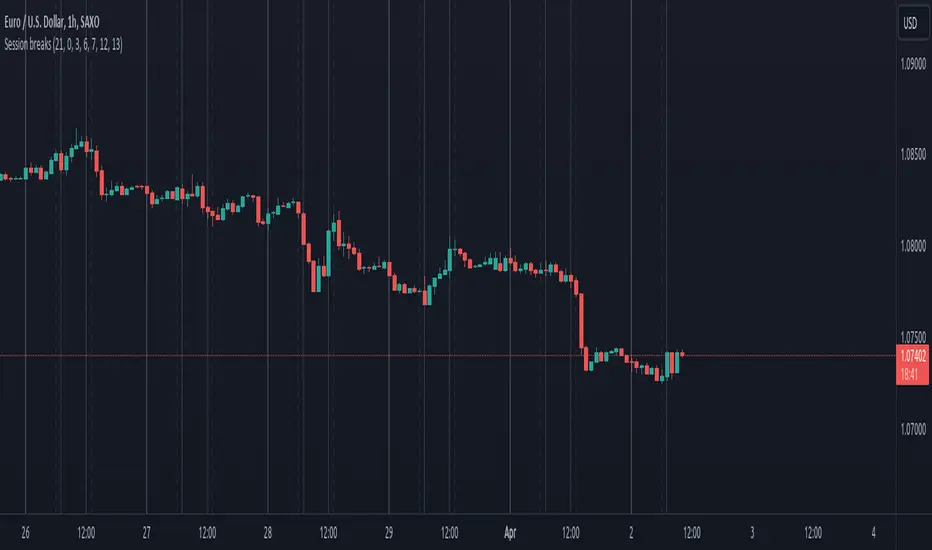
Session breaksThis indicator marks the start of each trading session around the world, starting with Tokyo at 0am UTC, London at 7am UTC, NY at 12pm and Sydney at 9pm, is non-intrusive (light gray vertical lines) and works with both UTC and exchanges' local time and handles DST / timezone offsets as well.
You can easily see that sometimes it acts as pivot-point especially on high volume.
And last, it is supposed to replace the "Session breaks" option that you can find in "Settings - Appearance" that only displays the end of session for the current exchange.
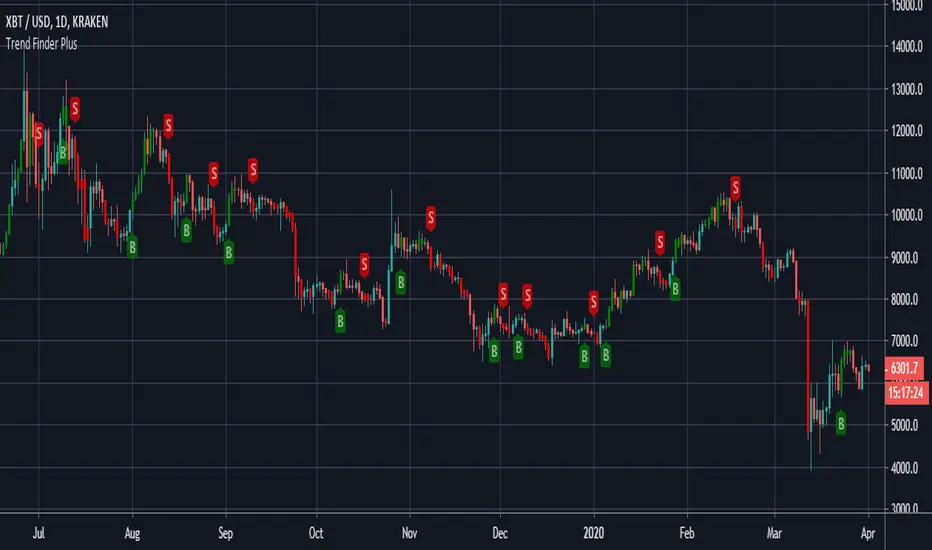
Trend Finder Plus - theCrypster===========
Trend Finder Plus
===========
A combination of various trend analysis techniques - MA's, pivotal breakouts, and Stochastics - Combined to make one super handy indicator!
-----------
Editable settings include a custom "Trend Finder" length and the usual settings for utilizing a "Stochastic RSI" .
This is a really useful tool for catching the very start of potentially bigger swings and movements - but it can get easily and display false signals during choppy periods - use with other indicators for a true sense of what can be achieved with this.
Good Luck and Happy Trading!
Areas of Support/Resistance & BreakoutA pretty little indicator showing pivotal breakouts - that is, locating critical pivot points within price action, connecting the dots and trading the breakouts from this area!
-----------
Useful for finding good entry levels, exit levels, areas of strong support/resistance and most importantly - the Breakout!
Includes "Bars to the Left" variable so you can shorten or lengthen the indicator as required.
Good Luck and Happy Trading!


Fibonacci Disciples IndicatorsThis is a set of indicators that when used together can give strong pivot points, find support and resistance levels, and includes 3 moving averages to help spot crossovers.
When price is near a defined level, you can use a low-risk entry for reversal.
When price crosses a defined level, you can use a low-risk entry for momentum.
Watch the moving averages for crossovers to identify trend changes.

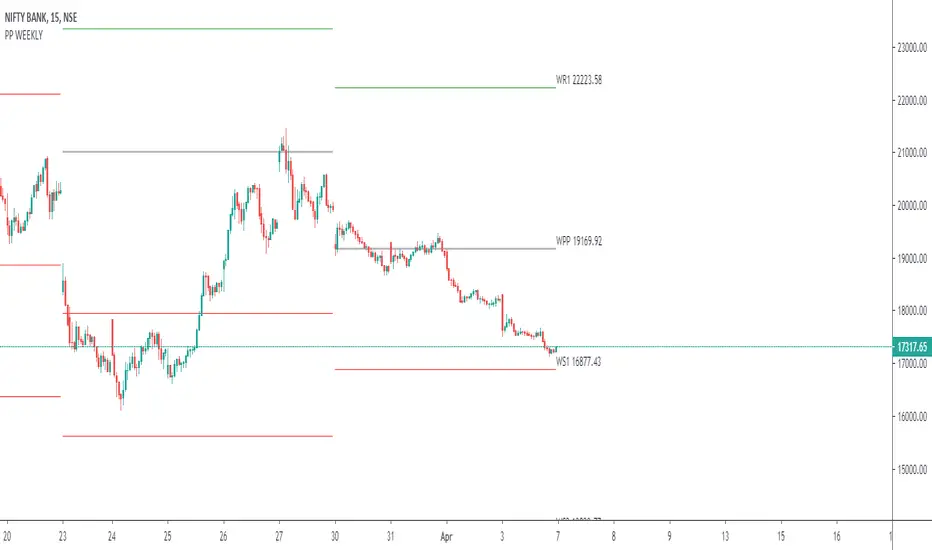
Levels Compound v.2Daily, weekly, monthly support and resistance levels. Also paints 2 different daily WMAs and the daily weekly monthly avg.

Moving High & Low (2 Time Frames)===========
Moving High & Low (2 Time Frames)
===========
A simple line set indicator displaying the highs and lows of the previous selected timeframe upon a lower timeframe chart (2 line sets available).
e.g. Displaying the Highs & Lows of the last week and/or month on the 1D chart
-----------
Useful for 2 very different approaches to trading markets -
Finding Breakout Points:
For example - When candlestick closes above or below highs from previous week/month it may be a good time to go long as if the trend continues it may well go on for a long time making lots of pips along the way!
Finding SAR points within a range:
For example - When price starts ranging within horizontal line sets that aren't moving either way too much it may be a good idea to place long/short orders at appropriate key levels dictated by these range extremities, anticipating the price to reach these levels and deflect (Stop & Reverse) back the other way.
Either way we would recommend you NOT use this indicator alone, this is very much a confirmation tool or as an aid to find key levels of support/resistance.
Good Luck and Happy Trading!
Combo Strategy 123 Reversal & Dynamic Pivot Point This is combo strategies for get a cumulative signal.
First strategy
This System was created from the Book "How I Tripled My Money In The
Futures Market" by Ulf Jensen, Page 183. This is reverse type of strategies.
The strategy buys at market, if close price is higher than the previous close
during 2 days and the meaning of 9-days Stochastic Slow Oscillator is lower than 50.
The strategy sells at market, if close price is lower than the previous close price
during 2 days and the meaning of 9-days Stochastic Fast Oscillator is higher than 50.
Second strategy
This Pivot points is calculated on the current day.
Pivot points simply took the high, low, and closing price from the previous period and
divided by 3 to find the pivot. From this pivot, traders would then base their
calculations for three support, and three resistance levels. The calculation for the most
basic flavor of pivot points, known as ‘floor-trader pivots’, along with their support and
resistance levels.
WARNING:
- For purpose educate only
- This script to change bars colors.
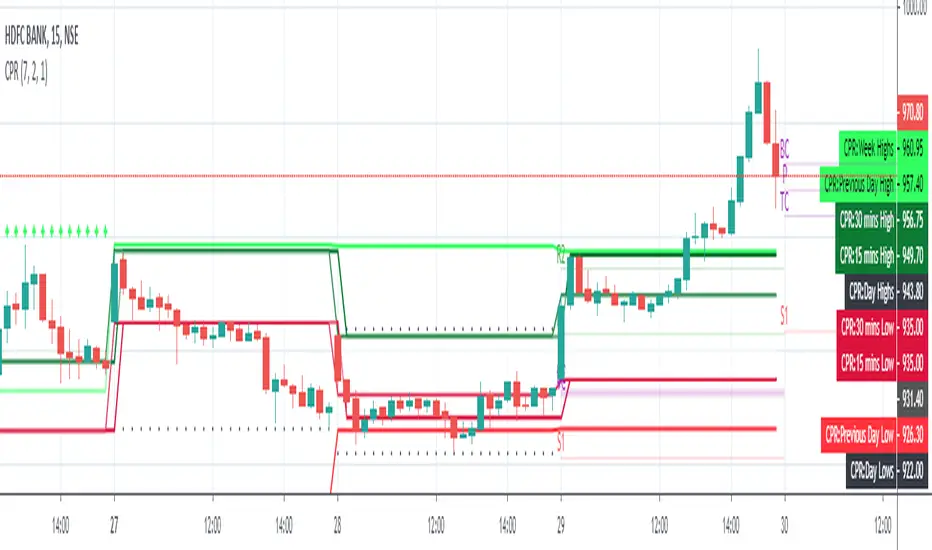
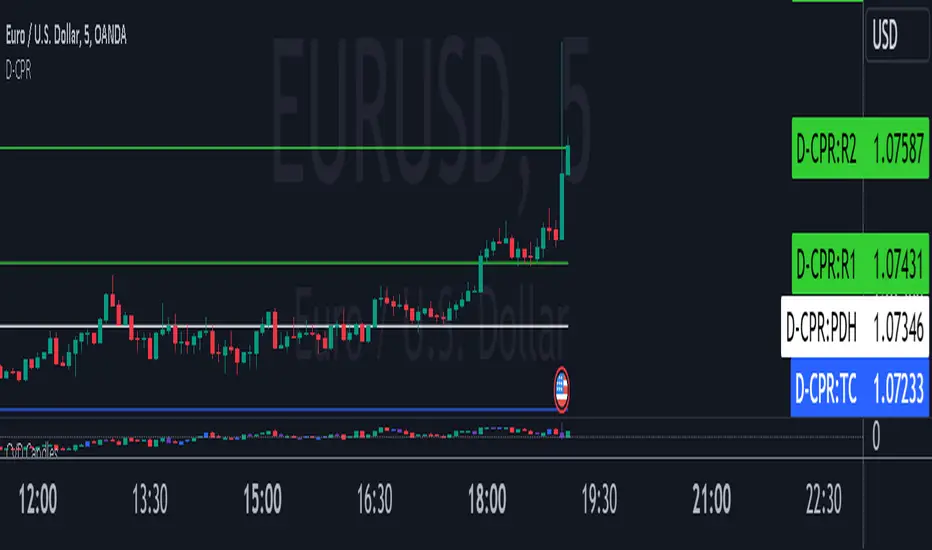
Daily CPRThis script will plot the CPR and support/resistance lines on your chart for smaller time frame so that you use them for Intraday trading. This script also plots the previous day's high (PDH) and the previous day's low (PDL).
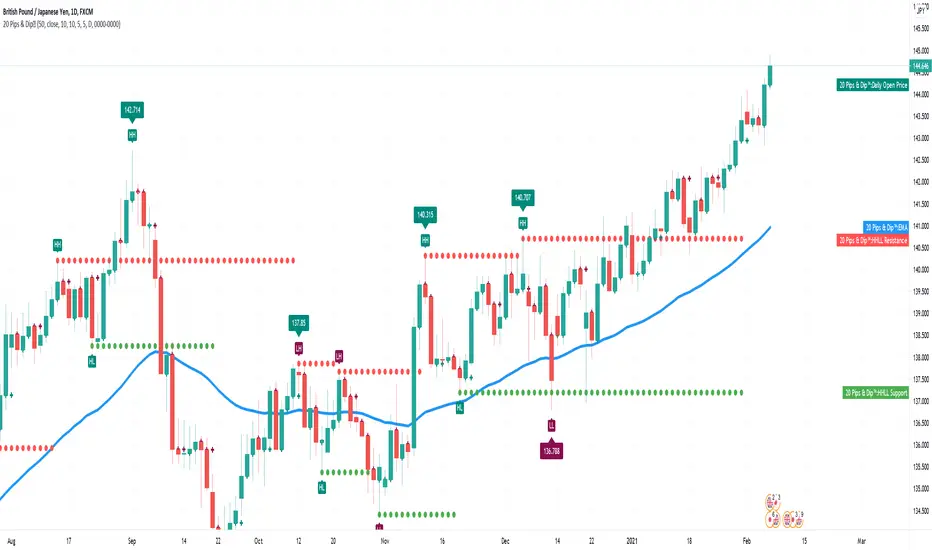
20 Pips & Dip™ Indicator20 Pips & Dipp script based on a few different indicators which together provides powerful help for all level of traders, especially beginners. Also, script have toggles to switch on/off: Renko Reversal, EMA, HHLL, Support/Resistance, Daily Open modules.
1st Module – Renko Reversal Alerts Indicator. The Indicator point out a spot where the revers are happens. Any changes in Price that do not reach a minimum amount are usually filtered. This helps to keep attention on larger, significant moves, and helps not to avoid the minute fluctuations in the market.
How it’s works?
- ENTER a trade JUST AFTER 1 Renko brick is printed. BUY triangle (green buy text with green triangle) is generated if a bearish Renko Brick is followed by a bullish brick. In other words, a buy signal happens when a white block is drawn after a black one. The buy happens then at the closing price that may be higher than the top of the last brick. It can go two bricks up minus a tick or pip.
- EXIT that trade, and open a new reverse position, just after 1 Renko brick is printed in the opposite direction. SELL triangle (red sell text with red triangle) is generated if a bullish brick is followed by a bearish brick. In other words, a sell signal happens when a black block is drawn, after a white block. The same situation as with a buy signal happens on sell signals. There is an uncertainty on the close price that may go as far as one tick above the next potential bearish block.
How to create custom ALERTS? Right click on a sell or buy triangle > Add Alert > 20 Pips & Dipp > Choose between Long or Short opportunity. In options field choose ONCE PER BAR. All other options you can choose according to your personal needs. If you want alert for another option (i.e. Short opportunity) just add one more.
Just to know! To understand how those module work better to switch to Renko chart. But Renko Chart with Renko brick size & Timeframe less than 1 day available only for PRO+ accounts and better. Also, we need to say that TradingView platform do not provide TICK data as we know. So, it may confuse you. Be careful!
2nd Module – Moving Average Exponential. The exponential moving average (EMA) is a weighted moving average (WMA) that gives more weighting, or importance, to recent price data than the simple moving average (SMA) does. The EMA responds more quickly to recent price changes than the SMA. The formula for calculating the EMA just involves using a multiplier and starting with the SMA. Like all moving averages, this technical indicator is used to produce buy and sell signals based on crossovers and divergences from the historical average. By default, our EMA have 50 period. The 50 moving average is the standard swing-trading moving average and very popular. Most traders use it to ride trends because it’s the ideal compromise between too short and too long term. Some people call it medium-term.
How to use it? EMAs are commonly used in conjunction with other indicators to confirm significant market moves and to gauge their validity. For traders who trade intraday and fast-moving markets, the EMA is more applicable. Quite often, traders use EMAs to determine a trading bias. For example, if an EMA on a daily chart shows a strong upward trend, an intraday trader’s strategy may be to trade only from the long side on an intraday chart.
Limitations of EMA! An EMA relies wholly on historical data. Many people believe that markets are efficient - that is, that current market prices already reflect all available information. If markets are indeed efficient, using historical data should tell us nothing about the future direction of asset prices.
3rd Module - Pivot Points (High/Low). Also known as Bar Count Reversals, are used to anticipate potential price reversals. Pivot Point Highs are determined by the number of bars with lower highs on either side of a Pivot Point High. Pivot Point Lows are determined by the number of bars with higher lows on either side of a Pivot Point Low. Default period is 10.
How this indicator works? The longer the trend (the higher the period selected) before and after the Pivot Point, the more significant the Pivot Point. Pivot Points can be used to help determine where to draw trendlines in order to visualize price patterns.
Calculation! Pivot Point Highs are determined by the number of bars with lower highs on either side of a Pivot Point High. Pivot Point Lows are determined by the number of bars with higher lows on either side of a Pivot Point Low.
4th Module - Higher High Lower Low indicator. Higher high and higher lows and Lower lows and lower highs are trends in a chart. Stocks in general never go up or down in linear fashion, every rise is followed by correction and then again it may either go up or down, same is true for downtrend every fall is followed by a correction in the upward direction and then new downtrend or uptrend is followed. After every rise, the stock took breather corrected to some extent and then new uptrend began, when you see the correction every low is higher than the previous lows and every next peak is higher than it’s previous peak. This is higher highs and higher lows trend.
How it’s work? This script finds pivot highs and pivot lows then calculates Higher Highs, Higher Lows & Lower Lows, Lower Highs. And it calculates support/resistance by using HH-HL-LL-LH points. Generally, HH and HL shows up-trend, LL and LH shows down-trend. If price breaks resistance levels it means the trend is up or if price breaks support level it means the trend is down, so the script can change bar colour blue or black by default. if there is up-trend then bar colour is blue, or if down-trend then bar colour is black. Support and resistance levels change dynamically.
Trick! If you use smaller numbers for Left Hand/Right Hand sides then it will be more sensitive!
5th Module - Daily Open Price. The opening price is the price at which a security first trades upon the opening of an exchange on a trading day; for example, the New York Stock Exchange (NYSE) opens at precisely 9:30 a.m. Eastern time. The price of the first trade for any listed stock is its daily opening price. The opening price is an important marker for that day's trading activity, particularly for those interested in measuring short-term results such as day traders.
Important! If daily open price was higher than current price, crosses will be red. And if daily open price lower than current price crosses will be green. Colours change dynamically.
You need to know it! An opening price is not identical to the previous day's closing price. There are several day-trading strategies based on the opening price of a market or security. Research “Gap Fade and Fill” or “Fade”.
Author – Christian Kopachelli . Huge thanks and credits to peoples which ideas, formulas, calculations, code snippets and code parts were used: Robert Nance, CryptoJoncis , FritzHaber , vacalo69 , Molle de Jong, Baris Yakut, LonesomeTheBlue , ChrisMoody , Robert N. ~~~ THANK you all! You are awesome!
DISCLAIMER! RISK WARNING!
PAST PERFORMANCE IS NOT NECESSARILY INDICATIVE OF FUTURE RESULTS. TRADERS SHOULD NOT BASE THEIR DECISION ON INVESTING IN ANY TRADING PROGRAM SOLELY ON THE PAST PERFORMANCE PRESENTED, ADDITIONALLY, IN MAKING AN INVESTMENT DECISION, TRADERS MUST ALSO RELY ON THEIR OWN EXAMINATION OF THE PERSON // OR ENTITY MAKING THE TRADING DECISIONS.
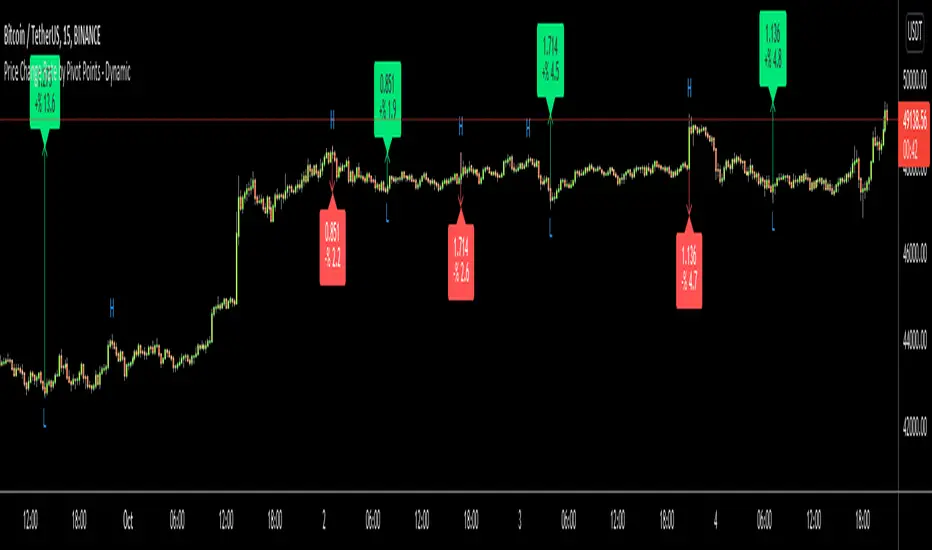
Price Change Rate by Pivot Points - DynamicHi Everyone
Usually I need Price Change info and I believe most of you need this info too. I want to see how it increased/decreased. I automate this by using Pivot Points.
it works dynamically and it uses Pivot Highs and Pivot Lows accordingly. That means it calculates which one to use.
Please watch following video:
Enjoy!
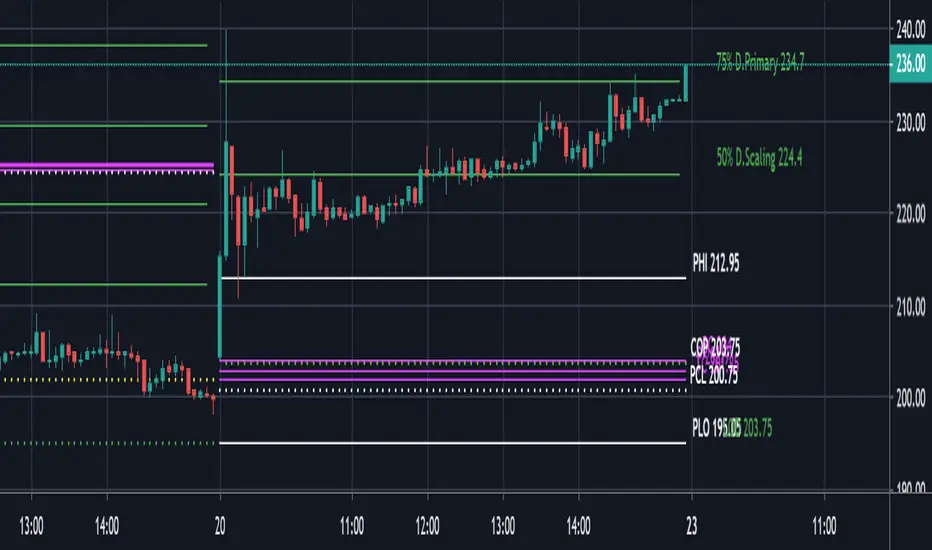
CPR, ADR and OHLCCombining my other indicators in to one useful indicator. This indicator has CPR, Pivotboss Support and Resistance, ADR Price target levels and previous session Open, High and Close
My VWAP Reversal + Pivot Points StandardThis indicator, with the addition of a standard VWAP indicator to the 5m chart, helps the operator when using a closing candle Price to initiate a VWAP Reversal strategy.
The strategy involves Price gapping up, look for a Close below the 1st 5m candle Low; else look for a Close above the 1st 5m candle High. On a break of VWAP, take the trade in the opposite direction of the gap, hence the VWAP Reversal. Not my own strat, credit to T3 Newsbeat, publicly posted on YouTube.
The Pivot Points Standard in the Pine 4 user manual, was the base source code, and leaving it here will allow me to remove the PP indicator I was using.


Breakout DetectorDetects possible breakouts (from sideways) and shows trade opportunities
the grey areas show breakout potentials (from sideways)
the red and green bars show trade opportunities
optimized for Bitcoin 1 hour

Swing Low/High Detectordetects possible swing lows and highs and shows potential trade opportunities
the red and green areas show potential swing lows and highs
the red and green bars show potential trade opportunities
optimized for Bitcoin 1 hour

Intraday tool by Abhi this indicator with the following values!
Previous day Open, High, Low & Close Prices
Today CPR Levles
Today Camarilla Levels
First 5 Minutes Candle High & Low
Today Open Price
All of you know the CPR & CAMARILLA levels will work as a Major Support & Resistances
If you are using CAMARILLA levels L3 & H3 are the major SUPPORT & RESISTANCES
If you are using CPR then the CPR , TC & BC are the major level to use !
Today's open price is very very important that, at which level the market opened either SUPPORT level (or) at RESISTANCE level
rules
► If the open price nearer (or) at L3 it will try to reach H3 (or) atleast (H3+L3/2)
► If the open price nearer (or) at H3 it will try to reach L3 (or) atleast (H3+L3/2)
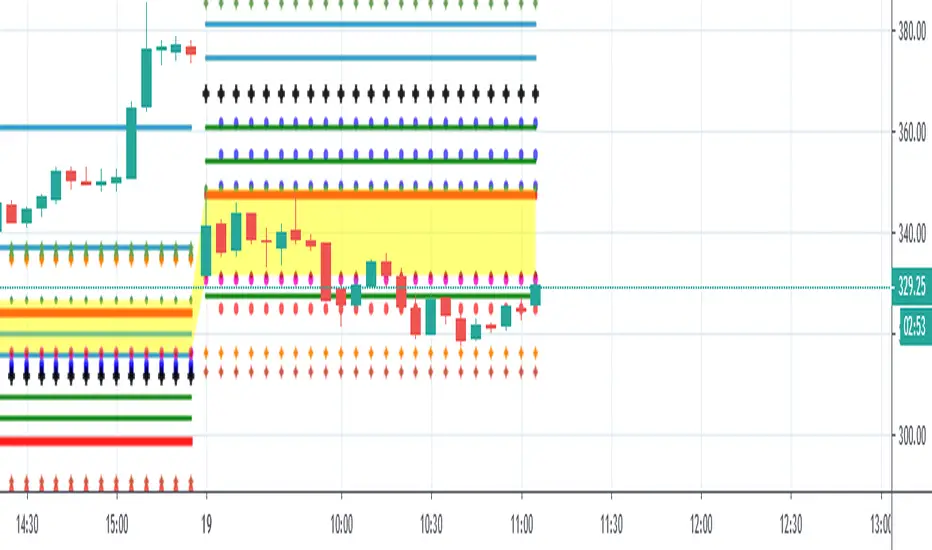
Pivot CPR by AnandI have included the following in this script which we can include all five in a single indicator.
============================
1) PIVOT POINTS
2) CAMARILLA PIVOTS
3) Opening Price
4) Previous Day High
5) Previous Day Low
You can SHOW (or) HIDE any one in the list !
Thanks,
Anand J.