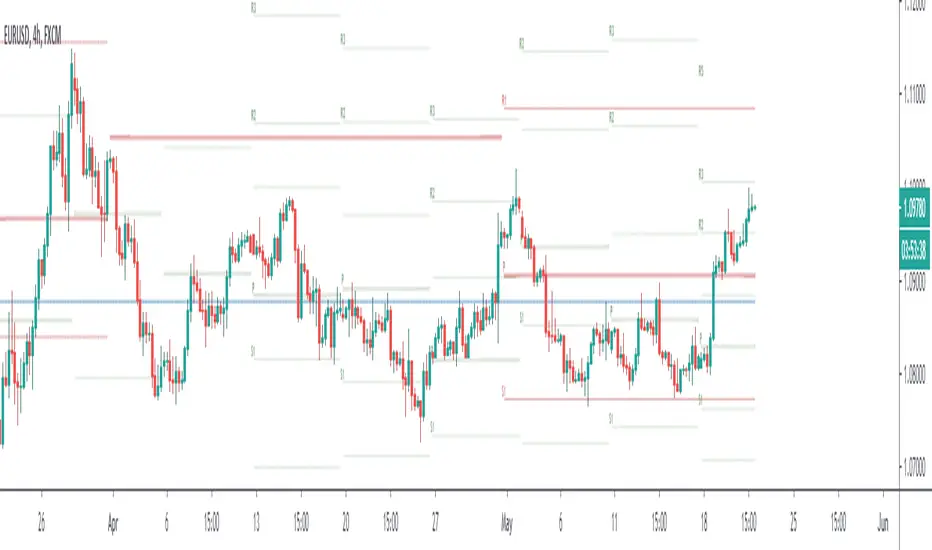
Multi-Timeframe Pivot PointsThis is a MTF pivot point indicator. I was unhappy with the standard pivot point indicator in Trading View as I wanted to be aware of how price was interacting with pivot points on a higher timeframe. For example, if I'm on the 1H time frame looking at daily pivots, I want to be sure that my trading plan to move between these pivots does not contradict what price is trying to do in relation to the weekly pivots. In addition, sometimes daily and weekly pivots will align increasing probability of a bounce
Ultimately its about trying to automate as much as possible to quickly have an awareness of what might be happening on the timeframe above without having to manual enter levels.
I concluded I don't like the results of this script - whilst i clearly see price interacting with pivots on the current timeframe and higher timeframes there is too much screen clutter on the screen for me.
Rather than delete the script I thought I'd make it available for other people to use. I hope its useful to people. Good luck
(For the record it actually takes a little thinking outside the box to make so many pivots display - you can't just plot hlines. If your a pinescript geek you might like the code)
ไพวอท พ้อยส์
Automatic Fibonacci Pivot Point S/R LevelsThis is a great tool to find confluences between Fibonacci Pivot point on various time frames.
Fib Pivots used
23.6%
38.2%
50%
61.8%
76.4%
100%
127.2%
141.4%
161.8%
200%
If price is between two levels on the update the lines shift
Yearly Pivots shown on 1m - Daily timeframes
PIvots recalculate on every day
Monthly pivots show on 1m - 60m timeframes
Pivots recalculate every hour
Weekly pivots show on 1m - 15m timeframes
Pivots recalculate every 30m
There is a lot of code but it got the job done.
It would easy to interchange if you prefer different types of pivots
It would be easy to add an on/off if you dont want so many levels on your smaller time frames
If anyone can streamline it please do

CAMZONECamrilla Pivot with Targets. Existing built in standard pivot does not calculate Target levels. This goes back only 5 periods compared to standard pivots where we can provide the input.
Some color coding have been added to give me added clarity.

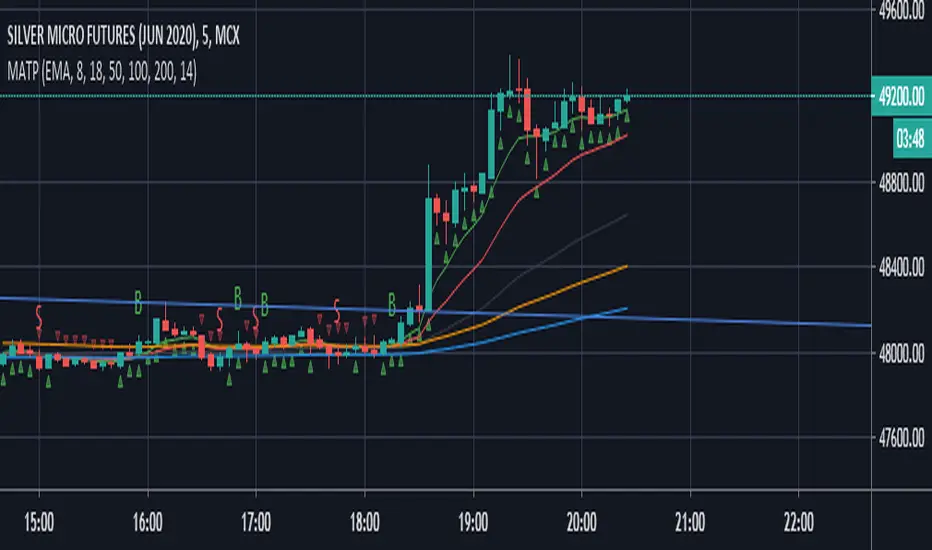
MATP, Moving Average Trend predictorMATP prepared based on moving average lines to predict Short term, mid term and long term trends. B for Buy and S for Sell character printed to take position based on short term and long term trend lines .
Call: Take Long (B) or Short (S) position when respective Char printed.
Please do tune indicators values from setting based on your script to get accurate call.
Happy Trade
By
Gops
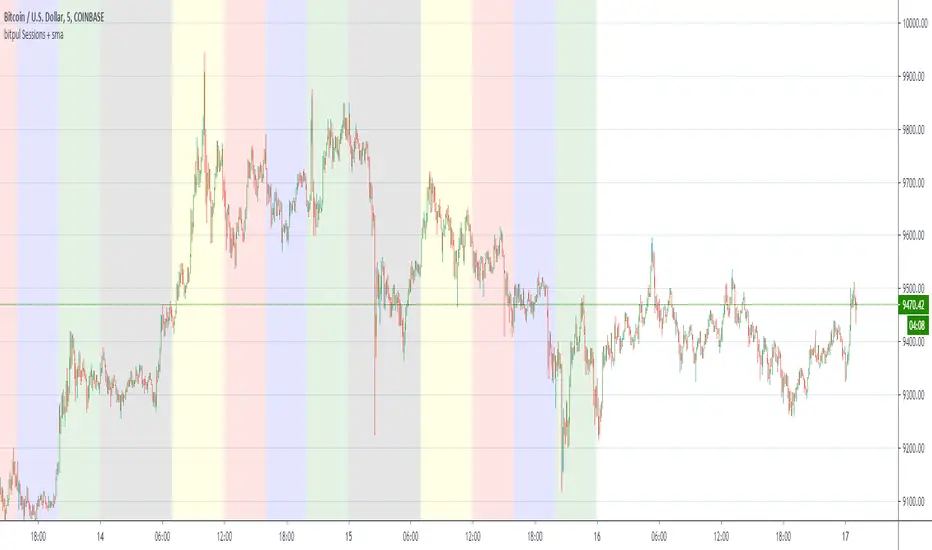
bitpul Sessions + sma [MHMK]Background colors that show open-close of the major market sessions ( Tokyo, London, joint time, New York, free time).
I added two sma to get more confirmation for the reversal - You can hide smas
PRP - Pivot Reversal + PSAR Alerts [QuantNomad]This is study with alerts for my "PRP - Pivot Reversal + PSAR Strategy".
When creating alerts - choose "Once Per Bar Close"
It's a pro indicator, you can have access to it for a small fee. Link to my PRO indicators you can find in my signature.

Daily and Fibo Pivots© ForexPipCheats
This indicator is coded to run on Trading View which was originally created by traderathome (TAH), qFish, and all other respective contributors for the mt4 version.
Daily Support & Resistance Pivots
You can select to display the support and resistance pivot lines (SR) using either the Daily or Fibonacci formulas.
The Fibonacci displays five levels.
Normally, the Daily displays only three levels but is extended to include five levels.
Due to the short TF it displays, the indicator would only appear on TF 1H and below.

Camarilla Pivot Points V2 Strategy Camarilla pivot point formula is the refined form of existing classic pivot point formula.
The Camarilla method was developed by Nick Stott who was a very successful bond trader.
What makes it better is the use of Fibonacci numbers in calculation of levels.
Camarilla equations are used to calculate intraday support and resistance levels using
the previous days volatility spread. Camarilla equations take previous day’s high, low and
close as input and generates 8 levels of intraday support and resistance based on pivot points.
There are 4 levels above pivot point and 4 levels below pivot points. The most important levels
are L3 L4 and H3 H4. H3 and L3 are the levels to go against the trend with stop loss around H4 or L4 .
While L4 and H4 are considered as breakout levels when these levels are breached its time to
trade with the trend.
WARNING:
- For purpose educate only
- This script to change bars colors.
Zig Zag High LowZig Zag script that uses local minimums and maximums as pivot points. It can be used as a source for pattern recognition.

[Daveatt] BEST Trade Manager Pivots 1.0Hello BEST traders
The BEST Trade Manager got upgraded with many more features
This version allows setting automatically the TP levels on either Fibonacci/Traditional/Camarilla/Woodie pivots
I. 💎 SCRIPTS ACCESS 💎
1. Available only with one-time payment on my website.
2. My website URL is in this script signature at the very bottom (you'll have to scroll down a bit and going past the long description) and in my profile status available here: Daveatt
3. Many video tutorials explaining clearly how all our indicators work are available on your website > guides section.
4. You may also contact me directly for more information
II. 🔎 What is the BEST Trade Manager?🔎
2.1 Concept
The BEST Trade Manager is compatible with any indicator.
Once connected, it adds another layer of good stuff with real-time user custom defined stop loss (8 available options), take profits (4 possible options) + alerts compatible for trading automation.
2.2 How hard is it to update your indicator?
We'll send to our customers, a comprehensive and easy tutorial, to make any indicator compatible.
I guarantee you, it should take no more than 2 minutes per indicator. We made it easy, fun, and awesome. #bolder #statement
III. The amazing benefits of our Plug&Play system
I hope you're ready to be impressed. Because, what I'm about to introduce, is my best-seller feature - and available across many of my indicators.
The BEST Trade manager can be connected to any external indicator
Let's assume you want to connect your RSI divergence to your Trade Manager.
I mentioned an RSI divergence but you may connect any oscillator ( MACD, On balance volume, stochastic RSI, True Strenght index, and many more..) or non-oscillator (divergence, trendline break, higher highs/lower lows, candlesticks pattern, price action, harmonic patterns, ...) indicators.
THE SKY IS (or more likely your imagination) is the limit :)
We go in-depth on our website why the Plug&Play is an untapped opportunity for many traders out there - URL available on my profile status and signature
IV. 🧰 Features 🧰
Candles can be colored to highlight the trend direction better [/b [
4.1 Stop-Loss Management
For what's following, let's assume that 2 is the stop-loss value you inserted in the indicator, and the Algorithm Builder gives a BUY signal.
This is NOT a recommendation at all, only an example to explain how this feature works.
- %Trailing: The Stop-Loss starts 2% away from the entry price - and will move up (because we're on a BUY trade as per our example) every time your trade will gain 2% profit
- Pips Trailing: Same as above but using a distance in pips/USD value
- Percentage: The Stop-Loss stays static 2% away from the entry price. There is no trailing here
- TP Trailing: Trail your stop-loss every time a Take Profit level is hit
- Supertrend: embedded supertrend use as a trailing stop
- Fixed: Set the Stop-Loss at a fixed position (value should be in currency/units)
- ATR multiple: Set the Stop-loss at a multiple of ATR
- External connector: Let's say your indicator already contains embedded stop-loss levels, you can add them in the Trade Manager
4.2 Take Profits Management
You can manage up to 3 take profit levels defined as a percentage or price value or ATR multiple.
The expected input is in percentage value (for instance, setting the % target of TP1 to 2% will set the TP1 level 2% away from the entry price
This version allows setting automatically the TP levels on either Fibonacci/Traditional/Camarilla/Woodie pivots
4.3 Built-in Risk-to-Reward Panel with real-time analytics
The good stuff doesn't stop here.
You'll notice that this sometimes green (when in a LONG), sometimes red (when in a SHORT) panel at the right of your chart.
- Entry Price: the price when the Algorithm Builder will give a signal.
- The Trade PnL in percentage.
- Entry Stop Loss: Distance (in currency/units) between the selected stop-loss algorithm (percent, trailing, TP trailing, etc.) and the entry price.
- Entry TP1/TP2/TP3: Distance (in currency/units) between the entry price and the first take profit
- Risk/Reward TP1/TP2/TP3: Using the Stop-loss distance at entry, and Take Profit 1/2/3 at the entry to compute the risk-to-reward ratio.
- Max drawdown and Max opportunity (value and percentage): respectively the maximum loss and maximum win per trade
For more details, please check the guides section of my website. Links are in my signature and profile status.
V. 🔔 Alerts 🔔
We enabled the alerts on the:
1. Stop-Loss hit
2. Take Profit 1/2/3 hit
3. custom hard exits based on either MACD / RSI divergence/ MM cross
5.1 🤖 Compatible with trading bots? 🤖
It's compatible with all third-parties out there capturing alerts and forwarding them to the brokers.
We enabled TradingConnector and ProfitView alert templates so far.
If you have any doubts or questions, please hit me up directly or ask in the comments section of this script.
BEST regards,
Dave

Murrey Math Lines with labels updated the script from @ceyhun and added labels for reference...
For high probability setup pair it with higher timeframe (30 min, 60 min) and 5 min for support and resistance and use price action to go long or short... For more info on how to trade these lines you can search forexfactory . It is uncanny how these lines react to prices. Need to explore more on this subject...

Camarilla Pivot Points V2 Camarilla pivot point formula is the refined form of existing classic pivot point formula.
The Camarilla method was developed by Nick Stott who was a very successful bond trader.
What makes it better is the use of Fibonacci numbers in calculation of levels.
Camarilla equations are used to calculate intraday support and resistance levels using
the previous days volatility spread. Camarilla equations take previous day’s high, low and
close as input and generates 8 levels of intraday support and resistance based on pivot points.
There are 4 levels above pivot point and 4 levels below pivot points. The most important levels
are L3 L4 and H3 H4. H3 and L3 are the levels to go against the trend with stop loss around H4 or L4 .
While L4 and H4 are considered as breakout levels when these levels are breached its time to
trade with the trend.
WARNING:
- For purpose educate only

Complete Pivot RangesI forgot what book I read this from. But basically a successful trader would create a range using the open/high/low/close of the previous day, and the high/low of the previous day.
I created the indicator from the book, but also added a few other pivots to it. You can hide the ones you don't need in settings.
He also mentioned that the resistance of this area is a lot like a samurai and armour, and that if price falls through the pivot, it will fall faster. Just like a sword that penetrates armour will go straight through your body.
Green = half day pivot. :: I've noticed price can be rejected from these areas against the trend during the day
Blue = daily pivot. :: My favourite. You can see how the trend is going by checking how it steps. There is good value in putting orders on in this range, especially when price is touching a 50 ema on the 15 min chart.
Red = 5 day rolling pivot :: collects the open/high/low/close of the last 5 days and makes a daily range with them. Best used with 50ema on the hour chart. The book used a 3 day rolling pivot but I find this more useful.
Yellow = 5 week rolling pivot :: like the red rolling pivot above but using the last 5 weeks. Best on 4 hour chart.
As with all indicators see if it can give you value and if it's right for your trading.
Cheers
Candlestick Pattern Detector - Aitch-TThis script detects the following candlestick patterns:
Bullish Patterns:
- Normal 3 Bar Fractal
- Enhanced 3 Bar Fractal
- Engulfing
- Harami ( Inside bar )
- Bullrami (Altenate Bull Harami)
Bearish Patterns:
- Normal 3 Bar Fractal
- Enhanced 3 Bar Fractal
- Engulfing
- Harami ( Inside bar )
- Bearami (Alternate Bear Harami)
- Shooting Star
How it works:
- When you add the script to your chart, green and red dots will appear at the top and the bottom of the chart.
- Red dots at the top of the chart point out the candles that have completed a bearish pattern .
- Green dots at the bottom of the chart point out the candles that have completed a bullish pattern .
How to use:
Use it in conjunction with other analysis tools ( Fibonacci Retracements, Histogram, Willy, RSI , volume , etc) to determine high probability levels.

Whale alertThe purpose of this indicator is to detect when whales are around and draw a vertical line on hourly chart. But how do we detect them? By analyzing behavior. Usually whales scale in/out of positions a few days in a row and they also trade at the same time every day, because they are whales and don't care, they can move then market whenever they want.
Based on the above assumptions, this indicator checks:
1. hourly volume, it has to be 3 x the MA(volume) for last 14 days (of course 3 and 14 are configurable in settings and need to be tuned individually for each pair)
2. the same hour of the day (10am UTC) for the past 3 days looking for #1 condition.
We can easily see on chart that a whale was present at 10am UTC for two days in a row, they went short yesterday and long today (May 6th). Also, we can zoom out and see the same whale traded at 10am many times in the past.
Can't wait for 10am tomorrow and watch out, whales are around :)

Camarilla Pivot Points Strategy Pivot point studies highlight prices considered to be a likely turning point
when looking at values from a previous period, whether it be daily, weekly,
quarterly or annual. Each pivot point study has its own characteristics on
how these points are calculated.
Red color = Sell
Green color = Buy
WARNING:
- For purpose educate only
- This script to change bars colors.

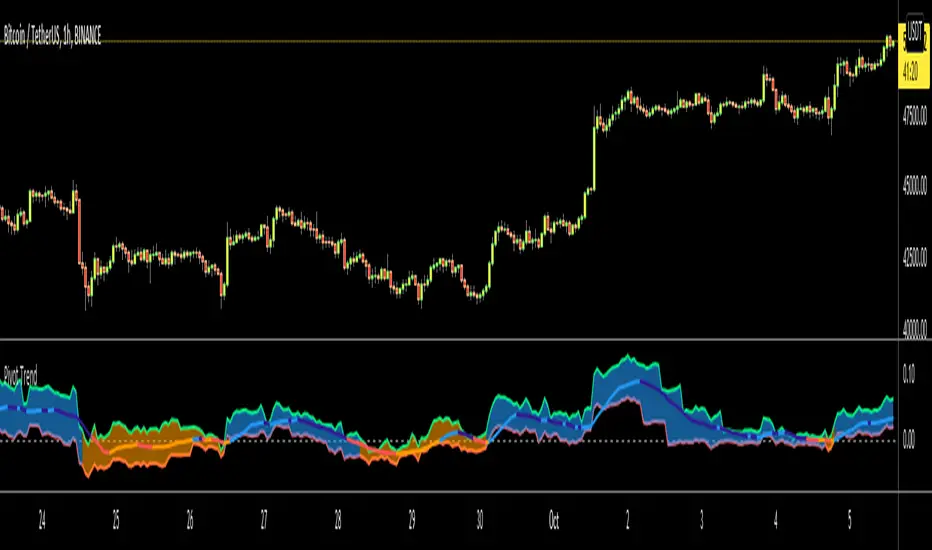
Pivot TrendHello Traders,
Another original idea is here with you. Actualy I can say that it's a breakout strategy that uses multiple Pivot Point's averages.
How it works?
- it finds the Pivot Points, you can set the length as you want
- it gets averages of Pivot Highs and Pivot Lows, you can set the number of Pivot Points to be included
- it compares the current closing price with averages of Pivot Highs and Pivot Lows
- if both are positive or negative then trend changes
You have two options:
- Pivot Point Period => is the length that is used to find Pivot Points. means it checks left/right bars if it's Pivot Point (4 by default)
- Number of PP to check => is the number of Pivot Points that the script finds and calculates the averages (3 by default)
An Example with the settings Pivot Point Period = 5 and Number of PP to check = 2
Play with settings as you wish. Comments are welcome, together we can improve it ;)
Enjoy!
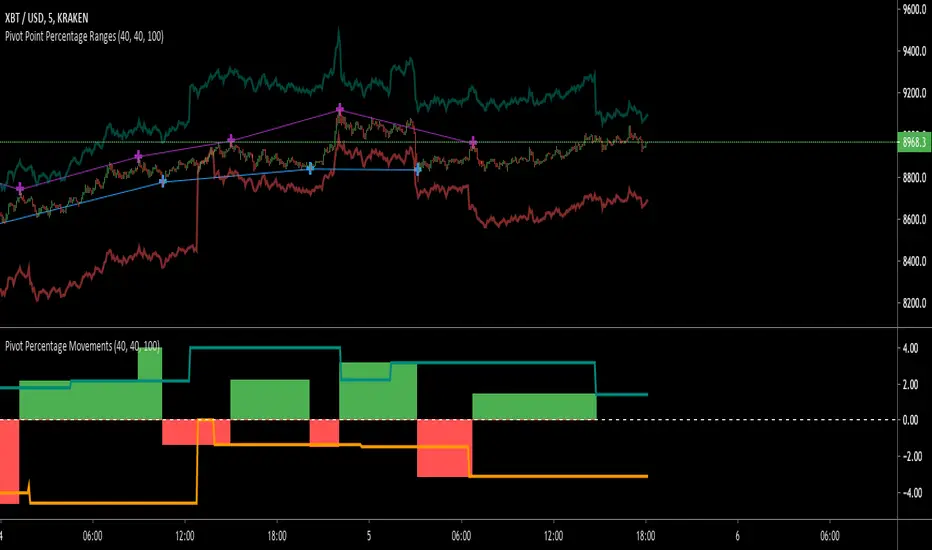
Pivot Point RangesThis script is meant to be a partner script to my Pivot Points Percentage Differences () indicator. It can be used to verify the percentages are what they should be, and give you a visual range in which to trade in.
If you have any questions please feel free to ask!
ORB- Range break outThis script has below features
> Option to choose the bar number for considering break out
> Option to choose the targets based on the candle size
> Option to choose the budget and based on that it will show the quantity to trade
> SL is the candle range
> Can use it in any time frame

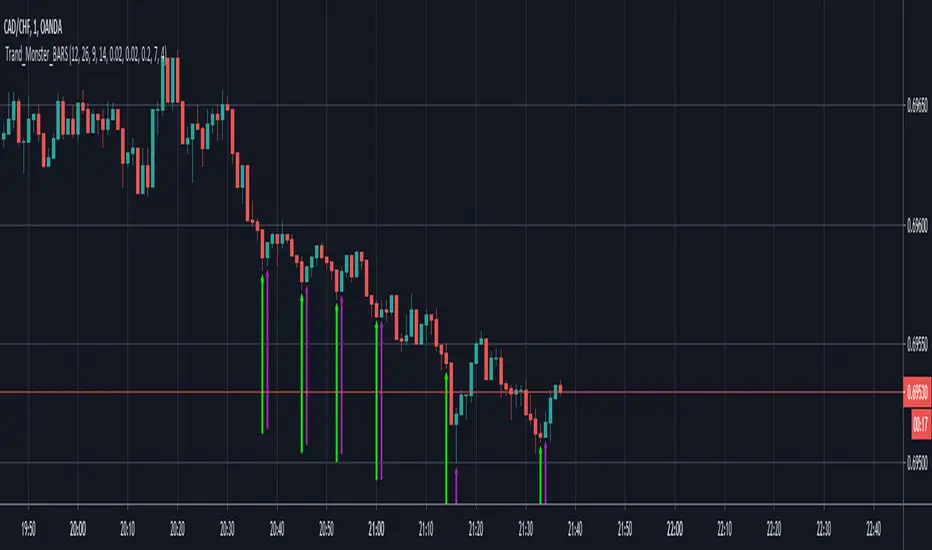
Pivot Points Percentage Differences (W/ High & Low Indicators)This script is really handy for day trading. This works best on low time frames like the 1 minute or the 5 minute .
To understand what pivot points are you can add other pivot point indicators or just look at the color differences below since every-time that changes it's a new pivot point (which represents a known low or known high with high certainty)
The script shows the most recent percentage move up or down for the last known pivot point based on the pivot point setting data.
Pivot points are generated after 20 bars go by default, but you can set this to whatever you wish in the settings . Just click the gear icon for the script to set these.
You can also set how many bars back to look for what was the last highest percentage move (down or up). This will be important for your day trading strategy.
The idea to trading with this is pretty simple.
You look at the highest percentage moves that were made on pivots up or down and if you notice a current move that has trended down or up to the highest percentage, that makes that a safer bet for shorting or longing.
Of course, sometimes, things move greater or less than normal, so you would set stop losses accordingly.
Hope this helps with your day trading for finding good entry and exit points!
EXAMPLE TRADE SCENARIO
You notice the last high for the last 100 bars was 3% . The price recently rose 3% from a known pivot low. You can put a short on this. You noticed that the average price down was 2% , so if the price drops 2% or close to it you can exit your short and go LONG . You set a stop loss above what you put by an extra percentage to be safe.
I will do an experimental strategy version of this idea if people are interested.

Dual_Spread_FTX[Schmittie]//This script displays 2 spreads between FTX perpetuals contracts and futures contracts.
//In the settings, you can choose which curves to display for direct comparison.
//It is based on Thojdid's Multi-Spread script, but loads faster as there are only 2 coins
//An high-low range can be added

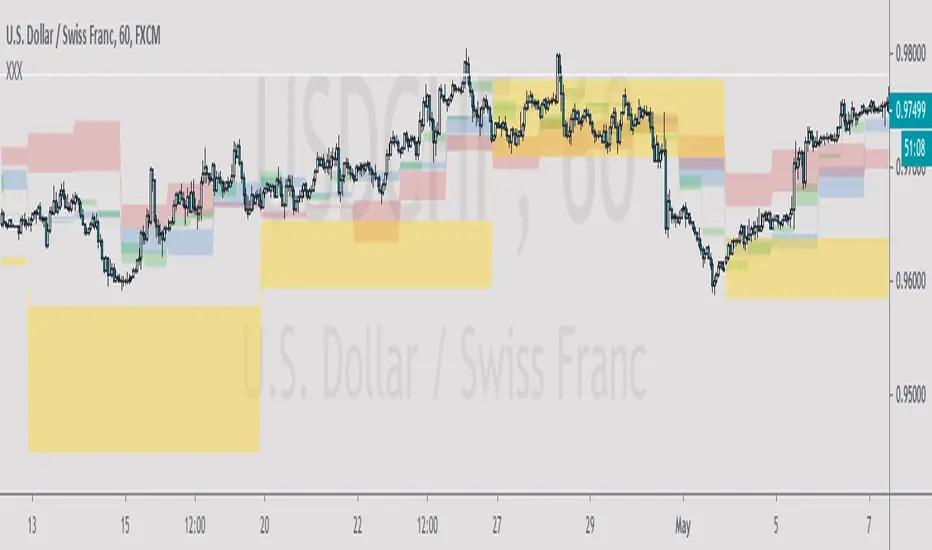
Support and Resistance Multi Time frameSimple indicator showing the support and resistance on Daily, Weekly and Monthly time frames no matter what time frame you're currently on by highlighting the highest and lowest points on each over the last 34 bars.
Daily support and resistance are coloured green.
support and resistance are coloured yellow.
Monthly support and resistance are coloured red.
For best results check where multiple support and resistance areas line up and combine with another indicator for example oscillators to gauge if the support or resistance will reverse the market.
