Tweezers and Kangaroo TailHello Traders,
Here Tweezers and Kangaroo Tail script is in your service. The script searches for Tweezer / Kangaroo Tail candlestick patterns and shows them as T (Tweezer) and K (Kangaroo Tail). Thanks to RorschachT who game me the idea and some details while working on this script.
What are these candlestick patterns?
Tweezers :
- A tweezers pattern occurs when the highs/Lows of two candlesticks occur at almost exactly the same level
- Both candles must have wicks
- Bigger Wick / Smaller Wick rate should not be greater than 150% ( 150% by default and you have option to change it)
- First Candle must be highest/lowest for last 5 candles (5 by default and you have option to change it)
- The level of High for Top, Low for Bottom must be almost lower than 20% of the bigger wick of tweezer candles (20% by default and you have option to change it)
- The Candles can be right next to each other or apart but not more than 12 candles apart (12 by default and you have option to change it)
- You will see that Tweezers pattern occurs frequently
Kangaroo Tail:
- Looks almost like a Hammer or Inverted Hammer candle
- They have both its open and close in the top or bottom third of the candle
- There must be some space/room on the left of the kangaroo tail
- The open and close of the Kangaroo Tail candle must be inside the range of the previous candlestick
- The next candle should create a new high or new low
- You have several options to set details about the "Room" that should be on the left and also options for Wick/Body rates
- You can see example below
You have option to enable/disable any of these patterns.
as far as I have tested they are strong reversal patterns but none of the indicators or patterns may not be enough alone. so you should confirm the signals using other indicators or tools
If you need more information you can find a lot of info on the net ;)
Example: Tweezers - Aparted
Example: Kangaroo Tail - Bullish
Enjoy!
ไพวอท พ้อยส์

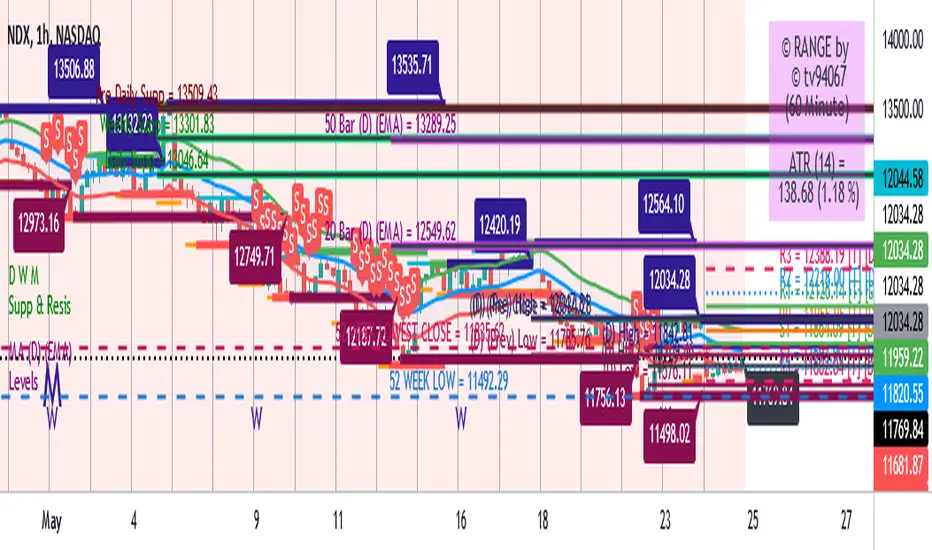
Range support and resistanceWelcome all
==========
This script specially is for Kunal Saraogi Senani Traders and beginners.
.
With this script you can find support and resistance for input range on any time-frame chart.
You need not draw line by own. You just input your desired range and this script will do your work automatically.
You can adjust range according to your choice.
Also have an option to select range source which help you to find support and resistance on the basis of close price or high/low of input range. Default range source is close price.
.
Latest support and resistance value labels also display on the chart.
.
To use this script, add to favorite and apply on chart.
.
Feel free to comment your suggestions.
.
Thanks all
Gann Toolbox V2// ========================================================================//
This script is meant to help you save a lot of time plotting your Gann Boxes and Cycles correctly and accurately.
This is a recoded version of "Gann ToolBox V1.5/1.7"
This script allows you to scale your boxes and square them with a simple input in the script's settings "$ per degree".
It includes a few default cycles already built into it ( March and September ) and an advance mode that lets you place the box anywhere you want and create your own custom cycle. through any time period you want.
You get the 1:1, 1:2, 2:1 Gann fan angles at each corner of the box and some additional angles at the midpoint to give you a complete star formation.
Using the Advance mode you can also adjust the length of your custom cycle and the global height increments. Default is 360degrees.
You can also play with the offset values for your cycles.
That's not all, you also get to plot your horizontal lines between each cycle at an increment of your choosing.
Using this script you will be able to plot any cycle that you want with a few clicks & and a few seconds.
in the advance more you could extend the advance custom cycle to engulf future price action.
This script work with all the assets correctly and beautifully from Stocks to Crypto-Currencies.
// ========================================================================//
This script comes with "Gann Seasonal Dates, Gann Planets vs Sun, Moon at Zero" as addons if you decide to purchase it.
// ========================================================================//
My contact information are available and listed below.
Enjoy!

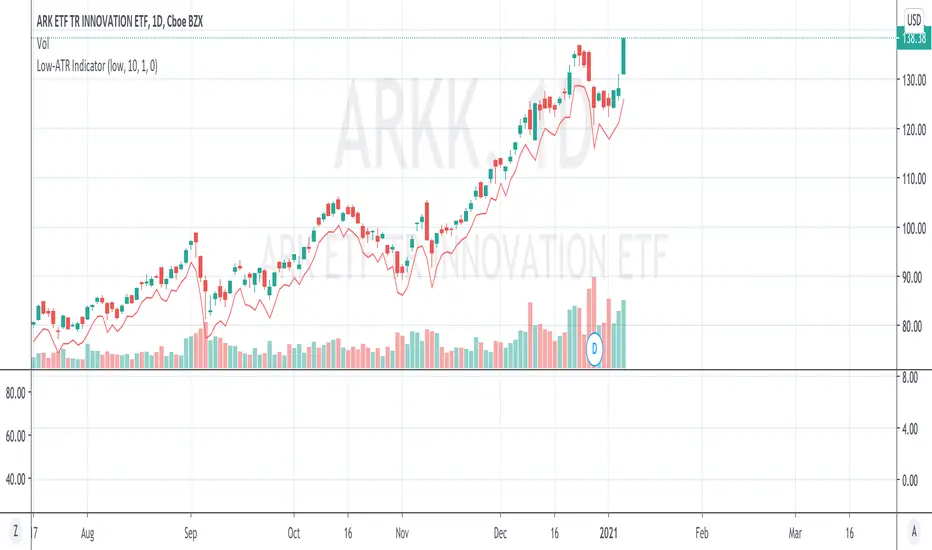
Low-ATR IndicatorWe often want to use a stop loss at a certain low - N*ATR,
But it is too troublesome to manually calculate a certain day low - ATR.
This indicator simply calculates it for you, by marking the value of day low - ATR.
By default the hardcoded ATR value is 0, which means "Uses the ATR at that day with configured look back period".
If you want to use a specific ATR value, e.g.
1) You want to set the stop loss using today's ATR but another day's day low (Very often)
2) You want to set the stop loss in another timeframe - N*ATR
You can type in the value of ATR into the "hardcoded ATR" field.
(Actually this should be the most used way)
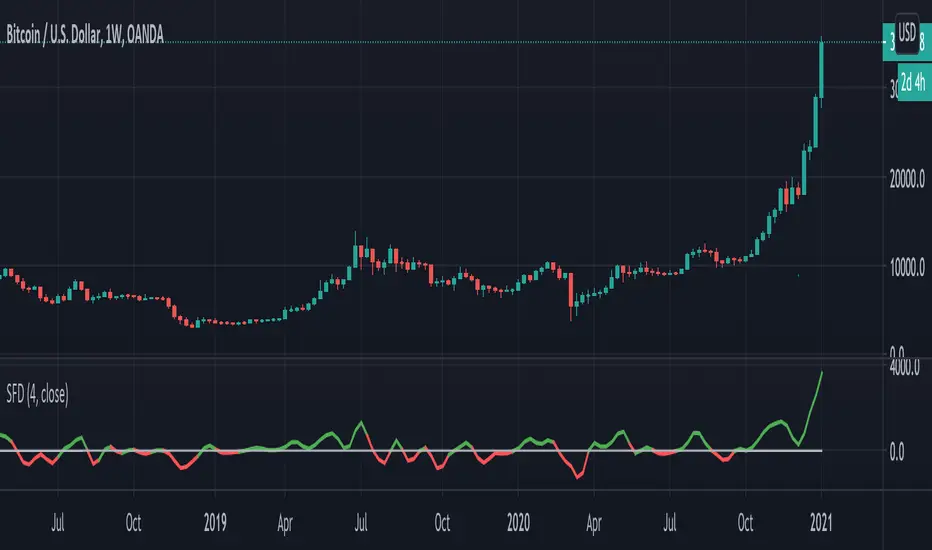
Smooth First Derivative IndicatorIntroducing the Smooth First Derivative indicator. For each time step, the script numerically differentiates the price data using prior datapoints from the look-back window. The resulting time derivative (the rate of price change over time) is presented as a centered oscillator.
A first derivative is a versatile tool used in functional data analysis. When applied to price data, it can be applied to analyze momentum, confirm trend direction, and identify pivot points.
Model Description:
The model assumes that, within the look-back window, price data can be well approximated by a smooth differentiable function. The first derivative can then be computed numerically using a noise-robust one-sided differentiator. The current version of the script employs smooth differentiators developed by P. Holoborodko (www.holoborodko.com). Note that the Indicator should not be confused with Constance Brown's Derivative Oscillator.
Input parameter:
The Bandwidth parameter sets the number of points in the moving look-back window and thus determines the smoothness of the first derivative curve. Note that a smoother Indicator shows a greater lag.
Interpretation:
When using this Indicator, one should recall that the first derivative can simply be interpreted as the slope of the curve:
- The maximum (minimum) in the Indicator corresponds to the point at which the market experiences the maximum upward (downward) slope, i.e., the inflection point. The steeper the slope, the greater the Indicator value.
- The positive-to-negative zero-crossing in the Indicator suggests that the market has formed a local maximum (potential start of a downtrend or a period of consolidation). Likewise, a zero-crossing from negative to positive is a potential bullish signal.
tradershedge
Dear Traders,
This script will get a smile on most of the pivot and price action traders.
My trading skills have drastically improved after learning the concepts of central pivot point, supply and demand and more importantly understanding of the simple candle stick patterns.
This is my experiment of decoding the above mentioned concepts to simple trading setups which can be used across any instruments and across any timeframes.
The most essential and must skills required in order to achieve profits in trading is to identify the right trend, exact entry and exits, risk management and importantly understanding the market structure along with the traders emotion.
Let’s just decipher each of the essential skills along the tools we will be using for analyzing each of the section
TREND ANALYSIS
Central pivot range ( CPR ) : is used to identify the market structure and the major trend of the instrument you are going to trade. This will help in identifying the mean reversions & trending trade setups in the market.
Developing Dynamic Pivots & Future Targets
This setup will help us in decoding the closing and opening market sentiment and will help us in planning our trade upfront. This home work in post & pre-market session will increase the odds of the trade in our favor to a great extent.
Trend Identification & Dynamic Support & Resistance
I have also included the Pivot based exponential moving average (PEMA) to visually identify the current trend and it also shows the current trend by dynamically changing the colors for bull & bear market in the PEMA zone.
VALUE AREA
We know that the market works on supply and demand and when the price arrives at these zones the market reacts very faithfully. Hence it’s very important for a trader to know in advance where these levels exist before entering the market.
This Indicator bridges this gap by showing in advance the future value areas where the price reaction can be expected and trades can be planned accordingly. Hence it can anticipate the market move with a strong logic behind us rather than leaving the trader in surprise.
This value area zone will be highlighted in different colors on the chart will be grab your attention and help in planning your trade accordingly.
Market Sentiment
Each market session is a story in itself which is been scripted by the movements of each candle sticks, hence if we understand the relationship between each candles as it is getting formed we can predicate the future candle stick formation to a great extent.
i have coded the indicator triggers which reads the relationship between each candles and shows signals of reversals and also give traders alerts when the price rejection occurs.
Various shapes of rejection signs are plotted for bullish and bearish reversals which help in prediction the strength of the price rejection which will help the trader in planning his trade.
The various shapes in the order of strength are diamond, square, arrows, and triangle respectively.
Entry & Exits
The volatility is the key in predicting the market movement. If we identify the trend correctly then all we have to do is set our expectations accordingly for the targets based on the volatility of the instrument.
The indicator basically captures the recent volatility for the specified look back period and plots across the possible price movements for the current session.
Based on your entry setups you can get a reference of the maximum targets we can expect with the help of the levels the indicator plots.
Please do feel free to use the indicator and give your valuable feed backs which will help me in optimizing it to a great extent.
I am in the process of optimizing the price triggers to a greater extent and also dynamically plot the possible demand and supply zones in coming future.
I would love to thank each of the traders in this TradingView community in helping me improve on my trading skills.
Happy Trading !


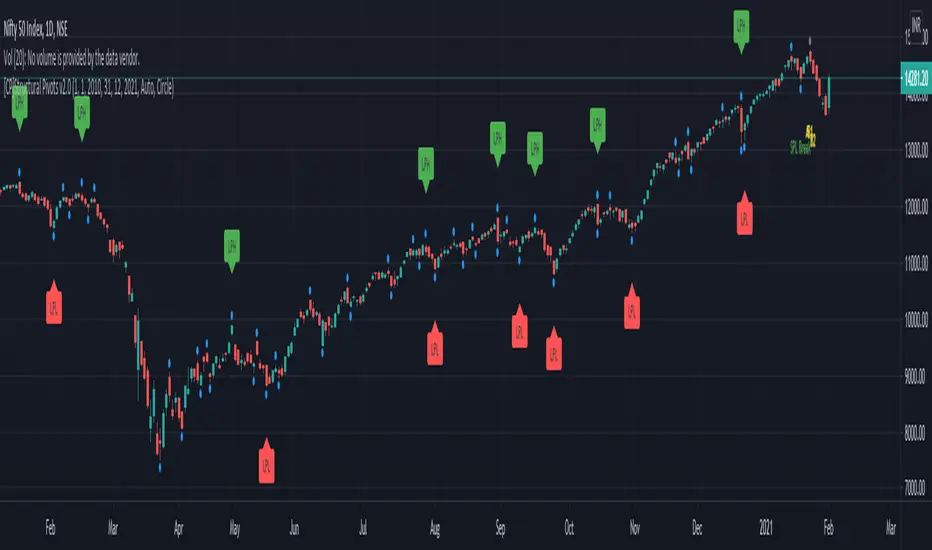
[CP]Structural Pivots v2.0This script marks structural pivots on a chart.
Script marks namely 4 types of pivots,
Structural Pivot High (SPH)
Structural Pivot Low (SPL)
Large Pivot High (LPH)
Large Pivot High (LPL)
SPL (Blue circles at bar low) is marked by finding a combination of 3 bars, an Anchor Bar, Bar 1 and Bar 2.
Bar 1 and Bar 2 should have a higher high and a higher close relative to the Anchor Bar in order to qualify as a legitimate SPL .
Reverse conditions are required for a point to be marked as SPH (Blue circles at bar high).
The complication happens for the fact that Anchor Bar, Bar 1 and Bar 2 need not be consecutive.
They can be far apart from themselves.
To solve this problem, the script generates 3-bar Combinations of all the bars from the last pivot to the current bar.
LPH are marked when an SPL gets broken (price goes below the previously marked SPL).
LPL are marked when an SPH gets broken (price goes above the previously marked SPH).
Unlike 'regular' methods of quantifying breakouts and trailing stops by optimizing various parameters of indicators, this method essentially
finds out swing highs, swing lows and S/R breaks.
One way to use the pivots is to go long when the LPH is broken, and trail the price with SPLs.
Vice-versa for shorts.
PM me on TradingView to obtain access.
Please don't ask for access in the comments section.
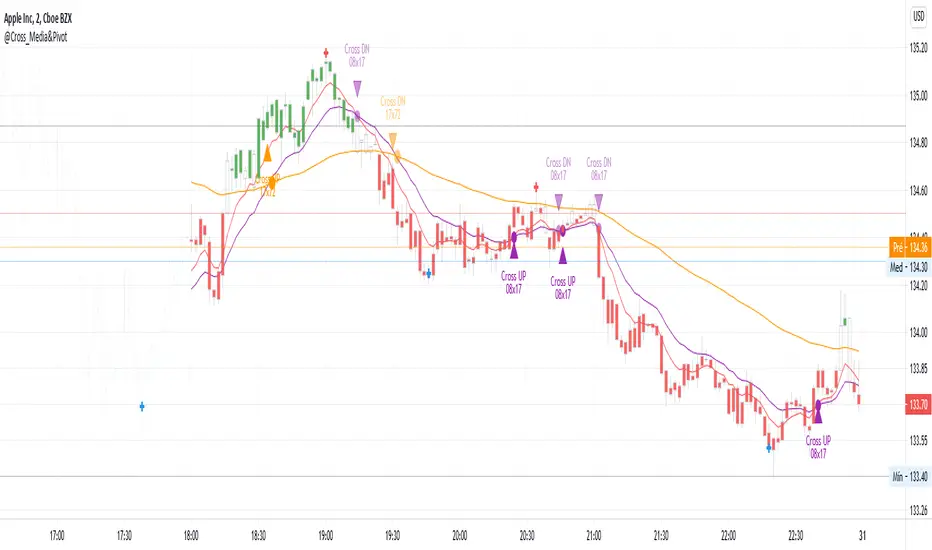
@Cross_Media&Pivot&TRADE_Entry_and_ExitThis script uses the functions plot(), cross(), plotcandle(), pivothigh() and pivotllow(). You can see the candles in the color green, above EMA 72 (Exponetional Move Average), and the color red, below EMA72. You can identify the position of the crossing UP and DOWN of the EMA 08 x EMA 17, EMA 17 x EMA72. You can identify the TRADE ENTRY points with the pivot high and TRADE EXIT with the pivot Low.
MRP_DAILY_LEVELIntraday Indicator: #MRP_DAILY_LEVEL
This indicator plots support and resistance levels based on fibonnaci levels.
1. Understanding The Levels:
Intermediate Zone is two brown coloured lines.
Resistance is two red coloured lines.
Support is two green coloured lines.
Buy target and Sell Target are white coloured lines on both sides.
-Price is strong when it is above the Intermediate Zone.
-Price is weak when it is below the Intermediate Zone.
-Price remains range bound when it stays inside the Intermediate Zone.
-Price is very strong when it's above Resistance Zone
-Price is very weak when it's below Support Zone
-Buy Target & Sell Target are the zones where you should take or trail your profit.
2.For Buying/Selling:
-Buy only when 15min close above Resistance Zone. SL below Resistance Zone.
-If 15min close is in huge range, you can buy/sell after pullback to Resistance/Support Zone.
-Also you can buy/sell if 15min close is above/below Buy/Sell target zone if you missed the rally.
-Sell only when the 15min close below Support Zone. SL above Support Zone.

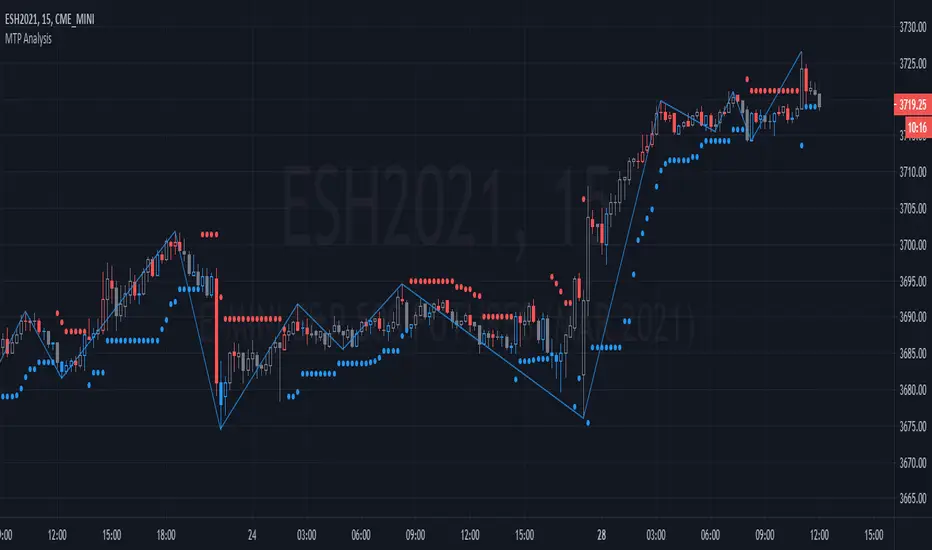
MTP AnalysisThe MTP Reversal Bars, MTP Swing Pivots and MTP ATR Stop are all included in the MTP Analysis Script.
The MTP Reversal Bars give the entry triggers for the MTPredictor Trade Setups. Blue for a potential Buy, Red for a potential Sell, and Grey for neutral. Please note, these are only to be used in conjunction with our MT Trade and MTP Advanced Trade Setup Scripts, and are only relevant at (or up to 5 bars after) a potential trade setup. They are calculated using a unique combination of reversal triggers.
The MTP Swing Pivots connect the swing highs and lows on your chart, giving you the Pivots off which to work for your MTPredictor Analysis, for example when using our MTP Decision Point (DP) Script. The Swing Pivots use the number of Bars either side of the pivots for its construction (not a % retracement), and as such are not a simple Zig-zag indicator.
The MTP ATR Stop is used to trail your protective Stop, once in a position, when the Market is “strong” (MTP Trend indicator is beyond the strength band) when the market reaches its projected Profit target. Please see the MTP Trend indicator Script for more information on this.
There is a risk in Trading and Investing. Losses can and will unfold.
The script is available as an “invite-only” script, as part of the MTPredictor suite of tools on Trading View.
To obtain access, please go to the web page in our signature that appears below.
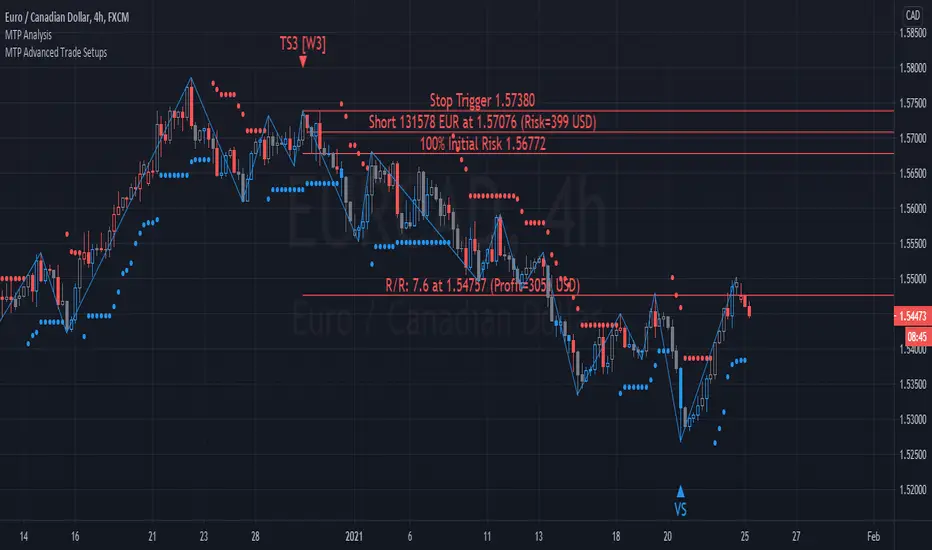
MTP Advanced Trade SetupsThe MTP Advanced Trade setup script contains the Wave 3 variation of MTPredictor automatic trade setups, TS1(W3), TS3(W3), TS4(W3) as well as the Volume Spike (VS) setup.
The TS1(W3), TS3(W3), TS4(W3) trade setups are designed to catch the end of a Wave (2) correction, with the aim of trading the Wave (3) swing. The Wave (3) swing is usually the strongest and longest swing in a completed 5 wave sequence. Whereas, the VS (Volume Spike) setup is designed to identify high volume spikes, with the aim of finding “fake-outs” at levels of DP support/resistance. This is usually where the “professional money” enters the market to produce a sharp swing in the opposite direction. For more detail of the MTP DP level, please visit the publication of the MTP Decision Point (DP) script.
Entry triggers triggers are provided by our MTP coloured reversal bars that are part of our MTP Analysis Script. The triggers are Blue for a potential Buy, Red for a potential Sell, and Grey for Neutral. Please note, these are only relevant at (or up to 5 bars after) the potential trade setup. Please see the MTP Analysis Script for more information.
Targets for the setups are automatically shown for each setup as part of the Trade Analysis. Position Sizing is included in the Analysis as well.
Please remember that although MTPredictor has automatic setups, we do not suggest that you just follow these blindly as if it were a black box mechanical system, judgement is needed in filtering the automatic setups, particularly with respect a clear larger degree trend. Each Trader must take responsibility for deciding on whether their own Analysis is clear and fits in with their own (personal and unique) Trading Plan.
There is a risk in Trading and Investing. Losses can and will unfold.
The script is available as an “invite-only” script, as part of the MTPredictor suite of tools on Trading View.
To obtain access, please go to the web page in our signature that appears below.
MTP Trade SetupsThe MTP Trade setups script contain the standard MTPredictor automatic trade setups, TS1, TS2, TS3, TS4 and DP.
The TS1, TS2, TS3, TS4 trade setups are based around the ABC correction of varying degrees, and as such, are designed to catch the end of a correction in a continuing trend. Whereas the DP is a trend termination setup at our MTP DP level on oscillator divergence. We define the trend by using Support / Resistance areas on the higher time frame chart using our MTP DP levels. For more detail of the MTP DP Levels, please visit the publication of the MTP DP script.
Entry triggers triggers are provided by our MTP coloured reversal bars that are part of our MTP Analysis Script. The triggers are Blue for a potential Buy, Red for a potential Sell, and Grey for Neutral. Please note, these are only relevant at (or up to 5 bars after) the potential trade setup. Please see our MTP Analysis Script for more information.
Targets for the setups are automatically shown for each setup as part of the Trade Analysis. Position Sizing is included in the Analysis as well.
Please remember that although MTPredictor has automatic setups, we do not suggest that you just follow these blindly as if it were a black box mechanical system, judgement is needed in filtering the automatic setups, particularly with respect a clear larger degree trend. Each Trader must take responsibility for deciding on whether their own Analysis is clear and fits in with their own (personal and unique) Trading Plan.
There is a risk in Trading and Investing. Losses can and will unfold.
The script is available as an “invite-only” script, as part of the MTPredictor suite of tools on Trading View.
To obtain access, please go to the web page in our signature that appears below.

MTP Wave Price TargetsThe MTP Wave Price Targets script allows you to project “in advance” WPT (Wave Price Target) zones on your chart, these anticipate where the next Elliott Wave swing is likely to end. WPT zones are calculated using clusters of Fibonacci Price levels that are specific to the Wave in question.
This is designed to be used with the users own “manual” Elliot Wave count. The user can use the MTP Pivots (that are included in the MTP Analysis Script) as a guide to see the swings to choose on the Chart. The user has several options (Pivot Number, Last Pivot, Pivots Back or Bar Number) on how to choose the Pivot to display the WPT Targets from.
There is a risk in Trading and Investing. Losses can and will unfold.
The script is available as an “invite-only” script, as part of the MTPredictor suite of tools on Trading View.
To obtain access, please go to the web page in our signature that appears below.

MTP Elliott WavesThe MTP Elliott Waves script allows you to place an Elliott Wave count on your chart at a specific Pivot point. The script uses our unique “Isolation Approach” to Elliott Wave analysis, which has been used in our MTPredictor software since 2001. The Elliott Wave counts include the WPT (Wave Price Target) zones, where the wave found is likely to end. WPT zones are Fibonacci Price clusters that are specific to the wave in question. The Script will find Waves, 2, 3, 4, 5 as well as the simple abc correction. The Script only focus on one Wave count with no alternate counts or X-waves or other complex corrections. We do this to keep things simple and uncluttered. The Wave count will only display on the chart if a valid count is found at the Pivot chosen.
This is designed to be used in conjunction with the MTP Swings Pivots, which are included in the MTP Analysis Script. Please refer to this script for more information on the MTP Swing Pivots. The user has several options (Pivot Number, Last Pivot, Pivots Back or Bar Number) on how to choose the Pivot to display the Elliott Wave count from.
There is a risk in Trading and Investing. Losses can and will unfold.
The script is available as an “invite-only” script, as part of the MTPredictor suite of tools on Trading View.
To obtain access, please go to the web page in our signature that appears below.

MTP Decision PointThe MTP Decision Point (DP) is a tool to project “in advance” future support / resistance levels on your Chart. It is calculated using clusters of Fibonacci and Geometric Price levels.
The MTP Decision Point (DP) levels can also be used to help determine the larger degree trend, as the market moves from one DP level to another. Traders can then look to trade "in the direction of" this larger degree trend when, and only when, the picture is clear (i.e. the market is making clean reversals at DP levels). Ideally, Traders should look to use the larger degree trend on a chart time frame between 3-5 times higher than the one they are Trading on. Eg look to a Weekly when trading on a Daily time frame, or look to a 15min when Trading on a 3min time frame. Please remember, that a market is usually only in a clear picture about 50% of the time, the rest of the time, the market picture is unclear and as such should be avoided.
This is designed to be used in conjunction with the MTP Swings Pivots , which are included in the MTP Analysis Script. Please refer to this script for more information on the MTP Swing Pivots . The user has several options (Pivot Number, Last Pivot, Pivots Back or Bar Number) on how to choose the Pivot to display the DP level from.
There is a risk in Trading and Investing. Losses can and will unfold.
The script is available as an “invite-only” script, as part of the MTPredictor suite of tools on Trading View.
To obtain access, please go to the web page in our signature that appears below.

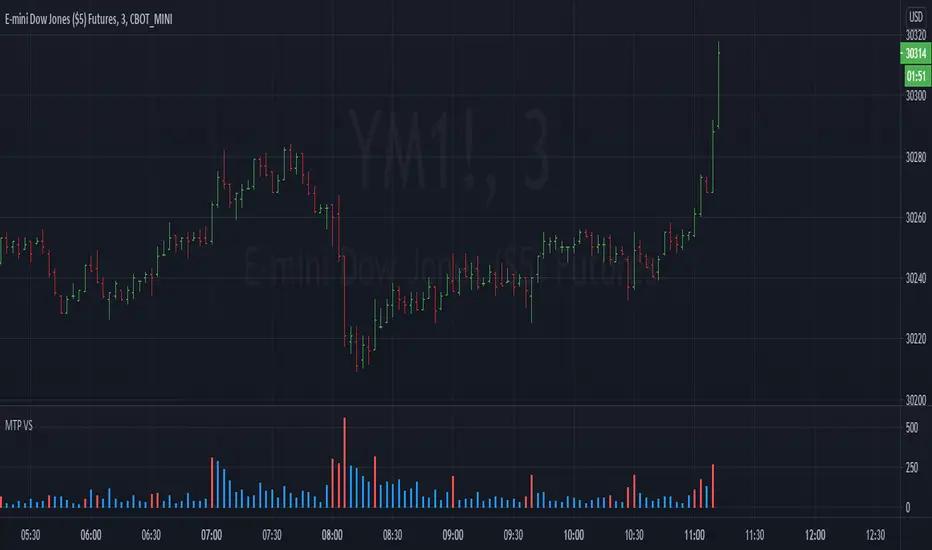
MTP VSThe MTP VS Indicator is designed to identify high volume spikes, with the aim of finding “fake-outs”, where markets break out from previous swing highs or lows but then reverse at levels of MTP DP support/resistance. This is usually where the “professional money” enters the market to produce a sharp swing in the opposite direction. For more detail of the MTP DP support/resistance levels, please visit the publication of the MTP Decision Point (DP) script.
There is a risk in Trading and Investing. Losses can and will unfold.
The script is available as an “invite-only” script, as part of the MTPredictor suite of tools on Trading View.
To obtain access, please go to the web page in our signature that appears below.
[JRL] ATR Pivot PointsThis indicator plots pivot points with support and resistance lines based on average true range (ATR). ATR is one of the best volatility and trading range predictors, so it can be very useful for finding confluence in any strategy.

(CoInS) Confluence of Indicators and Signals v2 skvConfluence of Indicators and Signals (CoInS) v2 skv
This time best of pivots and oscillators came to confluence to guide traders for better decision making to trade. Remember practice makes profit.
This script created for educational purpose for learners want to observe/study the indicators and its signals. Indicators HMA, SMA, Super Trend, MACD, BB, ADX/DMI/DMS, RSI, Elder Impulse and Pivots CPR, Camarilla, Floor, SQR are used in this script and the display of them controlled through the indicator settings. Values are tuned and can't be changed. Only the current day values will be displayed.
Observe the signals and reversal points at pivots or moving average lines. The bright green up triangles and bright orange down triangles indicates momentum, the faded triangles indicates the momentum is getting weak.
At start of the day, this script indicates whether today is trending or not trending for the scrip.
The SQR pivot points will move as per the trend and indicate the resistance and support level at that time. The color crosses informs that the change occurred throughout the day.
The signals generated by this study are not recommendation and use it on your own discretion after keenly observing each and every details.
Pivots
Pivot Boss CPR with width
Pivot Boss Camarilla
Pivot Boss Floor pivots
Simple and amazing SQR pivots
Displays signals from,
RSI signals
HMA signals
Super Trend
MACD (cross and histogram signals)
Elder Impulse
ADX/DMI/DMS and BB for Momentum
I'm thankful to trading view, various pine coders and authors contributing here and building wealth of knowledge.
*****Remember: Practice makes Profits*****
Disclaimer
1. Only for educational and learning purpose
2. For Intraday and scalping strategies and 5 and 15 min TF only
3. Do paper trade before using any information for actual trading
4. Not swing or positional trade
5. Use it on your own discretion and no one else responsible for the profit/loss except you

Moon at ZeroMoon at Zero
// ========================================================================//
This script is better utilized on LTF ( Low Time Frames ) Up to the 1min chart.
This script helps you spot important events in the market using the moon at zero degree.
This script includes dates for the year 2020, 2021, and 2022.
This script also complements the Gann ToolBox that I have on my tradingview page giving you good measurement of the market and some of its volatility dates and locations in price.
// ========================================================================//
To get access to this add-on or for the full package including the toolbox you can see my information below.

Murrey Math Lines with Manual adjustmentI'm publishing my first script for free.
You can see the MurreyMath Lines and Levels now easily for any instrument.
How to use
you can setup this indicator manually by typing the local top and high points on the chart
you can easily find the major HIGH/LOW points by using for example using the Tradingview's built-in "Pivot Points High Low" indicator with setting 144 or 200 periods.
you can adjusting the fraction-scale later with setting named "Multiplier"
best performing on Daily/Weekly timeframes. But you can use on intraday moves too!
Detailed description see below.
About The Murrey math lines indicator
The Murrey math lines indicator adds horizontal support and resistance lines on a price chart, which, as the author believes, are able to hint at reversals. These lines also provide traders with an understanding of the current market tendency and allows them to see whether there is a potential for a trend reversal.
There is an opinion that a trading system based on horizontal Murrey line can provide excellent signals on any type of markets – currency, stock, and even crypto. According to Murrey himself, large investors will behave in the same way in all kinds of markets. Moreover, they can work with the lines on different timeframes, which is an excellent opportunity to follow their capital management rules regardless of the deposit amount.
What is the gist of Murrey math lines?
Murrey math lines are based on the approach and observations that were made by William Gann , who was famous for his perfect forecasts with the use of different kinds of market symmetry, and one of the most famous technical analysis tools is called Gann Angles. The author himself had significantly adjusted the system and made it easier and clearer for ordinary investors. In Murrey’s opinion, markets will start corrections at some particular price levels, breakouts of and returns to which may provide traders good signals for opening positions. Regardless of the current market trend, the price must either rebound from the level or break the key level, which will point at a boost of the actual trend. Murrey emphasized 8 price levels, marked from 0/8 to 8/8, with 0/8, 4/8, and 8/8 being the most important.
Murrey math lines - 4/8 level
4/8 is a middle price level or even a balance line. Prior to a breakout of this line, the price may fluctuate inside a sideways channel. If the price breaks 4/8 to the upside and moves above it, then this area may be considered as good support. However, if this line is broken downwards, it will act as a strong resistance level.
Murrey math lines - 8/8 and 0/8 levels
8/8 and 0/8 are very strong obstacles for further movement past them. As a rule, they can be broken because of some important or surprising news, when the actual reading of some macroeconomic indicators is very different from forecasts.
More often than not, traders expect either a reversal from this area or at least a serious correction. Also, there is an opinion, that a rebound from 0/8 to the upside is more probable than a rebound from 8/8 to the downside. 8/8 is more often broken to the upside and the price continues the uptrend
Murrey math lines - 7/8 and 1/8 levels
7/8 and 1/8 help traders to understand whether to wait for a new impulse or the market movement was quite accidental and the price may start a correction.
For example, if the price rebounded from 4/8 to the upside, reached 7/8 but is not moving any higher and just testing 7/8, then one should expect a decline to return to 4/8. However, if the price breaks 7/8, one may assume that the market trend is strong and the instrument may continue growing towards 8/8 or even higher. As for 1/8, the situation is quite the opposite.
Murrey math lines - 6/8 and 2/8 levels
6/8 and 2/8 are also pretty strong and traders compare them to 8/8, 0/8, and 4/8. The lines will be very strong if after rebounding from them the price doesn’t break these lines by the closing prices.
Murrey math lines - 5/8 and 3/8 levels
5/8 and 3/8 indicate a sideways movement on the market, which happens about 50% of the time or maybe more. However, if market players push the price past one of these lines, it is expected to continue moving in the direction of a breakout.
In the case of a breakout of 5/8, the closest upside target is 8/8. If the price breaks 3/8, there is a high probability of further decline towards 0/8.
Murrey math lines - -1/8 and +1/8 levels
-1/8 and +1/8 are used for some kind of attempt to catch a trend reversal. -1/8 is an extreme support level during a bearish trend, while +1/8 is an extreme resistance during a bullish tendency.
A test of these lines indicates that the current trend is weakening. As a rule, the price doesn’t revers here and starts corrections towards 0/8 and 8/8. After that, the previous trend resumes.
Murrey math lines - -2/8 and +2/8 levels
A breakout of -2/8 and +2/8 indicates a very strong trend on the market. -2/8 is ultimate support during a bearish trend, while +2/8 indicates ultimate resistance during an uptrend. At such moments, Murrey math lines are redrawn. However, the author expected a closing candlestick 4+ bars higher or lower than these lines, and only after that started re-drawing the lines on a chart.
Closing thoughts
Trading using Murrey math lines provides traders with simple rules for entering the market. We understand that a breakout of a line will only push the price towards the next target levels on a chart, while the unwillingness of the instrument to break a line will result in a correction with specific targets. As a result, we have a strategy that implies trading in the direction of an active trend and when we need to look for a reversal, then there are particular levels, from which the price is highly likely to rebound. However, an ordinary investor may requite much time to remember all lines and watch the price behavior at the moment of breakouts or rebounds in order to grasp this method. Also, there are no clear parameters for different instruments, so one will have to choose parameters manually based on the experience gained while using the indicator. Anyway, a trading method with the use of Murrey math lines is very interesting and unique and may be combined with your existing know-how, thus significantly improving a classic approach to using Murrey lines.
Please feel free to comment any question.
Roadmap in next year:
I'm planning one automatically calculated version, but not so easy to do that for many reasons.
This indicator is the free and simplier version in first time.

Fibonacci Pivots Monthly and Weekly Full (no history)Fibonacci Pivots Monthly and Weekly Full (no history)
Inspired by FxChartAnalyst trader, with his great Monthly Weekly Daily Pivot Points Standard indicator
www.tradingview.com
This indicator calculates and plots both Monthly and Weekly pivots on a chart. Pivots are based on the Fibonacci ratios of the previous Month/Week candle close.
Good luck everyone!

Tech Primary AnalysisThe indicator consists of four main parts, the main SR/Rejection the solid black line, the Second SR, Trend channels the dashed line , and Alerts.
The Main SR/ Rejection point is used to indicate a rejection of a candlestick .
This first type of rejection is identified by a default black line to represent a low zone in the market for that trade.
The Second SR shows a pivot point on the chart; it is presented as a dotted line often near the main SR/Rejection.
When a rejection and pivot point are near each other, it indicates a strong zone.
Trend channels are moving averages, they also have 2 standard deviations that instruct you on when it is best to buy into a trade and when it is best to sell and leave the trade.
You buy low and sell higher for the maximum profit. Lastly, there are alerts;
set an alert for the main rejection line when you want to follow the trend channel, or use it for the when the second resistance is broken, or when the support is broken.
Another important technique is knowing when to trade.
Trading is best in intervals of four hours. Trading at 9am, 1pm, 5pm, 9pm, and 1am will get you into the beginning of the trade to better watch the trend channels.
Another important factor to remember is setting the stop loss which should be a previous rejection
Works on all markets : Forex, Crypto, Options Stocks
Use the link below to obtain access to this indicator or PM us to obtain access
