Daily, Weekly, Monthly Pivot Points StandardShow Higher timeframe Pivot Point along with 3 support/Resistance and mid line between them
Option to show the Monthly lines, with or without mid line, and can select the color
Option to show the Weekly lines, with or without mid line, and can select the color
Option to show the Daily lines, with or without mid line, and can select the color
Option to show a tables with the previous Open, High, Low, Close for these higher timeframe
Pivot
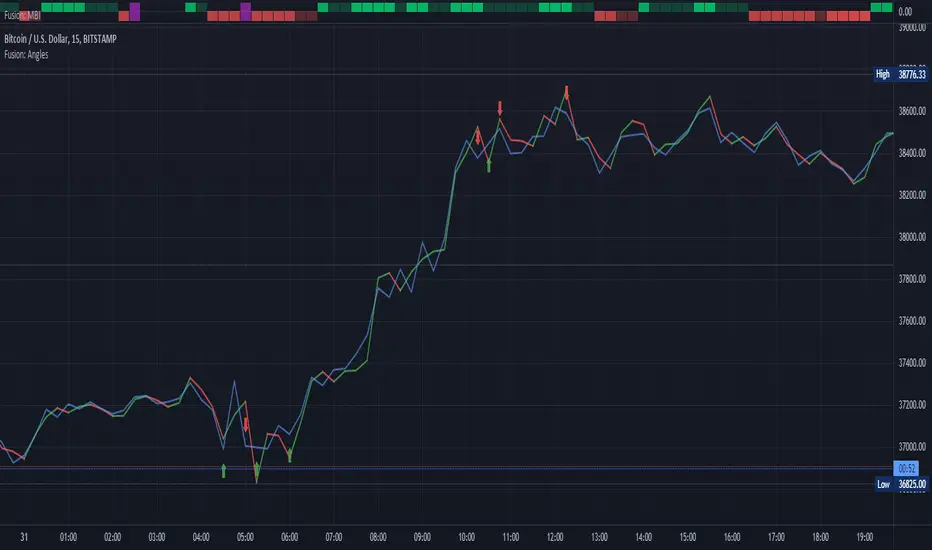
Fusion: Pivot Angles and ThresholdsThis is a somewhat unusual indicator working purely on geometry.
You set a threshold for an angle of a pivot and if the angle is LESS THAN (because the sharper the pivot the smaller the angle) your threshold then a signal is given.
I use this as an exit indicator and it works well for me when other methods don't give a clear signal. Seeing where it shows up it might also make a good entry indicator but I'll leave it up to others to play with that and see if it's a good entry indicator for them. If you find it is good for entries or other things please drop me a note or make a comment, I would appreciate knowing.
If you set the length to 1 for the moving average then it will just use the source and not perform a moving average operation.
There's half a dozen or so moving average types to select from so you will probably find one that suits you pretty well.
The settings are certainly not optimized so set to whatever suits your needs as my defaults will probably be wrong for you.
The code is structured to easily drop into a bigger system so use it as a lone indicator or add the code to some bigger project you are creating. If you do integrate it into something else then send me a note as it would be nice to know it's being well used.
Finally, if you find value please do make a comment, give a thumbs up etc.
Enjoy and good luck!
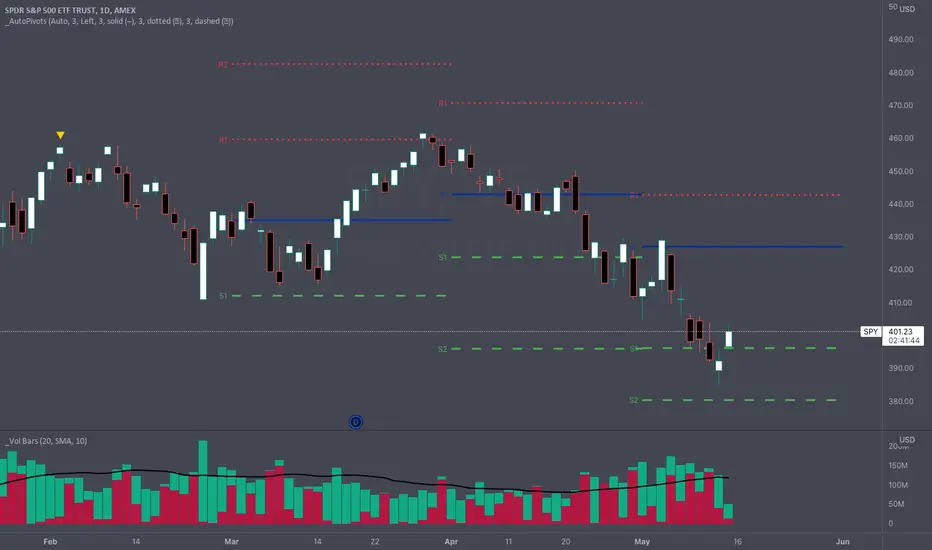
_Auto Pivot PointsOne of the main drawbacks to displaying Pivot Points on a chart is that many times the more extreme pivots (R/S3, R/S4, R/S5) aren't anywhere close to the price action during a timeframe. These extreme pivot points clutter up your chart and make it hard to use the "auto" zoom feature of TradingView.
The " _Auto Pivot Points " indicator solves these problems by automatically only displaying the pivot points if the price has crossed the pivot during the timeframe or it is the next closest pivot . For example, on monthly pivots if the price has only crossed the R1 Pivot then this indicator will display the R2 Pivot and any pivots below but it won't display the R3, R4, R5 pivots . The R3, R4, & R5 pivots are not very useful to the trader because the price hasn't even crossed the R2 Pivot . But as soon as the price crosses the R2 Pivot then this indicator will display the R3 Pivot because it is the next closest. And the same logic applies to the S Pivots .
If you need to see all the Pivots then there is a convenient toggle to display all the pivots by turning off the intelligent auto pivots . But as soon as you don't need to display all the pivots the toggle will turn on the automatic pivots .
This indicator has many style and logic options. This script allows you to control:
Number of past timeframes to display
Displaying Pivot labels
Label position (left/right)
Line color
Line width
Note: TradingView has a limit of 40 security calls per script. Due to this limitation this indicator can only display pivots a max of 7 time periods back.
Note 2: This indicator uses the Traditional pivot calculations.
Swing Pivots High LowBINANCE:BTCUSDT
This indicator is an opensource merge of the built in 'Pivot Points High Low' and the most popular 'Swing-high-low-support-resistance' indicators. The original 'Pivot Points High Low' does not have extensions with better visibility, while the most popular 'Swing-high-low-support-resistance' has no source available. I've also added additional configurable alert conditions for Pivot High and Low Crossover/Crossunder.
Please read the official documentation for further information about the indicator.

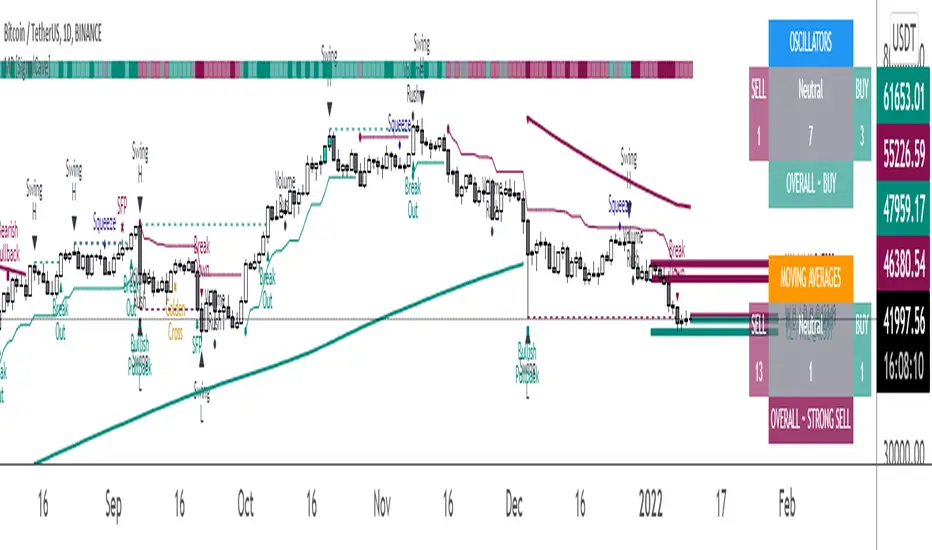
Multi-Purpose All in One [SignalCave]Multi-Purpose All in One Indicator Functions
1) Technical Analysis, Technical Ratings
2) Pivots, Primary & Secondary Trends
3) Swings, Engulfs, Golden & Death Crosses, Price Squeezes, Pullbacks, Breakout & Breakdowns, Volume Rushes
4) Momentum Strength
1) Technical Analysis, Technical Ratings
Technical analysis display real-time ratings. It based on the most popular technical indicators such as RSI, Stochastic, CCI, ADX, AO, Momentum, MACD, Stochastic RSI, Williams %, Ichimoku Cloud, SMA, EMA, VWMA and HMA.
Technical analysis is a built-in function on TradingView. You can access any asset’s technical analysis page and see it’s performance in real time.
"Multi-Purpose All in One" indicator brings this function into your TradingView charting screen. Indicator allows you to see the same output without visiting any external web page in TradingView. Indicator also works on every timeframe and asset class.
Technical Ratings is a technical analysis tool that combines the ratings of several technical indicators to make it easier for traders and investors to find profitable trades.
Technical Ratings can be a valuable technical analysis tool for many analysts or traders. Many traders use a selection of complementary indicators to make better decisions. Technical Ratings simplifies this task by combining the most popular indicators and their signals.
2) Pivots, Primary & Secondary Trends
Helps you to identify primary and secondary trends and potential support/resistance zones.
Trend detection have three modes which are “Aggressive, Moderate and Conservative” . You can customize the mode on settings screen.
3) Swings, Engulfs, Golden & Death Crosses, Price Squeezes, Pullbacks, Breakout & Breakdowns, Volume Rushes
A swing low is when price makes a low and is immediately followed by consecutive higher lows. Likewise, a swing high is when price makes a high and is followed by consecutive lower highs.
Swing Failure Pattern (SFP) is a type of reversal pattern that can be used as buy or sell signals.
Engulfing candles tend to signal a reversal of the current trend in the market. This specific pattern involves two candles with the latter candle 'engulfing' the entire body of the candle before it.
On this indicator, bullish engulfs visible only on downtrend and oversold conditions. Bearish engulfs visible only on uptrend and overbought conditions.
The death cross and golden cross are technical analysis terms for when a moving average (MA) intersects with another from either above or below.
The cross, depending on which it is, can signal the start of a new trend or the end of one.
Squeeze signs signifies low volatility, market preparing itself for an explosive move up or down direction.
Bullish Pullbacks are widely seen as buying opportunities after an asset has experienced a large upward price movement. Most pullbacks involve an asset's price moving to an area of technical support , such as a moving average, before resuming their uptrend.
Bearish Pullbacks are widely seen as selling opportunities after an asset has experienced a large downward price movement. Most pullbacks involve an asset's price moving to an area of technical resistance , such as a moving average, before resuming their downtrend.
A breakout refers to when the price of an asset moves above a resistance area, breakdown refers to when the price of an asset moves below a support area.
Breakouts/breakdowns indicate the potential for the price to start trending in the breakout direction.
For example, a breakout to the upside from a chart pattern could indicate the price will start trending higher.
Volume rush signs appears when the trading volume increases more then a usual period. It can be useful with combining breakout signals as a confirmation.
4) Momentum Strength
Momentum Indicator helps you to identify potential reversal areas .
Calculation done with using Relative Strength Index (RSI), Money Flow Index (MFI) and Average Directional Movement Index (ADX) indicators.
On full strength bearish movement bars paints as light red , full strength bullish movement bars paints as light green color.
They indicates that trend can be change to opposite direction in a short period of time.
Momentum Strength have three modes which are "Aggressive, Moderate and Conservative" . You can customize the mode on settings screen.
T3 + BB
TRES EMAS + BANDAS DE BOLLINGER
INDICADOR 1: TRES EMAS (MEDIA MOVIL EXPONENCIAL)
Con este indicador puede visualizar el promedio de precios con mayor peso a los datos mas recientes.
Se calculan y dibujan tres medias móviles exponenciales: 4, 20 y 200 últimas velas.
-Rápida EMA1 = 4, paso = 1
-Media EMA2 = 20, paso = 2
-Lenta EMA 3 = 200, paso = 10
INDICADOR 2: BANDAS DE BOLLINGER
Con este indicador podrá ver la fuerza y la tendencia del mercado, es decir la mide la volatilidad del precio del activo.
Si el precio sobrepasa la banda superior, el activo está sobrecomprado.
Si el precio sobrepasa la banda inferior, el activo está sobrevendido.
Longitud tendencia - BASE = 20, paso = 1
Desviación Estándar - Multiplicador = 2, paso = 0.2
Estos 2 indicadores sirven para todo tipo de activos: FOREX, CRIPTO, CFD´s, ETC.
------------------------------------------------------------------------------------------------------------------
THREE EMAS + BOLLINGER BANDS
INDICATOR 1: THREE EMAS (EXPONENTIAL MOVING AVERAGE)
With this indicator you can visualize the average of prices with greater weight to the most recent data.
Three exponential moving averages are calculated and drawn: 4, 20 and 200 last candles.
-Fast EMA1 = 4, step = 1
-Average EMA2 = 20, step = 2
-Slow EMA 3 = 200, step = 10
INDICATOR 2: BOLLINGER BANDS
With this indicator you can see the strength and trend of the market, that is, it is measured by the volatility of the asset price.
If the price goes above the upper band, the asset is overbought.
If the price goes above the lower band, the asset is oversold.
Trend length - BASE = 20, step = 1
Standard Deviation - Multiplier = 2, step = 0.2
These 2 indicators are used for all types of assets: FOREX, CRYPT, CFD's, ETC.

Pivots High-Low Screener & AlertsHi fellow traders ,
Pleased to share a Pivot High - Low Screener.
The script uses the TV inbuilt Pivot function.
It Screens 25 tickers default set, these can be modified in the input dialog box.
All you need to do is attach to any chart and set the periodicity or the resolution of the chart to your desired alert() frequency requirement.
Now go to the input settings icon of the script and set your Pivot right and left parameters!
Set the alert from the menu as usual click - Any alert() function call and bingo you are done!!
Similarily change the chart periodicity to the next timeframe and set the next alert.
No more opening multiple charts and setting individual time consuming alerts().
You will get concatenated alerts or summary alerts for your tickers.
Track 25tickers with a single alert for each timeframe(Supports 40 tickers).
Happy trading with TV..

The Divergent - Advanced Divergence IndicatorAutomated divergence detection with unparalleled customizability for any market on TradingView.
This is the Basic (Free) version of The Divergent - Advanced Divergence Indicator .
Features :
1. Divergence detection for any market & any timeframe
Bitcoin? Tesla? Gold? You name it. The Divergent will spot divergences for you on any market and any timeframe.
2. Choose from 2 built-in oscillators
The Basic version of The Divergent comes with 2 built-in oscillators: MACD and RSI
3. Automated detection of Regular Bullish and Regular Bearish divergences
The Basic version of The Divergent can detect two types of divergences: Regular Bullish and Regular Bearish
4. Complete control over every aspect of divergence detection
The Divergent exposes over 40 different settings to allow you fine tune the divergence detection algorithm.
- Oscillator (MACD / RSI)
- Detect Regular Bullish Divergences
- Detect Regular Bearish Divergences
- Pivot Detection Source (Price / Oscillator)
- Source smoothing
- Candle Pivot Detection Mode (Bodies / Wicks)
- Pivot Lookback Right
- Pivot Lookback Left
- Divergence Max. Length
- Divergence Min. Length
- Number of Historic Pivots to Compare
- Pivot Correction
- Restrict Starting Pivot to a Single Divergence
- Allow Early Detection of Divergences
- Line of Sight filter
- Minimum Pivot Change filter
- Pivot Candle Color filter
- Moving Average Filter
- MACD settings
- RSI settings
5. Divergence statistics
6. Fully documented
The Divergent has each and every of its inputs documented via tooltips inside the settings panel. Simply hover your mouse over the ( i ) icon next each the input field to learn more about the purpose of the configuration.
---

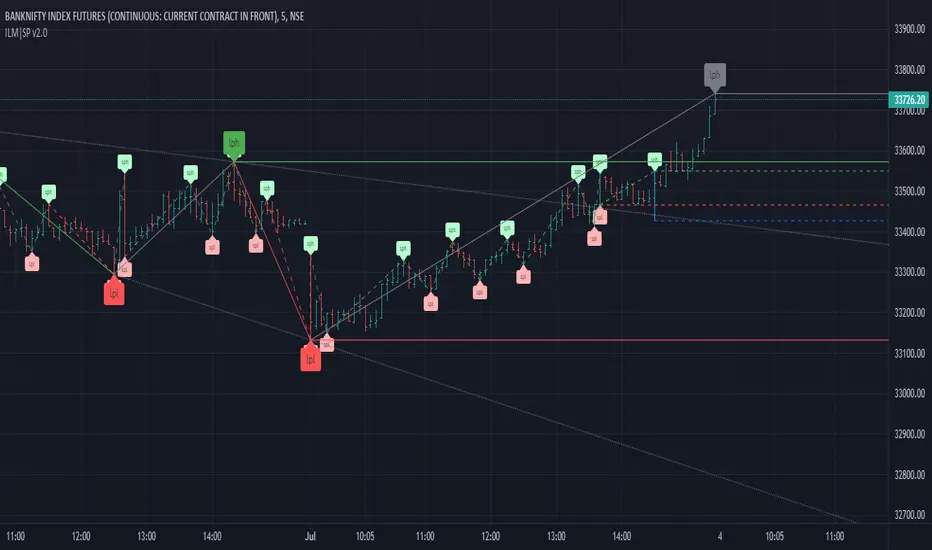
ILM | Structural Pivots v1This script will mark the structural pivots based on some rules.
Solid green/red lines are for major trend to mark LPH (Large Pivot High) and LPL (Large Pivot Low).
Dotted green/red lines are for minor trend SPH (Small Pivot High) and SPL (Small Pivot Low). SPH and SPL are not marked as labels to reduce congestion on the chart.
Gray lines are to identify temporary large pivots before they get promoted to LPH / LPL
Blue lines are to identify temporary small pivots before they get promoted to SPH / SPL
Couple of common trading strategies
- Go Long above LPH
- Go Short below LPL
- Go Long above SPH after LPH
- Go Short below SPL after LPL
Mean Reversion
- Go Long above SPH after LPL
- Go Short below SPL after LPH
This is the initial version and I am making it as public beta to iron out any issues. I might make this script private in future - FYI
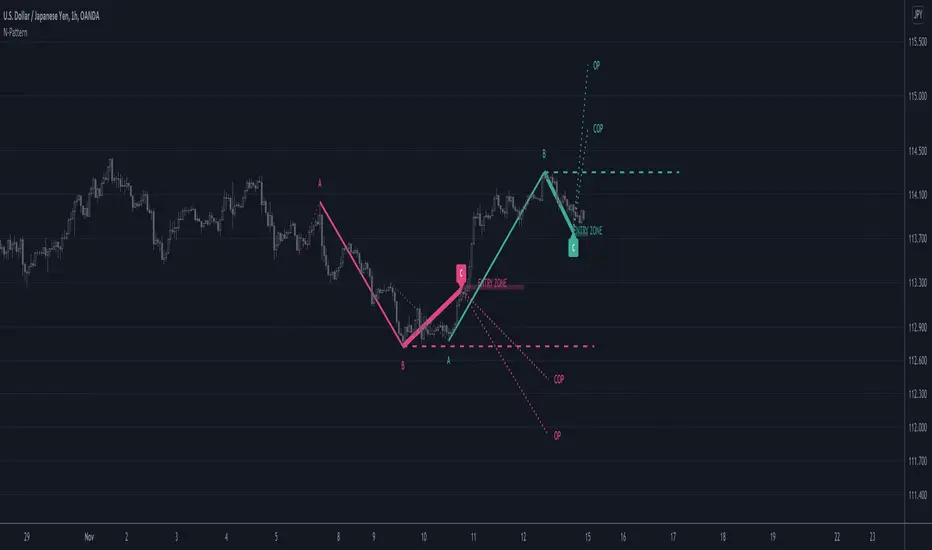
N PatternThis indicator looks for N patterns on the chart and illustrates them.
It predicts the future point D from the most recent point C and the past points A and B.
Settings:
Pivot Right bar / Pivot Left bar
Pivot settings.
Lookback
Go back a specified number of bars to find point A.
When point A is found, the opposite vertex in between is point B.
Nearest Bars Count
If the most recent C point and the previous C point are too close, the previous C point will be hidden.
Specify the number of bars to determine if they are too close.
Objectives
There are three types of D points, which are future prices.
Each can be shown or hidden.
Support/Resistance
Draw a line extending horizontally from point B as a support line or resistance line.
[MF] CURRENT AND NEXT CPR LEVELSThis is CPR with Monthly, Weekly and Daily time frames of the current and next* CPR levels.
* The following lines only become relevant at the end of the cycle.
CPR LEVELS:
P (pivot point) = (H + L + C) / 3
BC (Bottom Central) = (H + L) / 2
TC (Top Central) = (P - BC) + P
Resistance Levels
- Green = R1 Levels ( 2×P - L )
- Green = R2 Levels ( P + (H - L) )
- Green = R3 Levels ( H + 2 * (P - L) )
Support Levels
- Red = S1 Levels ( 2×P - H )
- Red = S2 Levels ( P - (H - L) )
- Red = S3 Levels ( L - 2 * (H- P) )
Description and Refrences:
en.wikipedia.org(technical_analysis)
Rules For BUY Setup with CPR
1) Today's Pivot Level Should be higher than Previous Day's Pivot Level
2) The previous day's close should be near day high.
Rules For SELL Setup with CPR
1) Today's Pivot Level Should be lower than Previous Day's Pivot Level
2) The previous day's close should be near day low.
CPR or central pivot range is the best tool available for the trader to see the price base indicator. You can use this tool i.e CPR (central pivot range) to check the price indicator in the stock market. You know the price of shares sometimes goes up or sometimes goes down in the stock market. So it will be best to stay updated and know it before the time the share market/stock market fall or rises.

[MF] Auto Fibonacci LevelsDescription:
Automatically draw Fibonacci Pivot levels based on the previous (day's, week's or month's)
Range ( High-Low ). The HLC3 is used as the default Pivot level.
Unlike the "Auto Fibonacci Levels", this variation does not update
Levels on current day even if the price goes past the R3/S3 levels.
Timeframes: 1D, 1W, 1M
Range = (High - Low) - From previous Day, Week or month.
FIB LEVELS:
- Yellow = Pivot and Pivot Zone (HLC3 by default)
- red = R1,S1 Levels 0.236 * Range
- Green = R2,S2 Levels 0.368 * Range
- Lime = R3,S3 Levels 0.618 * Range
- Blue = R4,S4 Levels 0.786 * Range
- Gray = R5,S5 Levels 1.000 * Range
- Lime = R6,S6 Levels 1.236 * Range
- Red = R7,S7 Levels 1.382 * Range
- Blue = R8,S8 Levels 1.618 * Range
- Green = R9,S9 Levels 2.000 * Range
CLASSIC LEVELS:
- Yellow = Pivot and Pivot Zone (HLC3)
- Green = R1,S1 Levels (Pivot*2 - Low), (Pivot*2 - High)
- Lime = R2,S2 Levels ( Pivot + Range), ( Pivot - Range)
- Lime = R3,S3 Levels (High + 2*( Pivot - Low)), (Low - 2*(High - Pivot ))
- Blue = R4,S4 Levels (High + 3*( Pivot - Low)), (Low - 3*(High - Pivot ))
Refrences:
- Auto Daily Fib Levels R3.0 by JustUncleL
- Auto Fib by TheYangGuizi
- Monthly Dynamic Range Levels (Fibonaci) V0 by RicardoSantos
Modifications:
- Added next FIB Levels. (changes during the current cycle)
- Added FIB 0.236 Levels
- Added Option to change the colors of the Fib Levels
- Changed Default colors to the colors of Tradingview
- Upgraded to Version4 Pinescript

[CP]Pivot Boss Floor Pivots with ATR Dilation and Dynamic LevelsINTRODUCTION:
Compared to all the Pivot Indicators available on Trading View Public Library, this Floor Pivots Indicator differentiates itself in two major original ways:
Dilates the Pivot Support/Resistance Levels into Support/Resistance Bands based on volatility
Displays the S/R Levels Dynamically , that is, only those levels will be shown that are close enough to the price resulting in much cleaner looking charts.
There were a few features whose logic I had figured out, but I could not implement them due Pine Script’s Limitation (they should really work on increasing Pine Script’s capacity instead of adding more and more features to the language in order to make it look ‘better’):
Showing multiple timeframe pivots at the same time (not possible due to Pine Script’s limitation on the ‘Max Number of Outputs’ )
Automatic Detection of highly profitable Double Hot Pivot Zones (DPZ), also due to the ‘Max Number of Outputs’ limit
GENERAL USER INPUTS:
Most of the settings are self-explanatory, however, a few of them need some explanation:
Show Floor Pivots Dynamically – This will turn ON the dynamic pivot levels, please note that this function will work ONLY IN INTRADAY timeframes.
Dynamic Pivot ATR Period – Period over which the ATR value is calculated to show the pivots dynamically.
ATR Threshold for Dynamic Floor Pivots – Simply put, the indicator will start displaying Pivot Levels if they fall within the 2*ATR distance (default value) of the price. You can increase this number if the volatility increases and vice-versa.
Use ATR to Dilate Intraday Pivot Levels – This will turn ON Floor Pivot Dilation, turning pivot ‘lines’ into ‘bands’ .
ATR Dilation Factor – This number decides the width of the Pivot bands. Larger this number, thicker the bands. Typically, high volatility stocks will require a higher number.
ATR Period – Same as Dynamic Pivot ATR Period, but for Pivot Level Dilation.
INDICATOR USAGE EXAMPLES:
This indicator works great in conjunction with my Pivot Boss Candlestick Scanner indicator.
There are a lot of optimizations I have done in the code, although it looks trivial at first glance, but it's fairly complex.
Feel free to use it and modify it as you wish.
Here are a few examples where the indicator has shown great entries and exits, with the default settings:
NIFTY 5m Chart
Reliance 5m Chart
Tesla 5m Chart
Bitcoin-USDT 15m Chart
FINAL WORDS:
Please understand that I have Cherry Picked the examples to showcase the capability of the indicator and its usage.
DO NOT conflate the accuracy of examples with the accuracy of this indicator.
Once you start using floor pivots, you will realize that a lot of days simply don’t give any high probability setups and you will simply sit out of the market and do nothing (which is a good thing).
If you really want to learn how to use Pivots, read the book ’Secrets of a Pivot Boss’ . This book can change your life.

Levels High LowEnglish:
Indicator for quickly identifying support and resistance levels. It is possible to use the parameter of the length of the upper and lower levels. The larger it is, the stronger the levels of the levels. The smaller it is, the less strong the levels are. It is possible to go back and turn off labels and lines. By default, the labels and lines are scale, and the length is 20.
Русский:
Индикатор предназначен для быстрого определения уровней поддержки и сопротивления. Есть возможность изменять параметр длинны верхних уровней и нижних. Чем он больше, тем более сильные уровни отображаются. Чем он меньше, тем менее сильные уровни отображаются. Есть возможность включать и отключать метки и линии. По умолчанию метки и линии отображаются, а длинна равна 20.

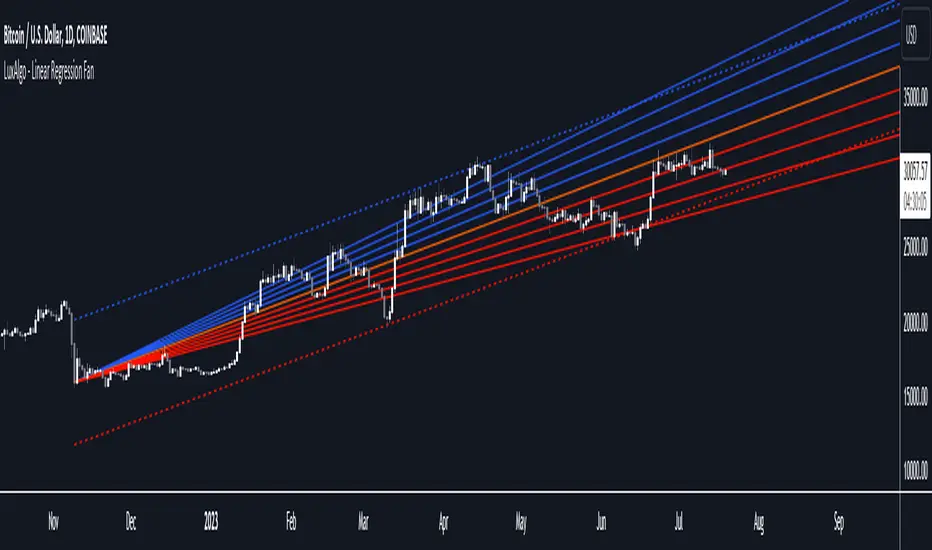
Linear Regression Fan [LuxAlgo]This indicator displays a fan using a linear regression fit to the price as a base. All lines are equidistant and are drawn from the first point of the linear regression to the most recent point of the linear regression plus the root-mean-square deviation (RMSD) multiplied by a certain factor.
Settings
Length: Lookback period for the linear regression.
Mult: Multiplier for the RMSD, allows returning wider fans.
Lines Per Side: Number of lines on each side of the fan.
Src: Input source of the indicator.
Usage
Traders often use the lines of fans to determine significant points of support or resistance at which they might expect price variations to reverse.
The length can be adjusted so that the starting point of the linear regression is located at a pivot high/low.
Some technical analysts use the measure rule of broadening wedges with fans when price breaks one of the extremities. This allows setting precise take-profits/stop-losses.
To learn more about the measure rule see:
On-chart Wavetrend Divergence with PivotsThis is an OnChart WaveTrend Divergence Indicator with Pivots and Alerts
LazyBears WaveTrend Indicator or also known as "Market Cipher" is an Indicator that is based on Moving Averages, therefore its an "lagging indicator". Lagging indicators are best used in combination with leading indicators. In this script the "leading indicator" component are Daily, Weekly or Monthly Pivots. These Pivots can be used as dynamic Support and Resistance, Stoploss, Take Profit etc.
This indicator combination is best used in larger timeframes. For lower timeframes you might need to change settings to your liking.
What are those circles?
-These are the WaveTrend Divergences. Red for Regular-Bearish. Orange for Hidden-Bearish. Green for Regular-Bullish. Aqua for Hidden-Bullish.
Please keep in mind that this indicator is a tool and not a strategy, do not blindly trade signals, do your own research first! Use this indicator in conjunction with other indicators to get multiple confirmations.

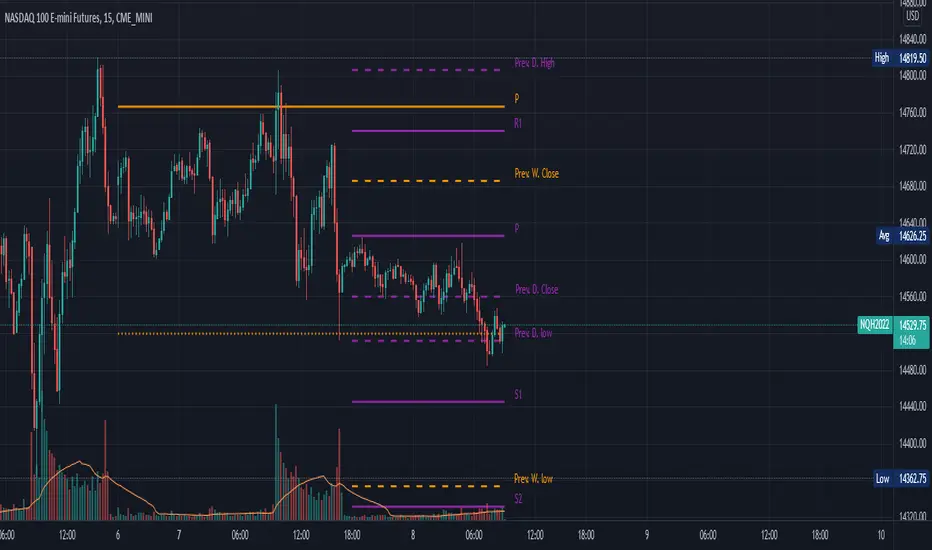
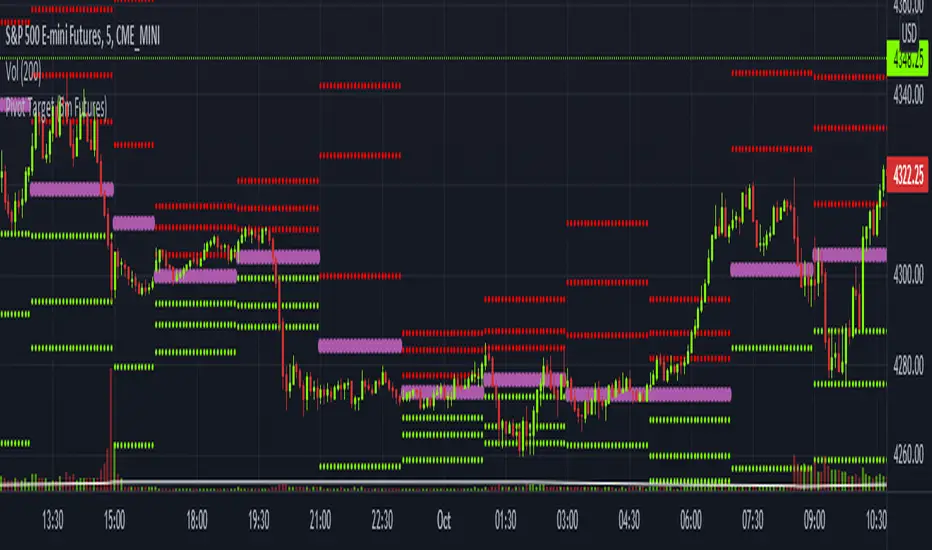
Pivot Target (5m Futures)I am new to both Futures Trading and Pivots. Looking for shorter-term profitable opportunities, I have investigated the use of pivots from a higher timeframe. All the work of this script is performed using two lines. It calculates the pivot from the previous 2-hour bar and draws this pivot line on the 5-minute timeframe. Many many times, the price will reach back to this pivot point - sometimes fairly quickly within the same horizontal pivot line and sometimes farther out (4-hours to 6-hours, or within the next few days). Price tends to reach the level around ninety percent of the time, making for plenty of short-term trading opportunities.
I get the best results when I see the price rise or fall from the pivot, along with a second indicator indicating a possible reversal (my favorite is Divergence for Many Indicators v4 by LonesomeTheBlue . Who knew divergence (both regular and hidden) was so common and useful for finding probable reversals? If I find the price above or below the pivot line with a second signal, I'll place a buy or sell within that same 2-hour window the price tends to return back to the higher timeframe pivot for a nice profit very quickly. Other times it does take a little longer to return with only a small percentage of time not returning within a reasonable amount of time, or very unusually, not at all. The image above shows a number of profitable trading opportunities using a combination of the Pivot Target and LonesomeTheBlue's Divergence for Many Indicators v4. You can further limit risk by only taking trades that are in the same direction of the overall trend, possibly confirmed on a higher timeframe.
This script will only be visible on the 5-minute timeframe the way it is written right now. I wouldn't suggest shorter or longer timeframes unless some editing is done by you. It doesn't seem to work as well with stocks, but is best on Futures due to the wave-like natures of the futures market. Trade safe, trade with the trend, use stops and limits appropriately and stay safe.
Pivot TrackerThis script finds swing lows and swing highs based on input criteria for lookback and lookforward periods, and plots letters accordingly.
Helps identify trend or lacktherof
HH = higher high
LH = lower high
HL = higher low
LL = lower low

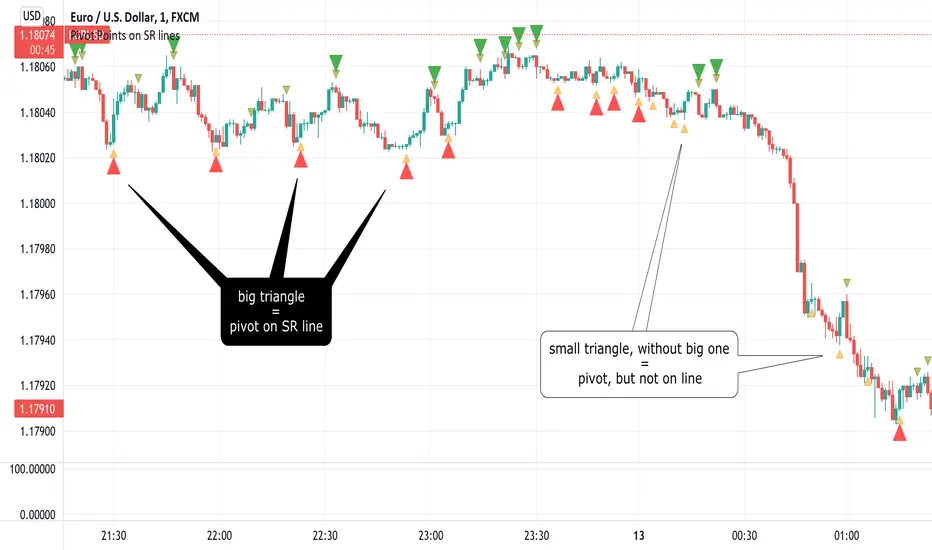
Pivot Points on SR linesAnalyzing price movements for a few years taught me one thing - markets always reverse bouncing off some horizontal Support/Resistance level. The only exception to this rule is when market pops new ATH (All Time High), which certainly happened in so-called "price discovery" run - this asset has never been in this space before, so no Support/Resistance could have been formed, while the rally had to stop at some point anyway.
In all other cases, analyzing past market movements, you will be able to find a place where the market reversed or gathered before. The difficulty is to understand (or guess?) from which S/R level market will reverse right now, because there are many of them. Even if this is probably not possible to make such guess correctly and always, it is good to know when potential reversal shown by whatever indicator you're using happened on SR line or in the middle of nowhere. That last case would turn out to be fake to your worst regrets. Ability to filter-out all those fake pivots is a value my indicator delivers.
Example? It is very often considered an entry signal when Stochastic %K and %D lines cross each other, especially in overbought/oversold area. It could work quite well in sideways markets, but when a trend begins, Stochastic would report CONSECUTIVE counter-trend signals, draining your trading balance to zero quickly. But this trend took place in price-discovery area (not necessarily when going for the new ATH ), so all those counter-trend signals happened not at S/R levels. Hence, they should be ignored.
Big triangles mark pivot point which happened on the S/R line. Small triangles - in the middle of nowhere.
How good is it? I compared it with one of my previous scripts, the "PivotPoints with Momentum confirmation" (), this new script confirms only 1/3 of pivots in the old script on 1m EURUSD chart. Filtering out 2/3 of potentially bad entries is a good result, I'd say :)
This script also fires alerts - alert is triggered as soon as PivotPoint is noticed, on a candle close.
I strongly recommend NOT using it not using this indicator as a standalone indicator. There is so much information you should take into consideration as well - market bias, volume , higher timeframe trend... To make it convenient to join PivotPoints information with other indicators, I have "exported" one plot so you can include it in your own - just use input.source in your own code to have it return 1 for PivotLow ( aka Long entry) and -1 for PivotHigh ( aka Short entry).
Pivot Points on SR lines DEMOAnalyzing price movements for a few years taught me one thing - markets always reverse bouncing off some horizontal Support/Resistance level. The only exception to this rule is when market pops new ATH (All Time High), which certainly happened in so-called "price discovery" run - this asset has never been in this space before, so no Support/Resistance could have been formed, while the rally had to stop at some point anyway.
In all other cases, analyzing past market movements, you will be able to find a place where the market reversed or gathered before. The difficulty is to understand (or guess?) from which S/R level market will reverse right now, because there are many of them. Even if this is probably not possible to make such guess correctly and always, it is good to know when potential reversal shown by whatever indicator you're using happened on SR line or in the middle of nowhere. That last case would turn out to be fake to your worst regrets. Ability to filter-out all those fake pivots is a value my indicator delivers.
Example? It is very often considered an entry signal when Stochastic %K and %D lines cross each other, especially in overbought/oversold area. It could work quite well in sideways markets, but when a trend begins, Stochastic would report CONSECUTIVE counter-trend signals, draining your trading balance to zero quickly. But this trend took place in price-discovery area (not necessarily when going for the new ATH ), so all those counter-trend signals happened not at S/R levels. Hence, they should be ignored.
Big triangles mark pivot point which happened on the S/R line. Small triangles - in the middle of nowhere.
How good is it? I compared it with one of my previous scripts, the "PivotPoints with Momentum confirmation" (), this new script confirms only 1/3 of pivots in the old script on 1m EURUSD chart. Filtering out 2/3 of potentially bad entries is a good result, I'd say :)
This script also fires alerts - alert is triggered as soon as PivotPoint is noticed, on a candle close.
I strongly recommend NOT using it not using this indicator as a standalone indicator. There is so much information you should take into consideration as well - market bias, volume , higher timeframe trend... To make it convenient to join PivotPoints information with other indicators, I have "exported" one plot so you can include it in your own - just use input.source in your own code to have it return 1 for PivotLow ( aka Long entry) and -1 for PivotHigh ( aka Short entry).

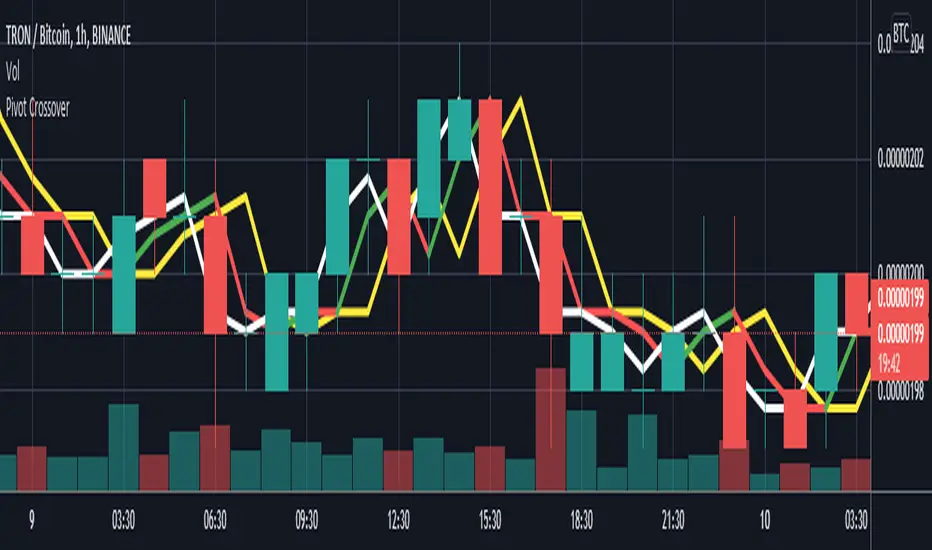
Pivot CrossoverThis indicator work on pivot point crossover. In this indicator use three pivot point
White color line is Pivot point for current bar.
Green/Red color line is Pivot point for last bar.
Yellow color line is Pivot point for 2nd last bar.
For long
if last pivot crossover above 2nd last pivot then go long
if current pivot crossover below last pivot then exit long
For short
if last pivot crossover below 2nd last pivot then go short
if last pivot crossover above last pivot then exit short
MTF Order Block FinderAn Order Block is a special type of pivot point that satisfies the following requirement:
A Bull/Bear candle followed by X consecutive candles in the opposite direction.
Order Blocks are interesting areas that are frequently revisited and can be treated as Support/Resistance levels.
Often, you can see explosive price rejection of these areas via long wicks, high volume, and rapid price change.
Features
Choose from two themes:
- LIGHT: a classic Red and Green representing Bearish and Bullish OBs, respectively
- DARK: a clean Blue and White scheme
Choose from two drawing styles:
- LINE: three lines representing the High, Low, and Mid price levels of the OB candle
- BOX: a bounded area similar to the "rectangle" tool
Chose a custom timeframe:
- From 1 Minute (useful for Seconds interval) up to 1 Month
Note, this setting is experimental and choosing a timeframe that is extraordinarily large may not function properly.
Filter order blocks with two settings:
- Number of consecutive bars
- Minimum % change of the potential OB bar (default 0.25%)
Keep your charts clean and show only relevant OBs
- Maximum number of Bullish zones to show
- Maximum number of Bearish zones to show
FAQ
Q: How do I trade with this indicator?
A:Personally, I use a fast entry indicator to confirm Long/Short position when price is rejected. I set my SL and TP based on the current Zone and the next one, if available.
Q: Does this repaint?
A:Yes and this is okay! The "Bear" and "Bull" signals are not meant for taking positions, only showing which candle reveals the Order Block. The Zone is much more useful to us and can result in several successful trades in the near future when treated as a support/resistance area.
Q What's the winrate?
A:Hard to say - this isn't a standalone strategy and I haven't been able to properly backtest it quite yet.

Volume Pressure Analysis - OverlayVolume Pressure Analysis is designed to show effort required to move price. This script is the overlay version that displays signals on the candles as well as changes the bar colors. Yellow arrows signal pressure in that direction and excessive amounts of volume is required to move price. These signals can lead to reversal/pivot points as price action struggles to continue its trend. Red and teal arrows indicate free flowing price action where very little effort or volume is needed to push price. These signals can confirm the beginning or continuation of a trend and is the natural direction the chart wants to travel at that time. For more information please check out the main Volume Pressure Analysis indicator.
