Power Earnings Gap Screener Pro [LevelUp]Customizable Pine Screener to scan for stocks with a Power Earnings Gap as well as accelerating earnings and sales. Historical analysis shows that strong earnings often trigger institutional buying, pushing prices higher and increasing the likelihood of sustained price gains.
🔹 Power Earnings Gap (PEG)
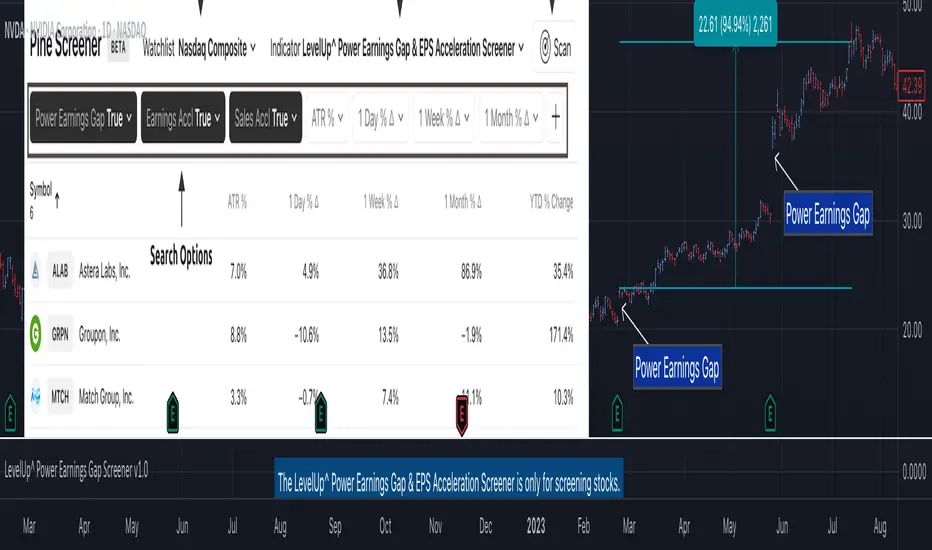
A power earnings gap refers to a significant price gap up after an earnings report, reflecting a rapid shift in investor sentiment and perceived value. It’s called "power" because the move is often sharp, sustained, and accompanied by high trading volume, signaling a potential trend continuation or reversal.
A gap is the difference between the closing price of a stock on the day before an earnings report and the opening price the next trading day. A power earnings gap typically exceeds a certain threshold (e.g., 8-10% or more) and is driven by earnings surprises, guidance changes, or other significant news.
Strong earnings beats, misses, or forward-looking guidance can trigger these gaps. For example, a company reporting higher-than-expected profits or raising guidance might gap up, while a miss or weak outlook could cause a gap down.
The gap is often accompanied by above-average trading volume, confirming the move's strength. Power gaps often lead to sustained price movement in the direction of the gap (continuation) or signal a reversal if the gap fills quickly.
How Power Earnings Gap Be Helpful
▪ Power earnings gaps often indicate strong momentum. Traders can capitalize on this by entering trades in the direction of the gap (e.g., buying on a gap-up if the trend continues).
Example: If a stock gaps up 10% after a stellar earnings report and shows high volume, traders might buy, expecting further upside as momentum builds.
▪ Breakout Opportunities: A gap through key technical levels (e.g., resistance or support) can signal a breakout. Traders use these gaps to identify potential long-term trends.
Example: A stock breaking above a resistance level on a power earnings gap may continue to rally, offering a setup for swing or position traders.
▪ Volatility for Short-Term Trades: Earnings gaps create heightened volatility, ideal for day traders or scalpers. The large price swings allow for quick profits if timed correctly.
Example: A trader might use options (e.g., calls for a gap-up, puts for a gap-down) to leverage the volatility around earnings.
▪ Confirmation of Fundamental Strength/Weakness: A power earning gap often reflects a fundamental shift, e.g., strong earnings growth or a major business development. Traders can use this to align technical setups with fundamental catalysts.
Example: A gap-up after a company raises its full-year guidance might signal a long-term buying opportunity.
▪ Risk Management and Stop Losses: Gaps provide clear levels for setting stop-loss orders. For instance, traders might place stops at or below the gap up bar low to protect against a potential reversal.
Example: If a stock gaps up from $100 to $110 and intraday hits a low of $105, a trader might set a stop at $105 or lower to limit downside risk.
▪ Gap Fill Strategies:Some traders bet on gaps filling, i.e., the stock returning to its pre-gap price. If a power earnings gap seems overextended (e.g., due to market overreaction), contrarian traders might short a gap-up or buy a gap-down, anticipating a pullback.
Example: A stock gaps up 15% but lacks volume or follow-through; a trader might short it, expecting the price to retreat.
🔹 Earnings and Sales Acceleration
Earnings and sales acceleration refers to the rate of growth in a company's earnings over consecutive quarters. It highlights companies that are not only growing but doing so at an accelerating pace, signaling improving financial health and operational momentum. This metric is derived from earnings reports, which detail a company’s financial performance.
Key Concepts
▪ Earnings Acceleration: When a company’s earnings per share (EPS) growth rate increases over time (e.g., EPS growth of 10% in Q1, 15% in Q2, 20% in Q3). It indicates improving profitability, often due to cost efficiencies, margin expansion and strong demand.
▪ Sales Acceleration: When revenue growth rates increase over time (e.g., revenue growth of 5% in Q1, 8% in Q2, 12% in Q3). This reflects rising demand for products/services and operational efficiency.
▪ Relation to Earnings Reports: Acceleration is calculated by comparing sequential quarter-over-year growth rates in earnings and sales, often highlighted in earnings reports or analyst commentary. It’s a sign of fundamental strength when both metrics accelerate together.
How It’s Helpful to Traders
▪ Identify High-Potential Stocks: Stocks with accelerating earnings and sales often attract investor attention, as they signal a company is outperforming expectations and gaining market share. This can lead to sustained price appreciation.
Example: A tech company reporting 20% EPS growth and 15% sales growth quarter-over-quarter may see bullish price action as investors bet on continued momentum.
▪ Momentum Trading Opportunities: Acceleration often fuels stock price momentum, especially post-earnings. Traders can ride these trends using technical setups like breakouts or pullbacks.
Example: A stock breaking above a key resistance level after reporting accelerating growth may be a buy signal for swing traders.
▪ Early Indicator of Breakouts: Companies with accelerating fundamentals are more likely to experience price breakouts, as institutional investors (e.g., hedge funds, mutual funds) pile in. Traders can use this to position early.
Example: A retailer with accelerating sales due to strong holiday demand might gap up post-earnings, offering a breakout trade.
▪ Confirmation of Fundamental Strength: Acceleration validates a company’s growth story, reducing the risk of investing in stocks with inconsistent performance. Traders can align technical trades with strong fundamentals.
Example: A biotech with accelerating sales from a new drug launch may sustain a rally, giving traders confidence in long positions.
▪ Volatility for Short-Term Trades: Earnings reports showing acceleration often lead to significant price gaps or volatility, creating opportunities for day traders or options traders.
Example: A trader might buy call options on a stock expected to report accelerating earnings, anticipating a sharp post-earnings move.
🔹 Power Earnings Gaps - Examples
🔹 Screening Features - Setting Your Search Criteria
Power Earnings Gap
▪ Search Range
How many bars back to search for Power Earnings Gaps, anywhere between 1 and 90 bars.
▪ Last Bar Only
Look only at the last bar for Power Earnings Gaps. This is useful when looking for PEGs when screening at the end of a trading day. Choosing this option, the Search Range will be ignored.
▪ Minimum Price % Gap Up From Prior Close
This is the minimum gap up percent change to be considered a Power Earnings Gap.
▪ Minimum Volume % Change Over Average
This is the minimum volume percent change, over the 50-day average volume, to be considered a Power Earnings Gap.
▪ Require Positive Surprise
Require a positive earnings surprise and the minimum percent change.
▪ Require Closing Range
To ensure the price action closed strong on the day, specify a preferred closing range as a percentage of the bar's daily range.
▪ Gap Up Bar
The gap up bar can be configured to require one of the following:
- Open Above Prior High - Ensures there is visible gap up from the prior bar.
- Low Above Prior High - Allows for intraday price action to go below the prior bar high.
- No Requirement
Earnings And Sales Acceleration
▪ Quarters of Acceleration
You can specify between 1 and 4 quarters of earnings and/or sales acceleration.
🔹 Installation And Usage
▪ Mark this indicator as a Favorite.
▪ Use the Pine Screener to search for stocks.
▪ Save the search results to a watchlist.
▪ View the watchlist in TradingView.
🔹 Note
▪ Risk of Reversals: Not all gaps sustain their direction. Over reactions can lead to gap fills.
▪ High Volatility: Earnings gaps can be unpredictable, requiring quick decision-making & discipline.
สคริปต์แบบชำระเงิน