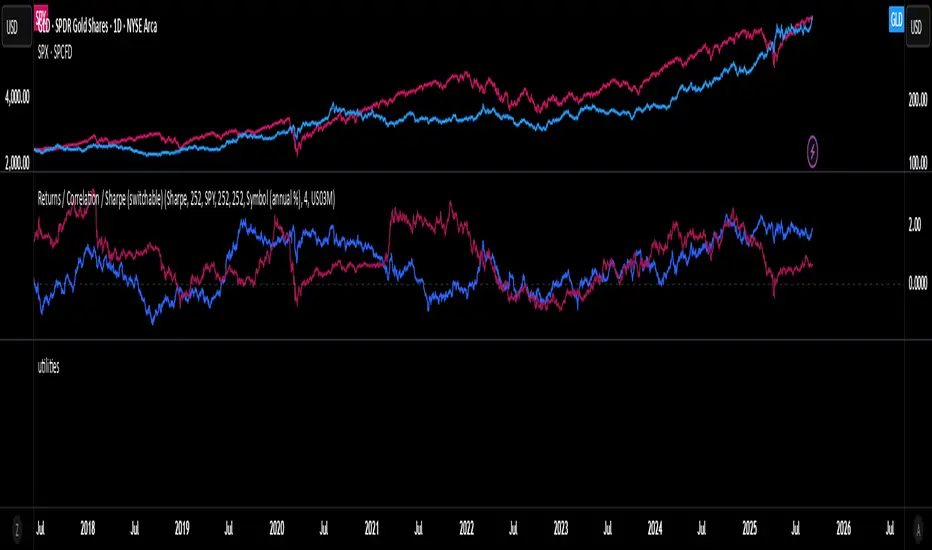
utilitiesLibrary for commonly used utilities, for visualizing rolling returns, correlations and sharpe
อินดิเคเตอร์และกลยุทธ์
MTF Options Signals (message-free)script made to help with options profitability. made using ai to increase portfolio profitability
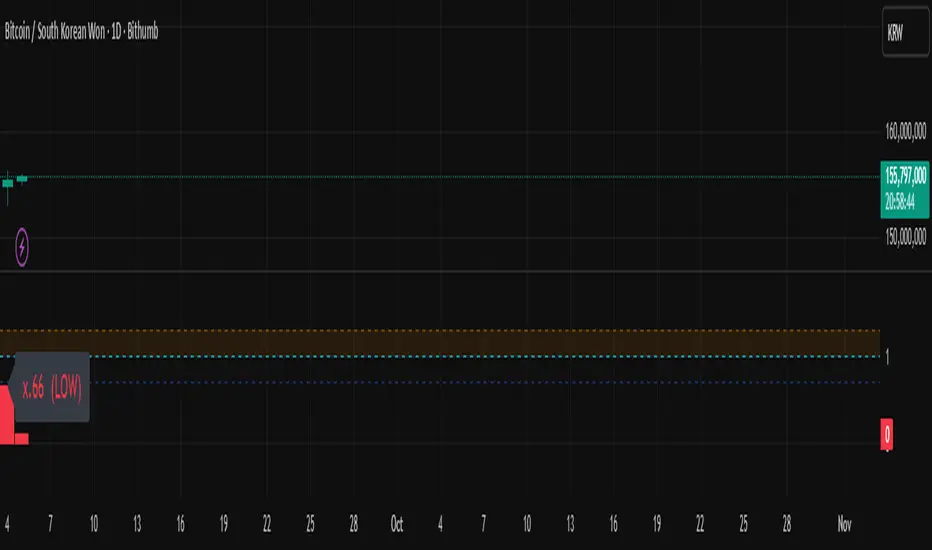
Daily Volume Ratio Bands (20MA)
Daily Volume Ratio Bands (20MA) — by CryptoDaily
This indicator normalizes daily trading volume against the recent 20-day moving average (20MA) and plots it as a volume ratio.
It allows traders to quickly identify whether current volume is strong, weak, or within a normal range compared to historical averages.
Key Features
Normalized volume ratio with 20-day average = baseline (1.0)
Clear bands for easy interpretation (1.0 ~ 1.3 = normal, above = overheated, below = weak)
Intuitive color coding:
🟨 Yellow: Normal range (1.0 ~ 1.3)
🔵 Blue: Above 1.3× average (high/strong volume, breakout confirmation)
⚪️ Gray: Below average (low volume)
🔴 Red: At or below 0.7× (extremely low volume / lack of interest)
How to Use
Breakouts with strong volume (Blue) → higher confidence in trend continuation
Gray/Red during consolidation → signal of weak momentum or sideways phase
Quickly assess whether the market is in overheated or low-activity conditions
Notes
Designed for Daily timeframe (1D) only. It will not function properly on intraday charts.
For educational purposes only. This is not financial advice.
Author
CryptoDaily (YouTube & TradingView)
YouTube channel: cryptodaily_tv
1H Candlestick vs EMA Crossover# Description — 1H Candlestick vs EMA Crossover (Pine Script)
This indicator is built in **TradingView Pine Script v5** and is designed to track the relationship between the **1‑hour candlestick close** and the **1‑hour Exponential Moving Average (EMA)**. It works on any chart timeframe but always pulls in **1H data** using `request. security`.
### Core Features
* **Customizable EMA length** (default = 200)
* **Plots the 1H EMA** as an orange line on your chart
* Optionally shows the **1H close** as a faint gray line for reference
* Detects and highlights when the **1H candle close crosses above or below the 1H EMA**
* **Arrows**: Green triangles appear below the bar when a bullish crossover happens (1H close > EMA); red triangles appear above the bar when a bearish crossover happens (1H close < EMA)
* **Alerts**: Built‑in `alert condition` statements let you create TradingView alerts whenever a crossover occurs
### How to Use
1. Adjust the EMA length if you want a faster or slower moving average.
2. Enable alerts: Right‑click the chart → Add Alert → choose this indicator and select either “crossed ABOVE EMA” or “crossed BELOW EMA.”
### Trading Applications
* **Trend Confirmation**: Use the 1H EMA as a higher‑timeframe filter while trading on lower timeframes.
* **Entry/Exit Signals**: Crossovers can mark potential entry points for trend continuation or reversals.
* **Scalping/Intraday**: Even on a 5m or 15m chart, you can overlay the 1H EMA to align your trades with the bigger trend.
This makes the indicator a simple yet powerful tool for aligning trades with higher‑timeframe momentum and avoiding false signals from lower‑timeframe noise.


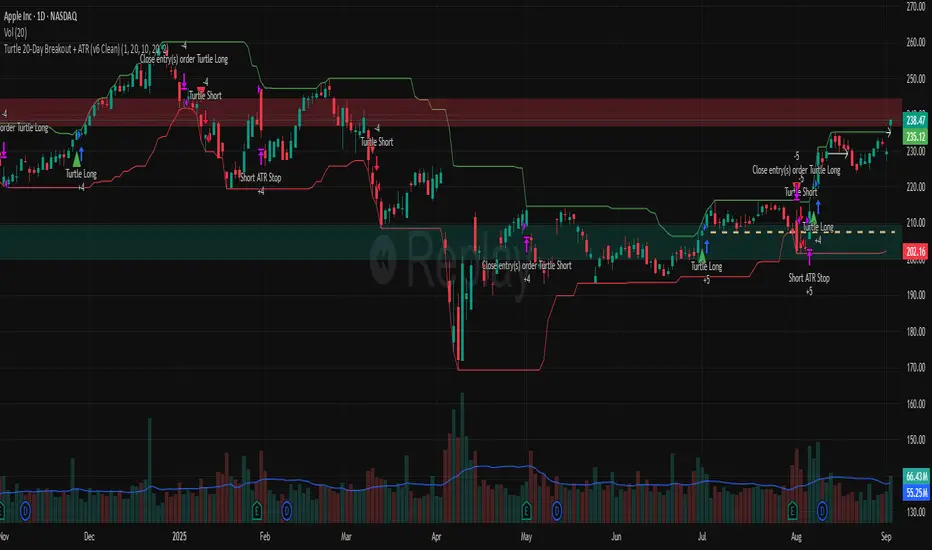
Turtle 20-Day Breakout + ATR (v6 Clean)20-bar breakout entries
ATR protective stops
Classic 10-bar opposite breakout exits
Proper plotting of breakout levels and stops
Signals on chart
Alert conditions in global scop
Custom Time LevelsBased on @TTrades_edu Important Time Levels For Trading video
www.youtube.com
Added candle coloring option as well.

RSI+MA by RAThis Indicator generates buy and sell signal on the crossover of RSI and MA, HTF RSI is also plotted for HTF trend.

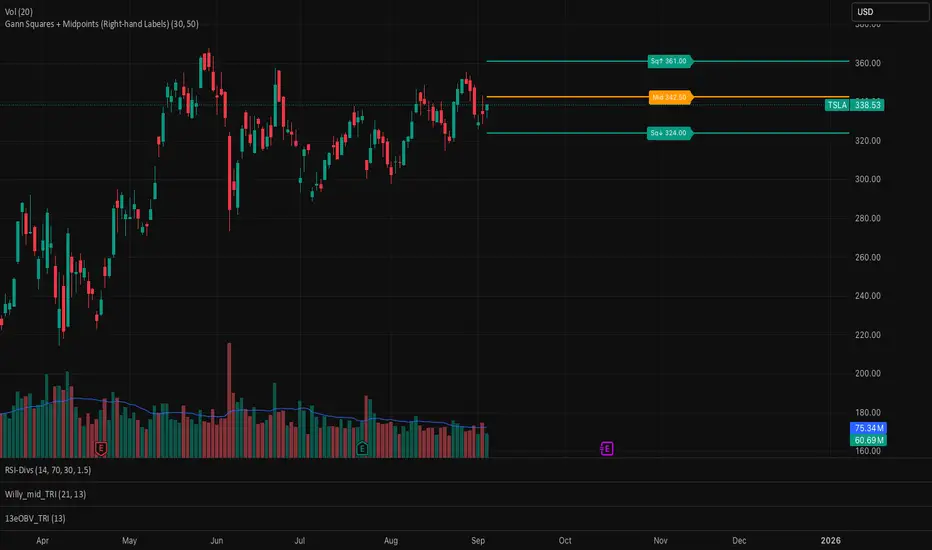
Gann Squares + Midpoints It gives Gann Square and a midpoint closest to the price which act as support and resistance
15-Min EMA CrossoverVery useful swing setup indicator that can be used in different styles of trading
Works on any timeframe but calculates EMA and cross signals based on 15-minute candles.
Plots the EMA line.
Shows green triangle for bullish crossover and red triangle for bearish crossunder.

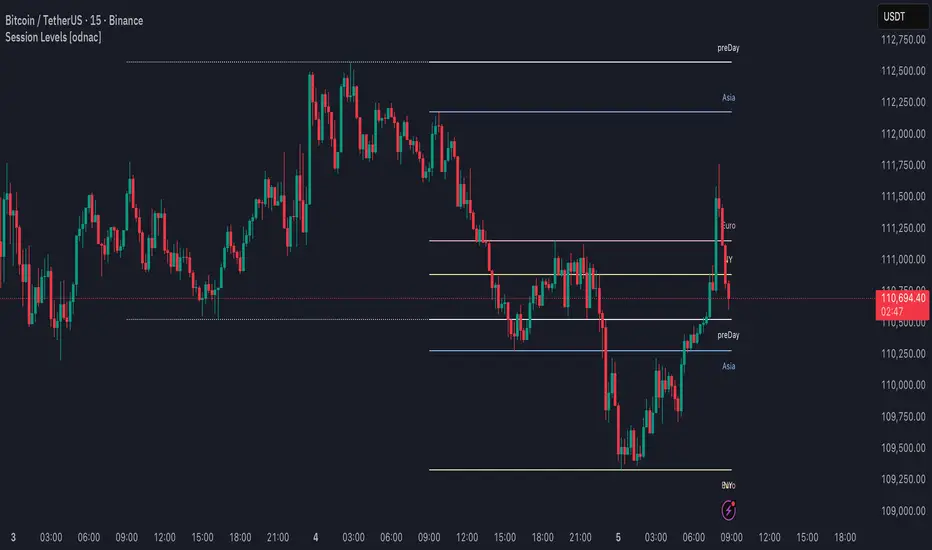
Session Levels [odnac]This indicator plots the high and low levels of the three main trading sessions—Asia, Europe, and New York—along with the previous day’s high, low, and open. Each session’s time range can be customized using a UTC offset, and the indicator automatically tracks session highs and lows as price develops.
Functions:
Plots session highs and lows for Asia, Europe, and New York.
Shows previous day’s high, low, and open as reference levels.
Session times are fully configurable with hour and minute precision, including UTC offset adjustment.
Each session level is marked with both a line and a label for clarity.
Color customization for each session and previous day levels.
Designed for intraday timeframes (1–60 minutes).
Filter Condition:
When the filter option is enabled, the indicator adjusts how levels are drawn:
A session high above the current close is displayed as a solid line with a visible label.
Once price closes above that high, the line becomes dotted and dimmed, and the label also becomes less emphasized.
Similarly, a session low below the current close is displayed as a solid line and label.
If price closes below that low, the line switches to dotted and dimmed, with the label adjusted accordingly.
This behavior highlights only the most relevant levels for the current market position while still keeping breached levels visible in a subdued style, making it easier to spot active breakout or liquidity zones.
EMA20 Cross Strategy with countertrades and signalsEMA20 Cross Strategy Documentation
Overview
The EMA20 Cross Strategy with Counter-Trades and Instant Signals is a Pine Script (version 6) trading strategy designed for the TradingView platform. It implements an Exponential Moving Average (EMA) crossover system to generate buy and sell signals, with optional trend filtering, session-based trading, instant signal processing, and visual/statistical feedback. The strategy supports counter-trades (closing opposing positions before entering new ones) and operates with a fixed trade size in EUR.
Features
EMA Crossover Mechanism:
Uses a short-term EMA (configurable length, default: 1) and a long-term EMA (default: 20) to detect crossovers.
A buy signal is generated when the short EMA crosses above the long EMA.
A sell signal is generated when the short EMA crosses below the long EMA.
Instant Signals:
If enabled (useInstantSignals), signals are based on the current price crossing the short EMA, rather than waiting for the candle close.
This allows faster trade execution but may increase sensitivity to price fluctuations.
Trend Filter:
Optionally filters trades based on the trend direction (useTrendFilter).
Long trades are allowed only when the short EMA (or price, for instant signals) is above the long EMA.
Short trades are allowed only when the short EMA (or price) is below the long EMA.
Session Filter:
Restricts trading to specific market hours (sessionStart, default: 09:00–17:00) if enabled (useSessionFilter).
Ensures trades occur only during active market sessions, reducing exposure to low-liquidity periods.
Customizable Timeframe:
The EMA calculations can use a higher timeframe (e.g., 5m, 15m, 1H, 4H, 1D, default: 1H) via request.security.
This allows the strategy to base signals on longer-term trends while operating on a shorter-term chart.
Trade Management:
Fixed trade size of €100,000 per trade (tradeAmount), with a maximum quantity cap (maxQty = 10,000) to prevent oversized trades.
Counter-trades: Closes short positions before entering a long position and vice versa.
Trades are executed with a minimum quantity of 1 to ensure valid orders.
Visualization:
EMA Lines: The short EMA is colored based on the last signal (green for buy, red for sell, gray for neutral), and the long EMA is orange.
Signal Markers: Displays buy/sell signals as arrows (triangles) above/below candles if enabled (showSignalShapes).
Background/Candle Coloring: Optionally colors the chart background or candles green (bullish) or red (bearish) based on the trend (useColoredBars).
Statistics Display:
If enabled (useStats), a label on the chart shows:
Total closed trades
Open trades
Win rate (%)
Number of winning/losing trades
Profit factor (gross profit / gross loss)
Net profit
Maximum drawdown
Configuration Inputs
EMA Short Length (emaLength): Length of the short-term EMA (default: 1).
Trend EMA Length (trendLength): Length of the long-term EMA (default: 20).
Enable Trend Filter (useTrendFilter): Toggles trend-based filtering (default: true).
Color Candles (useColoredBars): Colors candles instead of the background (default: true).
Enable Session Filter (useSessionFilter): Restricts trading to specified hours (default: false).
Trading Session (sessionStart): Defines trading hours (default: 09:00–17:00).
Show Statistics (useStats): Displays performance stats on the chart (default: true).
Show Signal Arrows (showSignalShapes): Displays buy/sell signals as arrows (default: true).
Use Instant Signals (useInstantSignals): Generates signals based on live price action (default: false).
EMA Timeframe (emaTimeframe): Timeframe for EMA calculations (options: 5m, 15m, 1H, 4H, 1D; default: 1H).
Strategy Logic
Signal Generation:
Standard Mode: Signals are based on EMA crossovers (short EMA crossing long EMA) at candle close.
Instant Mode: Signals are based on the current price crossing the short EMA, enabling faster reactions.
Trade Execution:
On a buy signal, closes any short position and opens a long position.
On a sell signal, closes any long position and opens a short position.
Position size is calculated as the minimum of €100,000 or available equity, divided by the current price, capped at 10,000 units.
Filters:
Trend Filter: Ensures trades align with the trend direction (if enabled).
Session Filter: Restricts trades to user-defined market hours (if enabled).
Visual Feedback
EMA Lines: Provide a clear view of the short and long EMAs, with the short EMA’s color reflecting the latest signal.
Signal Arrows: Large green triangles (buy) below candles or red triangles (sell) above candles for easy signal identification.
Chart Coloring: Highlights bullish (green) or bearish (red) trends via background or candle colors.
Statistics Label: Displays key performance metrics in a label above the chart for quick reference.
Usage Notes
Initial Capital: €100,000 (configurable via initial_capital).
Currency: EUR (set via currency).
Order Processing: Orders are processed at candle close (process_orders_on_close=true) unless instant signals are enabled.
Dynamic Requests: Allows dynamic timeframe adjustments for EMA calculations (dynamic_requests=true).
Platform: Designed for TradingView, compatible with any market supported by the platform (e.g., stocks, forex, crypto).
Example Use Case
Scenario: Trading on a 5-minute chart with a 1-hour EMA timeframe, trend filter enabled, and session filter set to 09:00–17:00.
Behavior: The strategy will:
Calculate EMAs on the 1-hour timeframe.
Generate buy signals when the short EMA crosses above the long EMA (and price is above the long EMA).
Generate sell signals when the short EMA crosses below the long EMA (and price is below the long EMA).
Execute trades only during 09:00–17:00.
Display green/red candles and performance stats on the chart.
Limitations
Instant Signals: May lead to more frequent signals, increasing the risk of false positives in volatile markets.
Fixed Trade Size: Does not adjust dynamically based on market conditions beyond equity and max quantity limits.
Session Filter: Simplified and may not account for complex session rules or holidays.
Statistics: Displayed on-chart, which may clutter the view in smaller charts.
Customization
Adjust emaLength and trendLength to suit different market conditions (e.g., shorter for scalping, longer for swing trading).
Toggle useInstantSignals for faster or more stable signal generation.
Modify sessionStart to align with specific market hours.
Disable useStats or showSignalShapes for a cleaner chart.
This strategy is versatile for both manual and automated trading, offering flexibility for various markets and trading styles while providing clear visual and statistical feedback.

Sunset Zones by PDVDescription
Sunset Zones by PDV is an intraday reference indicator that plots key horizontal levels based on selected “root candles” throughout the trading day. At each programmed time, the indicator identifies the high and low of the corresponding candle and projects those levels forward with extended lines, providing traders with a clean visual framework of potential intraday reaction zones.
These zones serve as reference levels for support, resistance, liquidity grabs, and session context, allowing traders to analyze how price reacts around time-specific structures. Unlike lagging indicators, Sunset Zones gives traders real-time, rule-based levels tied directly to the price action of specific moments in the session.
Key Features
Predefined Time Codes
The script comes with a curated list of intraday timestamps (in HHMM format). Each represents a “root candle” from which levels are generated. Examples include 03:12, 06:47, 07:41, 08:51, etc. These time codes can reflect historically important market moments such as session opens, liquidity sweeps, or volatility inflection points.
Automatic Zone Plotting
At each root time, the script captures the candle’s high and low and instantly extends those levels forward across the chart. This provides consistent, objective reference points for intraday trading.
Extended Lines
Levels are projected far into the future (default: 500 bars) so traders can easily track how price interacts with those zones throughout the day.
Color-Coded Levels
Each root time is assigned a distinct color for fast identification. For example:
03:12 → Fuchsia
06:47 → Purple
07:41 → Teal
08:51 → White
09:53 → White
10:20 → Orange
11:10 → Green
11:49 → Red
12:05 → White
13:05 → Teal
14:09 → Aqua
This helps traders quickly recognize which time-of-day level price is interacting with.
Lightweight & Visual
The indicator focuses purely on price and time, avoiding complexity or lagging signals. It can be layered with other analysis tools, order flow charts, or session-based studies.
Practical Use Cases
Intraday Bias:
Observe whether price respects, rejects, or consolidates around these reference levels to form a bias.
Liquidity Zones:
High/low sweeps of the root candle can act as liquidity pools where institutions might trigger stops or reversals.
Support & Resistance:
Extended lines create intraday S/R zones without the need to manually draw levels.
Confluence Finder:
Combine Sunset Zones with VWAP, session ranges, Fibonacci levels, or higher-timeframe structure for layered confluence.
Important Notes
This is a visual reference tool only. It does not generate buy or sell signals.
Default times are provided, but the concept is flexible — traders can adapt it by modifying or expanding the list of time codes.
Works best on intraday timeframes where session structure is most relevant (e.g., 1-minute to 15-minute charts).
✅ In short: Sunset Zones by PDV gives intraday traders a systematic way to anchor their charts to important time-based highs and lows, creating a consistent framework for analyzing price reactions across the day.

SMC Analysis - Fair Value Gaps (Enhanced)SMC Analysis - Fair Value Gaps (Enhanced) Script Summary
Overview
The "SMC Analysis - Fair Value Gaps (Enhanced)" script, written in Pine Script (version 6), is a technical analysis indicator designed for TradingView to identify and visualize Fair Value Gaps (FVGs) on a price chart. It supports both the main timeframe and multiple higher timeframes (MTF) for comprehensive market analysis. FVGs are price gaps formed by a three-candle pattern, indicating potential areas of market inefficiency where price may return to fill the gap.
Key Features
FVG Detection:
Identifies bullish FVGs: Occur when the high of a candle two bars prior is lower than the low of the current candle, with the middle candle being bullish (close > open).
Identifies bearish FVGs: Occur when the low of a candle two bars prior is higher than the high of the current candle, with the middle candle being bearish (close < open).
Visualizes FVGs as colored boxes on the chart (green for bullish, red for bearish).
Mitigation Tracking:
Tracks when FVGs are touched (price overlaps the gap range) or mitigated (price fully closes the gap).
Strict Mode: Marks an FVG as mitigated when price touches the gap range.
Normal Mode: Requires a full breakthrough (price crossing the gap’s bottom for bullish FVGs or top for bearish FVGs) for mitigation.
Optionally converts FVG box borders to dashed lines and increases transparency when partially touched.
Multi-Timeframe (MTF) Support:
Analyzes FVGs on three user-defined higher timeframes (default: 15m, 60m, 240m).
Displays MTF FVGs with distinct labels and slightly more transparent colors.
Ensures no duplicate processing of MTF bars to maintain performance.
Customization Options:
FVG Length: Adjustable duration for how long FVGs are displayed (default: 20 bars).
Show/Hide FVGs: Toggle visibility for main timeframe and each MTF.
Color Customization: User-defined colors for bullish and bearish FVGs (default: green and red).
Display Options: Toggle for showing dashed lines after partial touches and strict mitigation mode.
Performance Optimization:
Limits the number of displayed boxes (50 for main timeframe, 20 per MTF) to prevent performance issues.
Automatically removes older boxes to maintain a clean chart.
Functionality
Visualization: Draws boxes around detected FVGs, with customizable colors and text labels ("FVG" for main timeframe, "FVG " for MTF).
Dynamic Updates: Extends or terminates FVG boxes based on mitigation status and user settings.
Efficient Storage: Uses arrays to manage FVG data (boxes, tops, bottoms, indices, mitigation status, and touch status) separately for main and MTF analyses.
Use Case
This indicator is designed for traders using Smart Money Concepts (SMC) to identify areas of market inefficiency (FVGs) for potential price reversals or continuations. The MTF support allows analysis across different timeframes, aiding in confirming trends or spotting higher-timeframe support/resistance zones.

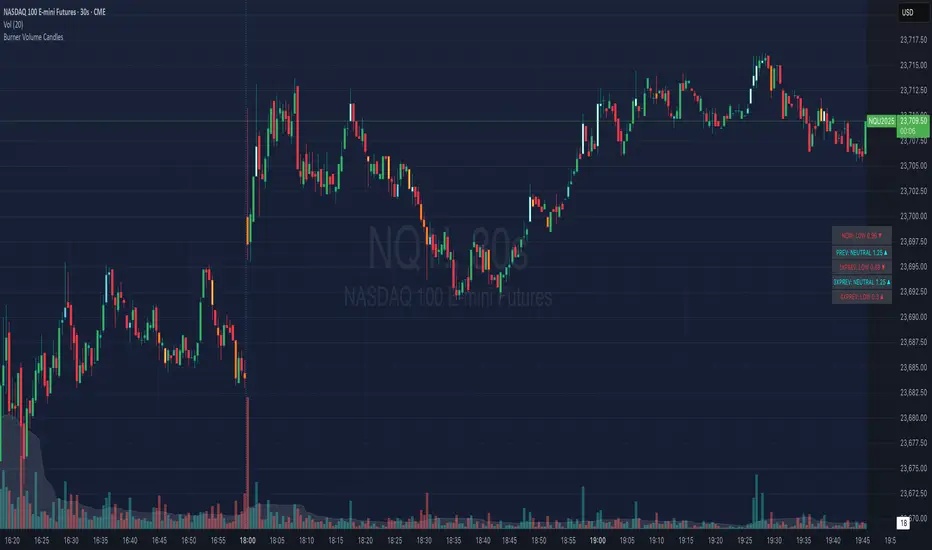
Burner Volume CandlesVisually see different candle colors based on volume relative to the look back period (default is last 20 candles).
This allows you to see if a current candle print is standard, high, or extreme sell/buy volume relative to the look back period.
This has been primarily used on the 30s timeframe on NQ.
It is also advised to take the NY open candle volume with a grain of salt as that is typically the extreme volume so it doesn't make this indicator as useful when it comes to those candles.
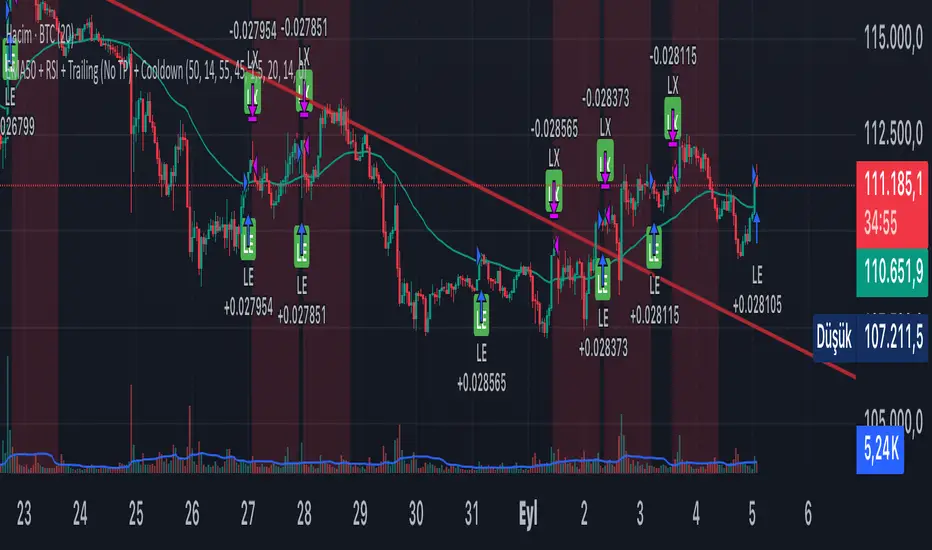
Optimized ADX DI CCI Strategy### Key Features:
- Combines ADX, DI+/-, CCI, and RSI for signal generation.
- Supports customizable timeframes for indicators.
- Offers multiple exit conditions (Moving Average cross, ADX change, performance-based stop-loss).
- Tracks and displays trade statistics (e.g., win rate, capital growth, profit factor).
- Visualizes trades with labels and optional background coloring.
- Allows countertrading (opening an opposite trade after closing one).
1. **Indicator Calculation**:
- **ADX and DI+/-**: Calculated using the `ta.dmi` function with user-defined lengths for DI and ADX smoothing.
- **CCI**: Computed using the `ta.cci` function with a configurable source (default: `hlc3`) and length.
- **RSI (optional)**: Calculated using the `ta.rsi` function to filter overbought/oversold conditions.
- **Moving Averages**: Used for CCI signal smoothing and trade exits, with support for SMA, EMA, SMMA (RMA), WMA, and VWMA.
2. **Signal Generation**:
- **Buy Signal**: Triggered when DI+ > DI- (or DI+ crosses over DI-), CCI > MA (or CCI crosses over MA), and optional ADX/RSI filters are satisfied.
- **Sell Signal**: Triggered when DI+ < DI- (or DI- crosses over DI+), CCI < MA (or CCI crosses under MA), and optional ADX/RSI filters are satisfied.
3. **Trade Execution**:
- **Entry**: Long or short trades are opened using `strategy.entry` when signals are detected, provided trading is allowed (`allow_long`/`allow_short`) and equity is positive.
- **Exit**: Trades can be closed based on:
- Opposite signal (if no other exit conditions are used).
- MA cross (price crossing below/above the exit MA for long/short trades).
- ADX percentage change exceeding a threshold.
- Performance-based stop-loss (trade loss exceeding a percentage).
- **Countertrading**: If enabled, closing a trade triggers an opposite trade (e.g., closing a long opens a short).
4. **Visualization**:
- Labels are plotted at trade entries/exits (e.g., "BUY," "SELL," arrows).
- Optional background coloring highlights open trades (green for long, red for short).
- A statistics table displays real-time metrics (e.g., capital, win rates).
5. **Trade Tracking**:
- Tracks the number of long/short trades, wins, and overall performance.
- Monitors equity to prevent trading if it falls to zero.
### 2.3 Key Components
- **Indicator Calculations**: Uses `request.security` to fetch indicator data for the specified timeframe.
- **MA Function**: A custom `ma_func` handles different MA types for CCI and exit conditions.
- **Signal Logic**: Combines crossover/under checks with recent bar windows for flexibility.
- **Exit Conditions**: Multiple configurable exit strategies for risk management.
- **Statistics Table**: Updates dynamically with trade and capital metrics.
## 3. Configuration Options
The script provides extensive customization through input parameters, grouped for clarity in the TradingView settings panel. Below is a detailed breakdown of each setting and its impact.
### 3.1 Strategy Settings (Global)
- **Initial Capital**: Default `10000`. Sets the starting capital for backtesting.
- **Effect**: Determines the base equity for calculating position sizes and performance metrics.
- **Default Quantity Type**: `strategy.percent_of_equity` (50% of equity).
- **Effect**: Controls the size of each trade as a percentage of available equity.
- **Pyramiding**: Default `2`. Allows up to 2 simultaneous trades in the same direction.
- **Effect**: Enables multiple entries if conditions are met, increasing exposure.
- **Commission**: 0.2% per trade.
- **Effect**: Simulates trading fees, reducing net profit in backtesting.
- **Margin**: 100% for long and short trades.
- **Effect**: Assumes no leverage; adjust for margin trading simulations.
- **Calc on Every Tick**: `true`.
- **Effect**: Ensures real-time signal updates for precise execution.
### 3.2 Indicator Settings
- **Indicator Timeframe** (`indicator_timeframe`):
- **Options**: `""` (chart timeframe), `1`, `5`, `15`, `30`, `60`, `240`, `D`, `W`.
- **Default**: `""` (uses chart timeframe).
- **Effect**: Determines the timeframe for ADX, DI, CCI, and RSI calculations. A higher timeframe reduces noise but may delay signals.
### 3.3 ADX & DI Settings
- **DI Length** (`adx_di_len`):
- **Default**: `30`.
- **Range**: Minimum `1`.
- **Effect**: Sets the period for calculating DI+ and DI-. Longer periods smooth trends but reduce sensitivity.
- **ADX Smoothing Length** (`adx_smooth_len`):
- **Default**: `14`.
- **Range**: Minimum `1`.
- **Effect**: Smooths the ADX calculation. Longer periods produce smoother ADX values.
- **Use ADX Filter** (`use_adx_filter`):
- **Default**: `false`.
- **Effect**: If `true`, requires ADX to exceed the threshold for signals to be valid, filtering out weak trends.
- **ADX Threshold** (`adx_threshold`):
- **Default**: `25`.
- **Range**: Minimum `0`.
- **Effect**: Sets the minimum ADX value for valid signals when the filter is enabled. Higher values restrict trades to stronger trends.
### 3.4 CCI Settings
- **CCI Length** (`cci_length`):
- **Default**: `20`.
- **Range**: Minimum `1`.
- **Effect**: Sets the period for CCI calculation. Longer periods reduce noise but may lag.
- **CCI Source** (`cci_src`):
- **Default**: `hlc3` (average of high, low, close).
- **Effect**: Defines the price data for CCI. `hlc3` is standard, but users can choose other sources (e.g., `close`).
- **CCI MA Type** (`ma_type`):
- **Options**: `SMA`, `EMA`, `SMMA (RMA)`, `WMA`, `VWMA`.
- **Default**: `SMA`.
- **Effect**: Determines the moving average type for CCI signal smoothing. EMA is more responsive; VWMA weights by volume.
- **CCI MA Length** (`ma_length`):
- **Default**: `14`.
- **Range**: Minimum `1`.
- **Effect**: Sets the period for the CCI MA. Longer periods smooth the MA but may delay signals.
### 3.5 RSI Filter Settings
- **Use RSI Filter** (`use_rsi_filter`):
- **Default**: `false`.
- **Effect**: If `true`, applies RSI-based overbought/oversold filters to signals.
- **RSI Length** (`rsi_length`):
- **Default**: `14`.
- **Range**: Minimum `1`.
- **Effect**: Sets the period for RSI calculation. Longer periods reduce sensitivity.
- **RSI Lower Limit** (`rsi_lower_limit`):
- **Default**: `30`.
- **Range**: `0` to `100`.
- **Effect**: Defines the oversold threshold for buy signals. Lower values allow trades in more extreme conditions.
- **RSI Upper Limit** (`rsi_upper_limit`):
- **Default**: `70`.
- **Range**: `0` to `100`.
- **Effect**: Defines the overbought threshold for sell signals. Higher values allow trades in more extreme conditions.
### 3.6 Signal Settings
- **Cross Window** (`cross_window`):
- **Default**: `0`.
- **Range**: `0` to `5` bars.
- **Effect**: Specifies the lookback period for detecting DI+/- or CCI crosses. `0` requires crosses on the current bar; higher values allow recent crosses, increasing signal frequency.
- **Allow Long Trades** (`allow_long`):
- **Default**: `true`.
- **Effect**: Enables/disables new long trades. If `false`, only closing existing longs is allowed.
- **Allow Short Trades** (`allow_short`):
- **Default**: `true`.
- **Effect**: Enables/disables new short trades. If `false`, only closing existing shorts is allowed.
- **Require DI+/DI- Cross for Buy** (`buy_di_cross`):
- **Default**: `true`.
- **Effect**: If `true`, requires a DI+ crossover DI- for buy signals; if `false`, DI+ > DI- is sufficient.
- **Require CCI Cross for Buy** (`buy_cci_cross`):
- **Default**: `true`.
- **Effect**: If `true`, requires a CCI crossover MA for buy signals; if `false`, CCI > MA is sufficient.
- **Require DI+/DI- Cross for Sell** (`sell_di_cross`):
- **Default**: `true`.
- **Effect**: If `true`, requires a DI- crossover DI+ for sell signals; if `false`, DI+ < DI- is sufficient.
- **Require CCI Cross for Sell** (`sell_cci_cross`):
- **Default**: `true`.
- **Effect**: If `true`, requires a CCI crossunder MA for sell signals; if `false`, CCI < MA is sufficient.
- **Countertrade** (`countertrade`):
- **Default**: `true`.
- **Effect**: If `true`, closing a trade triggers an opposite trade (e.g., close long, open short) if allowed.
- **Color Background for Open Trades** (`color_background`):
- **Default**: `true`.
- **Effect**: If `true`, colors the chart background green for long trades and red for short trades.
### 3.7 Exit Settings
- **Use MA Cross for Exit** (`use_ma_exit`):
- **Default**: `true`.
- **Effect**: If `true`, closes trades when the price crosses the exit MA (below for long, above for short).
- **MA Length for Exit** (`ma_exit_length`):
- **Default**: `20`.
- **Range**: Minimum `1`.
- **Effect**: Sets the period for the exit MA. Longer periods delay exits.
- **MA Type for Exit** (`ma_exit_type`):
- **Options**: `SMA`, `EMA`, `SMMA (RMA)`, `WMA`, `VWMA`.
- **Default**: `SMA`.
- **Effect**: Determines the MA type for exit signals. EMA is more responsive; VWMA weights by volume.
- **Use ADX Change Stop-Loss** (`use_adx_stop`):
- **Default**: `false`.
- **Effect**: If `true`, closes trades when the ADX changes by a specified percentage.
- **ADX % Change for Stop-Loss** (`adx_change_percent`):
- **Default**: `5.0`.
- **Range**: Minimum `0.0`, step `0.1`.
- **Effect**: Specifies the percentage change in ADX (vs. previous bar) that triggers a stop-loss. Higher values reduce premature exits.
- **Use Performance Stop-Loss** (`use_perf_stop`):
- **Default**: `false`.
- **Effect**: If `true`, closes trades when the loss exceeds a percentage threshold.
- **Performance Stop-Loss (%)** (`perf_stop_percent`):
- **Default**: `-10.0`.
- **Range**: `-100.0` to `0.0`, step `0.1`.
- **Effect**: Specifies the loss percentage that triggers a stop-loss. More negative values allow larger losses before exiting.
## 4. Visual and Statistical Output
- **Labels**: Displayed at trade entries/exits with arrows (↑ for buy, ↓ for sell) and text ("BUY," "SELL"). A "No Equity" label appears if equity is zero.
- **Background Coloring**: Optionally colors the chart background (green for long, red for short) to indicate open trades.
- **Statistics Table**: Displayed at the top center of the chart, updated on timeframe changes or trade events. Includes:
- **Capital Metrics**: Initial capital, current capital, capital growth (%).
- **Trade Metrics**: Total trades, long/short trades, win rate, long/short win rates, profit factor.
- **Open Trade Status**: Indicates if a long, short, or no trade is open.
## 5. Alerts
- **Buy Signal Alert**: Triggered when `buy_signal` is true ("Cross Buy Signal").
- **Sell Signal Alert**: Triggered when `sell_signal` is true ("Cross Sell Signal").
- **Usage**: Users can set up TradingView alerts to receive notifications for trade signals.

MTF FVG Confluence v6 — JSON Alerts via alert()This strategy combines multi-timeframe confluence with candlestick analysis and fair value gaps (FVGs) to generate structured long/short entries. It aligns Daily and 4H EMA trends with 1H MACD momentum, then confirms with engulfing candles and FVG zones for precision entries. Risk management is built-in, featuring stop-loss, 3R take-profit targets, and optional break-even logic, with dynamic JSON alerts for webhook automation.
Categories:
Candlestick analysis
Chart patterns
Cycles

Fear & Greed [theUltimator5]This indicator attempts to replicate CNN's Fear & Greed Index methodology to measure market sentiment on a scale from 0-100. It combines seven key market components into a single sentiment score, where lower values indicate fear and higher values indicate greed.
Note: It is impossible to perfectly replicate the true Fear & Greed indicator due to data limitations, so this indicator attempts to best replicate the output for each of the (7) components using available data.
The uniqueness of this indicator comes from the calculation methods for the 7 components as well as the visual representation of the data, which includes a table and selectable plots for each of the 7 components which make up the overall sentiment. Existing variants of the Fear & Greed Index have substantial flaws in the calculations of several of the components which result in warped final sentiment numbers. This indicator attempts to better track all 7 components and provide a closer model to the actual Fear & Greed index.
Here are the seven components and a brief description of how each are calculated:
1. Market Momentum
Calculation: S&P 500 current price vs. 125-day moving average
Measures how far the market has moved from its long-term trend
Uses CNN-style Z-score normalization over 252 trading days
Higher values indicate strong upward momentum (greed)
Lower values suggest declining momentum (fear)
2. Stock Strength
Calculation: S&P 500 RSI scaled to 252-day range
Uses 14-period RSI of the S&P 500 index
Normalizes RSI values based on their 252-day minimum and maximum
Measures overbought/oversold conditions relative to recent history
Higher values indicate overbought conditions (greed)
Lower values suggest oversold conditions (fear)
3. Price Breadth
Calculation: Modified McClellan Oscillator
Primary: Uses NYSE advancing vs. declining issues with 7-day smoothing
Fallback: Compares sector performance (QQQ, IWM vs. SPY)
Measures how many stocks participate in market moves
Broader participation indicates healthier trends
Narrow breadth suggests selective or weak trends
4. Put/Call Ratio
Calculation: Inverted CBOE Put/Call ratios
Primary: CBOE Equity-only Put/Call ratio (more sensitive)
Fallback: CBOE Total Put/Call ratio
Uses 5-day average and applies CNN normalization
Higher put/call ratios indicate fear (inverted to lower scores)
Lower put/call ratios suggest complacency (higher scores)
5. Market Volatility
Calculation: VIX relative to its 50-day average
Compares current VIX level to its 50-day moving average
Measures deviation from normal volatility expectations
Higher VIX relative to average indicates fear (lower scores)
Lower relative VIX suggests complacency (higher scores)
6. Safe Haven Demand
Calculation: Stock returns vs. bond yield changes
Compares 20-day smoothed S&P 500 returns to Treasury yield changes
When stocks outperform bonds, indicates risk appetite (higher scores)
When bonds outperform stocks, suggests risk aversion (lower scores)
Uses Treasury 10-year yields as the safe haven benchmark
7. Junk Bond Demand
Calculation: High-yield bond spread analysis
Measures yield spread between junk bonds (JNK ETF) and Treasuries
Compares current spread to its 5-day average
Narrowing spreads indicate risk appetite (higher scores)
Widening spreads suggest risk aversion (lower scores)
The combined sentiment is plotted as a single line which changes color based on the current sentiment value.
0-25: Extreme Fear (Red) - Market panic, oversold conditions
26-45: Fear (Orange) - Cautious sentiment, bearish bias
46-55: Neutral (Yellow) - Balanced market sentiment
56-75: Greed (Light Green) - Optimistic sentiment, bullish bias
76-100: Extreme Greed (Green) - Market euphoria, potentially overbought
There are dashed lines to represent the threshold values for each of the sentiments to better visualize transitions.
The table displays each of the (7) components of the index and their respective values. The table can be toggled on/off and the position can be moved.
An optional secondary line can be toggled on to display (1) of the (7) components as a unique color and the component name and value will highlight on the table. The secondary line can be used to dig into the main driving forces behind the overall index value.


Markov 3D Trend AnalyzerMarkov 3D Trend Analyzer
🔹 What Is a Markov State?
A Markov chain models systems as states with probabilities of transitioning from one state to another. The key property is memorylessness: the next state depends only on the current state, not the full past history. In financial markets, this allows us to study how conditions tend to persist or flip — for example, whether a green candle is more likely to be followed by another green or by a red.
🔹 How This Indicator Uses It
The Markov 3D Trend Analyzer tracks three independent Markov chains:
Direction Chain (short-term): Probability that a green/red candle continues or reverses.
Volatility Chain (mid-term): Probability of volatility staying Low/Medium/High or transitioning between them.
Momentum Chain (structural): Probability of momentum (Bullish, Neutral, Bearish) persisting or flipping.
Each chain is updated dynamically using exponentially weighted probabilities (EMA), which balance the law of large numbers (stability) with adaptivity to new market conditions.
The indicator then classifies each chain’s dominant state and combines them into an actionable summary at the bottom of the table (e.g. “📈 Bullish breakout,” “⚠️ Choppy bearish fakeouts,” “⏳ Trend squeeze / possible reversal”).
🔹 Settings
Direction Lookback / Volatility Lookback / Momentum Lookback
Control the rolling window length (sample size) for each chain. Larger = smoother but slower to adapt.
EMA Weight
Adjusts how much weight is given to recent transitions vs. older history. Lower values adapt faster, higher values stabilize.
Table Position
Choose where the table is displayed on your chart.
Table Size
Adjust the font size for readability.
🔹 How To Consider Using
Contextual tool: Use the summary row to understand the current market condition (trending, mean-reverting, expanding, compressing, continuation, fakeout risk).
Complementary filter: Combine with your existing strategies to confirm or filter signals. For example:
📈 If your breakout strategy fires and the summary says Bullish breakout, that’s confirmation.
⚠️ If it says Choppy fakeouts, be cautious of traps.
Visualization aid: The table lets you see how probabilities shift across direction, volatility, and momentum simultaneously.
⚠️ This indicator is not a signal generator. It is designed to help interpret market states probabilistically. Always use in conjunction with broader analysis and risk management.
🔹 Disclaimer
This script is for educational and informational purposes only. It does not constitute financial advice or a recommendation to buy or sell any security, cryptocurrency, or instrument. Trading involves risk, and past probabilities or behaviors do not guarantee future outcomes. Always conduct your own research and use proper risk management.


dabilThe strategy is probably to go short or long with the trend depending on the case, but if all time units 1 minute then 3 minutes then 5 minutes then 15 minutes then 1 hour all show the same direction, but first the 1 hour must be bullish in which the 1 hour candle closes above the previous one, for example if the trend is bearish then the market wants to change direction, then a 1 hour bullish close must then be followed by a 1 hour bearish close below the bullish candle, then another bullish candle must shoot above the previous bullish candle, then 15 minutes also shoot above the previous 15 bullish candles, then 1 and 2...3.5. Then I can rise with the market by only covering the last 15 bullish candles with my stop loss, if my SL is 50 pips then I want 100 pips and then I'm out.
