อินดิเคเตอร์และกลยุทธ์
Options Volume IndicatorShows the RSI volume based on options volume. Useful for comparing against asset buy and sell signals to see strength of demand for recent options.

Absolute VWAP and EMA9 Difference indicator - TF Pascal
The Absolute VWAP–EMA9 Difference indicator measures the absolute distance between the session’s VWAP and the EMA 9, highlighting the magnitude of separation regardless of direction. A 100-period moving average of this difference shows the typical distance. Low values indicate price near fair value and low momentum, while high values suggest strong momentum or overextension.
built for the M1 chart

Rolling Cumulative Volume Delta (N bars)Rolling CVD, not anchored to a date and reset after anchor+period reached

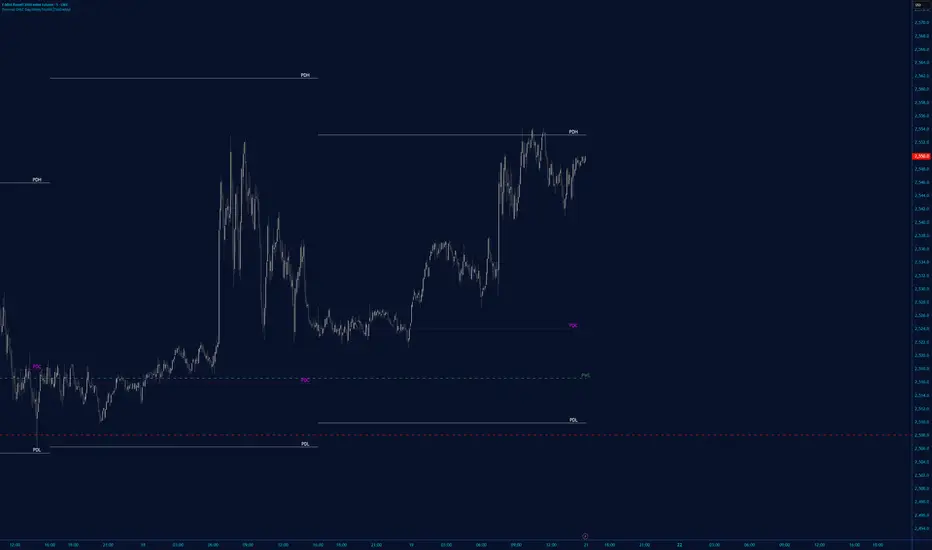
Rango Pre-Apertura (8am-9am)Overview
This indicator is specifically designed for the index trading community, with a focus on US30 (Dow Jones). It centers on the concepts of "Capital Injection" and "Opening Traps," automatically identifying the most critical liquidity levels prior to the New York Open (09:30 AM EST).
Indicator Logic
The script operates on the premise that the range formed between 08:00 AM and 09:00 AM EST acts as a key accumulation or manipulation zone before the official session. By marking these levels, traders can visualize where institutional algorithms are likely to seek liquidity before the day’s primary expansive move begins.
Key Features
08:00 - 09:00 AM Range: Automatically calculates and projects the exact High and Low of this pre-market window.
Previous Day Levels (PDH/PDL): Identifies the Previous Day High and Low as primary zones for External Liquidity (BSL/SSL).
Visual Clarity: Lines are projected only until 01:00 PM EST to keep the chart clean for post-session analysis.
Professional Styling: Uses non-continuous plots to avoid visual noise and diagonal line "bleeding" between trading days.
How to Trade with this Script
Mapping: Identify whether the price opens above or below the 8:00 AM range.
The Trap: Look for liquidity sweeps (Stop Runs) of the marked lines exactly at 09:30 AM.
Confirmation: Combine this indicator with price action to detect "Force Invalidations" (Engulfing patterns) at H1 or H4 Points of Interest (POI).

Prop ES EMA Cross during Single/Dual Trading SessionEMA crossover strategy for ES futures optimized for prop firm rules.
Choose long-only, short-only, or both directions.
Customizable short and long EMA lengths.
Enter trades during one or two configurable sessions specified in New York time.
Fixed TP/SL in ticks with forced close by 4:59 PM NY time.

EMA & Stochastic SignalsEma 200 and ema 500 + stochastic crossover. Buys when price is above emas and sells when price is below emas.

VOLD RatioThis indicator calculates the ratio between NYSE Up Volume and Down Volume (USI:UVOL / USI:DVOL).
It helps assess market participation and short-term buying vs. selling pressure.
Higher values indicate dominant buying volume, while lower values suggest increasing selling pressure.
Useful as a breadth and confirmation tool alongside index price action.

New York Sessions High/Low with Liquidity Purge CriteriaDisplays horizontal lines at the highest high and lowest low of the NY AM (09:30–12:00) and NY PM (13:30–16:00) sessions in New York time.
Lines extend forward until price strongly breaks them by a user-defined threshold (N points), at which point they cease extending - liquidity purged.
Option to show only active lines (unpurged liquidity) - toggle to hide old liquidity pools for a cleaner chart.
Customizable colors, line styles, width, lookback days and purge threshold.

Michael Mor - ATRMichael Mor -ATR is a clean, lightweight chart watermark that gives you key stock context at a glance — without cluttering your chart or covering price action.
It’s designed for traders who want essential fundamentals + recent performance visible directly on the chart, in a subtle, professional style.
What it shows
You can toggle each line on or off:
Company name (optional market cap: M / B / T)
Symbol & timeframe
Sector & industry
ATR (14) with percentage of price and a quick volatility indicator
🟢 low volatility
🟡 medium volatility
🔴 high volatility


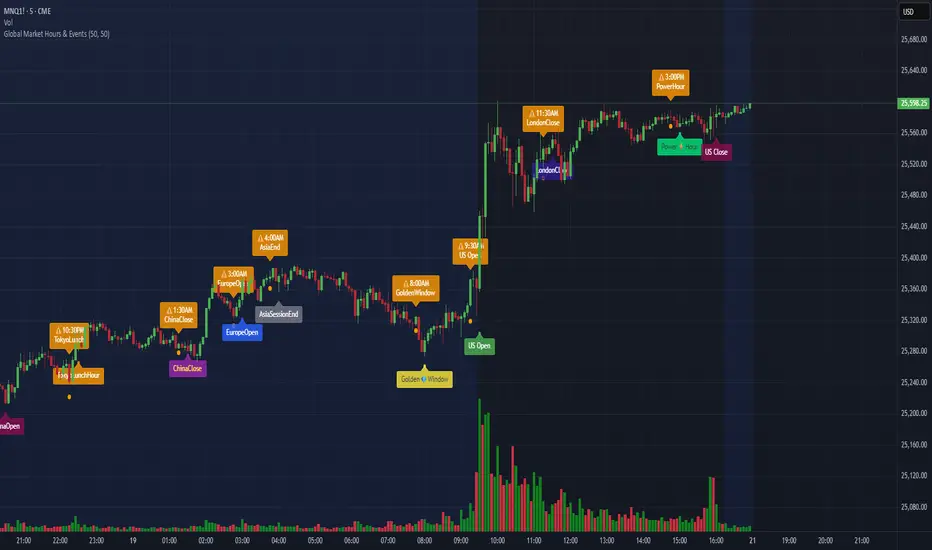
Global Market Hours & Eventswww.tradingview.com
Global Market opens and closes and other related events,
15min warning ahead of time, visual indicator for warning and for the event
not over-crowded with the possibility to remove labels and have just a little circle marker.
Adjustements for labels and circles are in the settings
Activate Pane Label to identify
Candles by Day of WeekCandles by Day of Week
Candles by Day of Week (INLINE) is a lightweight visual indicator that colors price candles based on the day of the week.
It helps traders quickly recognize weekly patterns, market behavior differences, and day-specific tendencies directly on the chart.
🔹 Key Features
Candle coloring for Monday through Sunday
Enable or disable each weekday individually
Custom color selection for every day
Day enable toggle and color input are combined in one line for cleaner settings
Uses barcolor() — no candle shifting or overlay issues
Compatible with all markets: Forex, Crypto, Stocks, Indices
Works on all timeframes
🔹 How It Works
The indicator detects the day of the week for each candle and applies the selected color if that day is enabled.
Disabled days keep the chart’s default candle colors unchanged.
This approach ensures:
No interference with price data
No displacement from the main chart
Full compatibility with other indicators
🔹 Practical Use
Analyze weekday-based market behavior
Spot recurring patterns or volatility by day
Improve discretionary and session-based strategies
Enhance chart readability and visual clarity
🔹 Notes
Saturday and Sunday candles are mainly relevant for Crypto markets
Forex traders may choose to disable weekend days
The indicator is purely visual and does not affect calculations or signals
🔹 Customization
All settings can be adjusted in the indicator’s Inputs:
Toggle individual days on or off
Select custom candle colors per day
Instantly adapt the indicator to your trading style
🔹 Disclaimer
This indicator is intended for visual analysis only and should be used as a supportive tool alongside other forms of technical analysis.
It does not provide buy or sell signals.

Trinity Swing Trading Buy and SellThis is a simple little Heiken Ashi MA + ADX & MACD trend-following trading system designed to capture medium- to longer-term moves while filtering out noise and weak trends. It combines modified Heiken Ashi candles (for smoother trend detection) with a moving average alignment, plus optional confirmation from ADX (trend strength) and MACD (momentum).
In practice, the indicator works well on higher timeframes (e.g., 1H, 4H, daily) where trends are more sustained. It performs best in trending markets and naturally avoids choppy/range-bound conditions thanks to the ADX filter (requiring ADX > 20 by default). All key components are fully customizable, so you can disable filters or adjust parameters to suit different instruments (stocks, forex, crypto, futures).
Default settings are:
16 HMA
8,17,9 MACD
15,20 ADX
Recommend to add an additional longer term EMA like 200 for long term trend confirmation.
Adjust inputs in the settings panel as needed:
Toggle MA, ADX, or MACD filters on/off.
Change MA type/length, MACD parameters, ADX threshold
- Use the visual blue diamonds (below bars) for long entries and purple diamonds (above bars) for short entries as confirmation of signals.
- Set alerts on the "Buy Alert" and "Sell Alert" conditions if you want real-time notifications.
This setup gives you a complete, rule-based system that avoids emotional trading and repetitive entries, making it suitable for both backtesting and live trading with proper risk management.

Multiple Time Frame Stoch-RSIThis indicator is designed to show users the values for default stochastic RSI and default RSI settings across multiple time frames.
I have made many bad trades focusing too closely on one particular time frame and indicators that suggest the price will move one way, to be superseded by a higher timeframe pushing price in another direction.
The timeframes are customisable so you can select your own timeframes, but the default timeframes chosen here are part of the BareNaked Crypto or Naked Nation strategy, looking at timeframes in multiples of 3 for lower timeframes.
The idea in its simplest form is that when timeframes like the 3/6/9m are all over sold or over bought (coloured red or green) then it could be a suitable time to place an order. Or at least be more favourable for your trade.
This indicator as with all indicators is designed as a tool to add to whatever arsenal of strategy or tools you are already using and does not constitute financial advice, just be cause 3/6/9m is in red or green does not guarantee that the trade will go your way.
The orange on the timeframes are generally designed to show users where price can reverse so for example if the stochastic 3m is at 10 and in green, but the 9m is at 65 in orange, it could be that a push up is not finished and the 9m drop from oversold to 65 could be reversed due to a low 3m stochastic number and then 9m goes from 65 back up to 100, and vice versa.
The arrows for direction also allow you to quickly deduce the direction of the stochastic RSI, ^ up, V down, and stable -. this should allow you to see if the stochastic has been rising and is beginning to turn around or not.

RSI Strategy with Auto Tuner (PF)# RSI Auto‑Tuner Strategy — How To Use
This document explains **how to use** the RSI Auto‑Tuner strategy. It intentionally avoids math and implementation details. Follow this as an operating guide.
---
## 1. What This Tool Is For
This strategy helps you:
* Discover **which RSI length works best** on a given ticker and timeframe
* Measure performance using **Profit Factor (PF)**
* Improve RSI performance on noisy markets by **transforming price first**
The auto‑tuner is a **research tool**, not a live trading signal generator.
---
## 2. Two Modes You Must Treat Differently
### Research Mode
Used to explore and discover parameters.
* Auto‑Tune: **ON**
* Parameters are allowed to change
* Results may look very good
* Overfitting risk is real
### Trading Mode
Used for forward testing or live trading.
* Auto‑Tune: **OFF**
* Parameters are fixed
* Behavior is stable and repeatable
* This is the only acceptable mode for live use
**Never trade live with Auto‑Tune enabled.**
---
## 3. Manual Mode (Trading Mode)
Use this after parameters are finalized.
Steps:
1. Set **Auto‑Tune = OFF**
2. Choose:
* Source (raw price or transformed price)
* RSI Length (manual, default 14)
* Oversold / Overbought levels
3. The strategy will:
* Enter long when RSI crosses up through Oversold
* Enter short when RSI crosses down through Overbought
* Flip positions on opposite signals
This mode is predictable and safe for forward testing.
---
## 4. Auto‑Tune Mode (Research Mode)
Use this to find optimal RSI lengths.
Steps:
1. Set **Auto‑Tune = ON**
2. Configure the search range:
* Minimum Length (default 5)
* Maximum Length (default 14)
* Step Size (default 1)
3. The strategy will:
* Internally simulate trades for each RSI length
* Track gross profit, gross loss, and trades
* Select the length with the highest Profit Factor
4. The best length is applied automatically
Auto‑Tune evaluates historical data only.
---
## 5. Using a Transform on Price (Critical)
RSI does **not** have to run on raw price.
You can significantly improve results by:
* Applying a **price transform** first
* Feeding the transformed series into the RSI Source input
Examples of transforms:
* Moving averages
* Low‑pass filters
* Butterworth filters
* Any smoother or denoiser
Why this works:
* Busy, wicky markets cause RSI to whipsaw
* Transforms remove micro‑noise
* RSI responds to structure instead of chaos
* Profit Factor often increases dramatically
Best practice:
* Auto‑tune on raw price
* Auto‑tune on transformed price
* Compare PF, trade count, and stability
---
## 6. Reading the Status Label
At the last bar, the on‑chart label shows:
* Whether Auto‑Tune is ON or OFF
* Whether candidates were built successfully
* Number of RSI lengths tested
* Best RSI length found
* Profit Factor and trade count
If Auto‑Tune is OFF, the label shows the manual length.
---
## 7. Recommended Workflow
1. Choose ticker and timeframe
2. Enable Auto‑Tune on **raw price**
3. Record best RSI length and PF
4. Enable Auto‑Tune on **transformed price**
5. Compare results
6. Lock parameters
7. Disable Auto‑Tune
8. Forward test
---
## 8. Warnings and Discipline
* High PF with few trades is unreliable
* Transforms can hide execution costs
* Always validate on a different period
* Auto‑Tune is a **lens**, not an edge
Treat this tool as a research microscope, not an autopilot.


MA150 RespectRatio NoamzThis indicator measures how reliably price respects the 150-day moving average as support.
It computes an empirical probability (Respect Ratio) based on historical interactions with MA150:
– Dynamic touch tolerance based on ATR
– Optional shallow breaks allowed (user-defined)
– Trend filter (MA150 rising + price above)
– Minimum event count for statistical reliability
The output is a probability score (0–1) indicating how often MA150 held as support when tested.
This tool is intended for research and decision support, not as a standalone trading signal.

PrimeFib_constants_v1Library "PrimeFib_constants_v1"
PrimeFib / GoldenWhirl constants (Pine Library). Versioning is handled via TradingView publish versions.
GOLDEN_RATIO()
GOLDEN_RATIO_INV()
PI()
INV_PI()
PHI_SPIRAL()
PHI7()
PHI7_INV()
PSI_PF()
PSI_PF_INV()
LAMBDA_PF()
RHO_PF_THEO()
RHO_BTC_EMP()
RHO_CME_EMP()
RHO_PF_EMP()
RHOT()

extradestrategy super BTCUSD M15cocok untuk btc usd tidak di perjual belikan harap tidak menggunakan sembarangan

Ram Key Levels (Daily Horizontals) + Day SeparatorsRam Key Levels (Daily Horizontals) + Day Separators

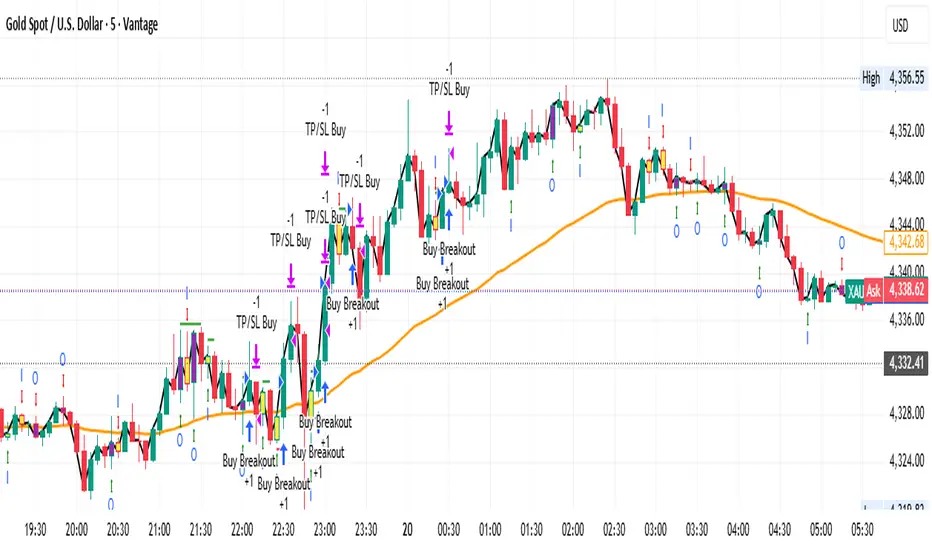
Gold M5 Scalping (Strategy)This is the New Strategy for my new Indicator for M5 Scalping.
Just to test my result.
Will release my indicator soon