Po3 Candle OpensMarks out the 9:30 / 9:45 / 10:00 / 10:15 / 10:30 candle opening.
You can turn off certain times in the settings, if not needed.
The colors are also customizable.
อินดิเคเตอร์และกลยุทธ์

10 / 100 Moving Average Crossover/@version=5
indicator("10 / 100 Moving Average Crossover with Alerts", overlay=true)
// === User Inputs ===
fastLength = input.int(10, title="Fast MA Period", minval=1)
slowLength = input.int(100, title="Slow MA Period", minval=1)
// === Moving Averages ===
fastMA = ta.ema(close, fastLength)
slowMA = ta.ema(close, slowLength)
// === Plot Moving Averages ===
plot(fastMA, title="Fast MA", color=color.green, linewidth=2)
plot(slowMA, title="Slow MA", color=color.red, linewidth=2)
// === Crossover Conditions ===
buySignal = ta.crossover(fastMA, slowMA)
sellSignal = ta.crossunder(fastMA, slowMA)
// === Buy Label ===
if buySignal
label.new(bar_index, low, "BUY", style=label.style_label_up, color=color.green, textcolor=color.white, size=size.small)
// === Sell Label ===
if sellSignal
label.new(bar_index, high, "SELL", style=label.style_label_down, color=color.red, textcolor=color.white, size=size.small)
// === Alerts ===
alertcondition(buySignal, title="BUY Alert", message="BUY Signal: Fast MA crossed ABOVE Slow MA")
alertcondition(sellSignal, title="SELL Alert", message="SELL Signal: Fast MA crossed BELOW Slow MA")

Big Move V-Reversals//@version=5
indicator("Big Move V-Reversals", overlay=true, max_boxes_count=100)
// --- Inputs ---
atrLen = input.int(14, "ATR Period")
minMoveSize = input.float(2.0, "Min Move Size (ATR Multiplier)", tooltip="Price must move at least this many ATRs to consider it a 'Big Move'")
deleteMode = input.string("Wick", "Delete Zone On:", options= )
// Colors
colorSupply = color.new(color.red, 80)
colorDemand = color.new(color.green, 80)
// --- Logic: Measuring the "Big Move" ---
atr = ta.atr(atrLen)
// Track the distance price has moved without a major reversal
var float runHigh = high
var float runLow = low
var int runStartBar = bar_index
// Detect Streaks
isGreen = close > open
isRed = close < open
var int greenStreak = 0
var int redStreak = 0
greenStreak := isGreen ? greenStreak + 1 : 0
redStreak := isRed ? redStreak + 1 : 0
// Arrays for box management
var box supplyBoxes = array.new_box()
var box demandBoxes = array.new_box()
// --- V-Bottom (Big Drop + 3 Green) ---
// 1. We find the lowest point of a recent significant drop
if low < runLow
runLow := low
runStartBar := bar_index
// 2. If we get 3 green candles, check if the preceding drop was "Big"
if greenStreak == 3
float dropSize = high - runLow // High before the turn to the low
if dropSize > (atr * minMoveSize)
dz_box = box.new(left=runStartBar, top=high , right=bar_index, bottom=runLow,
bgcolor=colorDemand, border_color=color.green, extend=extend.right)
array.push(demandBoxes, dz_box)
// Reset tracking
runLow := low
// --- V-Top (Big Rally + 3 Red) ---
// 1. We find the highest point of a recent significant rally
if high > runHigh
runHigh := high
runStartBar := bar_index
// 2. If we get 3 red candles, check if the preceding rally was "Big"
if redStreak == 3
float rallySize = runHigh - low
if rallySize > (atr * minMoveSize)
sz_box = box.new(left=runStartBar, top=runHigh, right=bar_index, bottom=low ,
bgcolor=colorSupply, border_color=color.red, extend=extend.right)
array.push(supplyBoxes, sz_box)
// Reset tracking
runHigh := high
// --- Auto-Remove Overrun Zones ---
if array.size(supplyBoxes) > 0
for i = array.size(supplyBoxes) - 1 to 0
bx = array.get(supplyBoxes, i)
if (deleteMode == "Wick" ? high > box.get_top(bx) : close > box.get_top(bx))
box.delete(bx)
array.remove(supplyBoxes, i)
if array.size(demandBoxes) > 0
for i = array.size(demandBoxes) - 1 to 0
bx = array.get(demandBoxes, i)
if (deleteMode == "Wick" ? low < box.get_bottom(bx) : close < box.get_bottom(bx))
box.delete(bx)
array.remove(demandBoxes, i)

V-Max: Crypto Scaling & Professional Risk Calculator🛡️ 【V-Max】Crypto Scaling & Professional Risk Calculator
Overview The V-Max Crypto Scaling & Risk Calculator is a professional-grade execution utility designed to automate capital allocation and risk management. It enables traders to instantly determine the mathematically correct position size based on their specific risk tolerance and market volatility.
Technical Methodology & Logic This script functions as a real-time risk engine using the following calculation models:
Dynamic Lot Sizing: The position size is calculated using the formula: (Total Capital * Risk Percentage) / Stop Loss Distance. This ensures that every trade adheres to a fixed monetary risk regardless of price fluctuations.
Triple SL Logic:
3M Range: A proprietary SMA-based average range (High-Low) over a 20-period lookback.
ATR: Utilizes the Average True Range for volatility-adjusted stops.
Structural Pivot: Automatically identifies the lowest low (for longs) or highest high (for shorts) within a user-defined lookback window.
Low Volatility Safeguard: The script monitors the current market range against a user-defined threshold. If volatility drops below the "Choke Zone," a visual warning is triggered, suggesting a wider SL multiplier to prevent "stop-hunting" in illiquid conditions.
How to Use
Input your total capital and the percentage you are willing to risk (e.g., 1.5%).
Select your preferred SL source and multiplier.
The dashboard will display the exact suggested quantity and stop-loss price.
產品概述 V-Max 加密貨幣風控計算機是一款專業級執行工具,旨在將資金分配與風險管理自動化。它能幫助交易者根據特定的風險承受能力與市場波動率,即時計算出數學上正確的建倉數量。
技術邏輯與功能 本腳本透過以下運算模型實現即時風險控管:
動態倉位計算:採用 (總保證金 * 風險百分比) / 止損距離 的公式,確保每筆交易的損失金額固定,不受價格波動影響。
三種止損模式:提供 3M 平均波幅、ATR 指標以及自動偵測結構高低點(結構 K 低點/高點)。
低波動防護機制:監測當前波幅是否低於「窒息區」門檻。若波動過低,系統將發出警告並建議調大止損倍數,以避免在流動性不足時被惡意掃損。
This is a free utility from the V-Max strategic suite.
Premium Access: For L1-L3 professional indicators, please contact our authorized assistant: @VMax_Helper_bot.
Disclaimer: For educational and technical analysis purposes only. Not financial advice.

Custom Psych Levels V1.0 Theo SignalDesigned for Index Traders (US30, NAS100, SPX, etc.)
This script is especially effective on indices such as US30, where price reacts strongly to round numbers and psychological zones. By default, levels adapt to index volatility and scale, making them ideal for:
intraday bias
pullback reactions
breakout continuation
mean reversion back to balance
Key Features
Rolling 5-Level Structure: Always centered on current price, no chart clutter.
Market- Aware Magnitude: Automatically adjusts spacing for indices, forex, and crypto.
Higher- Timeframe Anchoring: Optionally anchor levels to 1H, 4H, or Daily closes while trading lower timeframes like 5m.
Session & Daily Resets: Re-anchor levels at New York session open or new trading day.
Center Line Emphasis: Highlight the equilibrium level with custom color, thickness, and style for balance or decision-making.
Clean Professional Display: Only relevant levels near price are shown.
Trading Use Cases
This indicator is best used as a framework, not a signal generator. It excels when combined with:
momentum confirmation
liquidity sweeps
volume expansion
break-and-retest structures
session highs/lows
Traders can use the center line as balance, outer levels as reaction or target zones, and band shifts as confirmation of expanding price acceptance.

MACD Classic MT5 Style (2 Lines + Histogram)MACD Classic MT5 Style (แบบ MetaTrader 5) มีความแตกต่างจาก MACD ทั่วไปที่ใช้กันใน TradingView พอสมควรครับ นี่คือคำอธิบายว่ามันทำงานอย่างไรและอ่านค่าอย่างไรครับ:
1. ความแตกต่างสำคัญ (Key Difference)
MACD ทั่วไป (Standard):
มี 2 เส้น (เส้น MACD และ เส้น Signal)
ฮิสโตแกรม (แท่งกราฟ) คือ ส่วนต่าง (Gap) ระหว่าง 2 เส้นนั้น
MACD แบบ MT5 (Classic MT5):
เส้น MACD จะถูกวาดออกมาเป็น แท่งกราฟ (Histogram) แทนที่จะเป็นเส้น
เส้น Signal จะเป็น เส้น (Line) สีแดงพาดผ่านแท่งกราฟ
สรุปคือ: ในแบบ MT5 แท่งกราฟคือตัวพระเอก (MACD) ส่วนเส้นคือตัวช่วยกรอง (Signal)
Here is the English translation of the explanation:
MACD Classic MT5 Style vs. Standard MACD
The "Classic MT5 Style" MACD differs significantly from the standard MACD typically found on TradingView. Below is an explanation of its mechanics and how to interpret it.
1. Key Differences
Standard MACD (TradingView Default):
Displays 2 Lines (MACD Line and Signal Line).
The Histogram represents the difference (gap) between those two lines.
MT5 Style MACD (Classic):
The MACD value is plotted as a Histogram (bars) instead of a line.
The Signal Line appears as a standard Line (usually red) overlaying the histogram.
In summary: In the MT5 style, the Histogram represents the actual MACD Line, while the separate line acts as the Signal filter.

UM Premarket Volume DashboardSUMMARY
Do you track the largest percent movers in the premarket?
Instantly compare current premarket volume to its recent average with built-in trend confirmation.
⸻
DESCRIPTION
This indicator is a compact premarket intelligence dashboard that combines live volume analysis with adaptive trend detection. It highlights unusually strong premarket activity while confirming directional bias using either a Nadaraya–Watson Estimator (NWE) or traditional moving averages.
The goal is to quickly identify symbols that are both active and aligned with trend before the regular trading session begins.
⸻
HOW IT WORKS
• Calculates average daily volume using a 50-day rolling average
• Tracks live premarket volume between 04:00–09:30 (exchange time)
• Computes a rolling average of prior premarket sessions and blends in the current day’s partial premarket volume in real time
• Highlights premarket volume in dark green when it exceeds both a user-defined threshold and the rolling premarket average
• Determines bullish or bearish trend status using a selectable method:
• Nadaraya–Watson Estimator (NWE)
• EMA, WMA, or SMA
• Trend status is based on directional slope (current value vs prior bar)
• Displays percent gain from the previous regular-session close (4:00pm ET)
• Shows total shares outstanding for quick liquidity context (when available)
⸻
DEFAULT SETTINGS
• Trend Method: Nadaraya–Watson Estimator (NWE)
• NWE Lookback Window (h): 8
• NWE Relative Weighting (r): 8
• Regression Length: 120 bars
• Premarket Average Days: 10
• Premarket Green Volume Threshold: 50,000 shares
• Average Daily Volume: 50-day SMA
• Trend Source: Close
⸻
SUGGESTED SETTINGS AND USES
• Use the default NWE settings for smoother, adaptive trend confirmation, especially on lower timeframes (1–5 minute charts) during premarket
• Switch to EMA or WMA if you prefer faster trend flips or want behavior consistent with MA-based systems
• Increase the Premarket Volume Threshold for large-cap stocks or ETFs to reduce noise
• Decrease the threshold for small-cap stocks to surface early momentum names
Ideal for:
• Premarket gap scanners
• Momentum continuation setups
• Liquidity confirmation before market open
• Building dynamic watchlists for the opening bell
This indicator is best used as a filtering and confirmation tool, not as a standalone entry signal.

PDH/PDL Breakout Pip MeasurerThe indicator tracks and measures daily breakout performance when price breaks the Previous Day's High (PDH) or Previous Day's Low (PDL). This indicator provides exact pip/point measurements of how far breakouts travel before hitting your stop-loss, with comprehensive statistics for strategy optimization.
Function
Tracks breakouts above PDH (Previous Day's High) and below PDL (Previous Day's Low)
Measures maximum distance price travels after breakout before stop-loss hit
Calculates exact pip/point gains for every breakout move
Provides statistical analysis of breakout performance over time
Identifies only first breakout of each day for clean signals
Performance Metrics
Exact pip measurement for every breakout move
Statistics table with Count, Average, Min, Max pips
Separate tracking for bullish and bearish breakouts
Historical performance accumulation over time
Active breakout monitoring in real-time
Settings
Adjustable pip multiplier - works with any instrument (Forex, indices, crypto)
Separate stop-loss settings for bull/bear breakouts
Visual control - show/hide levels, labels, table
Built-in alerts for breakout notifications

UVOL Thrust TrackerUVOL Thrust Tracker identifies institutional breadth thrusts using NYSE up-volume as a percentage of total volume (USI:UVOL / USI:TVOL), plotted directly on price.
The indicator highlights:
TRUE 90% UVOL thrusts (rare, high-conviction breadth events)
Surrogate thrust clusters (multi-day 80–89% participation)
Cluster failures (momentum that fails to expand)
Structural thrust failures (2022-style false starts)
A regime filter based on the chart symbol’s moving averages separates bull vs bear environments, dynamically adjusting thresholds and failure logic.
This tool is designed for regime confirmation and risk management, not short-term entries. TRUE thrusts typically confirm trend continuation, while failures warn when breadth support breaks down.
Note: This indicator is intended for regime and risk assessment, not precise entries or exits.

LJ Parsons Adjustable expanding MRT Fib Version 2Based on premium/discount/fair-value levels the indicator will expand with the market by settable dates.
The levels are not fib based as such but are resonant levels within an multiplicative /12 log scale using the LJ Parsons Market resonance hypothesis.

Easy DashboardREAD DISCLAIMER BELOW BEFORE USE
The ultimate TradingView dashboard for tracking up to 24 tickers in real-time. Stay on top of your P&L, Volatility (ATR), and Earnings countdown without ever leaving your chart.
Total Privacy: No hardcoded data. Input your holdings privately via the settings menu.
Risk Control: Built-in "traffic light" system for ATR % and Volume % to spot volatility and institutional activity.
Earnings Alerts: Automated countdowns that turn red when an Earnings Report is less than 7 days away.
Complete Wealth View: Live tracking of Daily P&L, Cash, and Total Net Worth.
Clean UI: Fully customizable positions, text sizes, and a "Minimal Mode" for a distraction-free workspace.
DISCLAIMER
IMPORTANT: READ BEFORE USE
This indicator is provided for educational and informational purposes only.
Not Financial Advice: The information, metrics, and calculations displayed by this script do not constitute financial, investment, or trading advice.
Not an Inducement: Nothing within this script should be construed as a recommendation or an inducement to buy, sell, or hold any financial instrument.
Accuracy & Risks: While every effort is made to ensure technical accuracy, trading involves significant risk of loss. Past performance is not indicative of future results.
User Responsibility: All data entered (Tickers, Quantities, Cash) is processed locally. The user is solely responsible for verifying the accuracy of the data and for any financial decisions made based on the output of this script.
Fictitious Data: All pre-entered values in this demo version are fictitious and intended for demonstration purposes only.

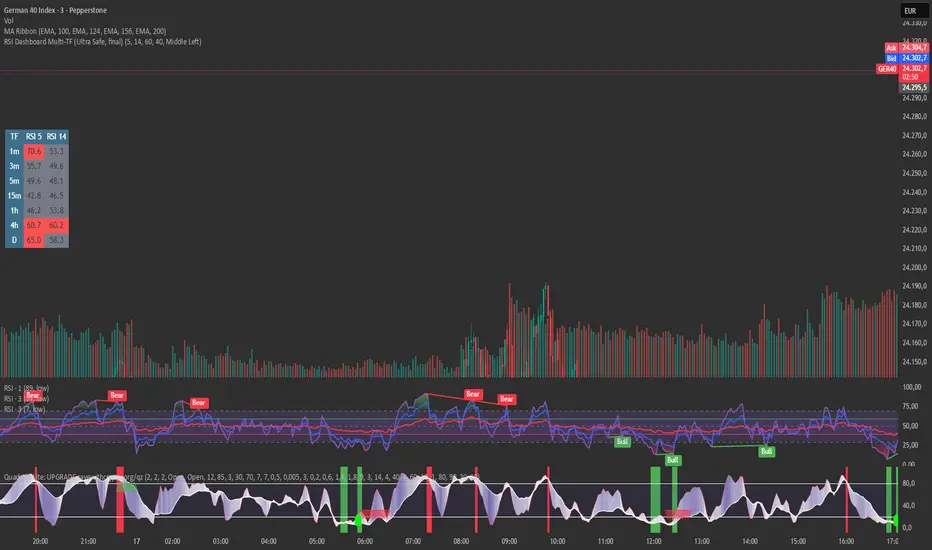
RSI Dashboard Multi-TF This script displays RSI values from multiple timeframes in a compact dashboard directly on the chart.
It is designed for traders who want to quickly identify whether the market is overbought, oversold, or neutral across different timeframes, without constantly switching chart intervals.
The dashboard shows the RSI simultaneously for the following timeframes:
- 1 minute
- 3 minutes
- 5 minutes
- 15 minutes
- 1 hour
- 4 hours
- Daily
Typical use cases:
- Scalping & intraday trading
- Multi-timeframe analysis at a glance
- Entry confirmation (e.g. pullbacks, breakouts)
- Avoiding trades against overbought or oversold market conditions
- Complementing EMA, VWAP, or price action strategies
⚙️ Notes
This dashboard is an analysis tool, not an automated trading system.
No repainting (uses request.security).
Suitable for indices, forex, crypto, and commodities.
This RSI dashboard provides a fast, clear, and visually clean market overview across multiple timeframes, making it an ideal tool for active traders who want to make efficient and well-structured trading decisions.
Multi-Timeframe Market Structure [MattyBTradez]Provides a Bullish or Bearish analysis based on market structure for the 1M, 5M, 15M, 30M, 1H, 4H, and 1D timeframes.

SMC Alpha Sentiment Hunter [Crypto Trade]The SMC Alpha Sentiment Hunter is an institutional-grade decision-support tool developed by the Crypto Trade community.
Unlike traditional lagging indicators, this script focuses on Smart Money Concepts (SMC) by analyzing real-time market sentiment data directly from Binance Futures.
Key Features:
- Real-time Open Interest (OI) Tracking: Confirms institutional capital flow.
- Long/Short Ratio (LSR) Analysis: Identifies retail positioning to spot "liquidity traps".
- Volume & Volatility Filters: Built-in ATR and Volume Moving Average to validate entry signals.
- Multi-Asset Compatibility: Optimized for a broad range of Binance Futures pairs on the 15-minute timeframe.
Logic:
Signals are triggered when institutional interest (OI) rises while retail traders (LSR) are caught on the wrong side of the trend, confirmed by RSI exhaustion and strong volume.
Disclaimer: For educational purposes only. Trading involves risk.

CM RSI Description
This indicator plots ladder-style buy signals based on RSI oversold “cycles.”
BUY1 triggers after RSI closes ≤ Oversold for at least two consecutive candles.
Additional buys (BUY2, BUY3, …) can only occur after RSI re-arms by closing back above the oversold level, then returning oversold for two+ closes, and price is at least X% below the last entry price.
The “last entry” reference updates after every buy, allowing unlimited rebuys with a dynamic step-down.
Notes
Signals are generated on closed bars only (non-repainting behavior).
You can optionally set a Start Time to ignore earlier history and avoid off-screen state.
Choose whether the % drop check uses Close or Low depending on how strict you want confirmation.
Inputs
RSI length/source, oversold level, rebuy drop %, price check source, entry storage source, start time/baseline options, and display controls.

9 HMA Direction Scalper (Pure Flip)new easier 9hma directional pure flip, it will help you with scalping short trends

TiRadarHUD Radar that provids for the ability to input manual levels in addition to tracking multiple EMAs.

ETF-Futures Opening Ratio (Table)This indicator calculates the opening price ratio between an ETF and its corresponding futures contract using the 9:30 AM New York (RTH) opening price.
The ratio is locked at the official market open and remains fixed throughout the session, providing a stable reference for:
Translating ETF price levels into futures equivalents
Comparing relative value and premium/discount behavior
Maintaining consistent cross-instrument analysis during the trading day
The output is displayed in a simple on-chart table for quick reference and minimal chart clutter.


Long-term KST (Know Sure Thing)Description
Long-term Know Sure Thing (KST) oscillator, specifically adapted for non-24h markets such as stocks, indices, ETFs and futures.
This version correctly scales the weekly ROC periods based on the actual trading week length and daily session duration of the instrument — making it accurate across different asset classes (European indices, US equities, crypto, etc.).
Key features:
• Fully customizable trading week (5 days for most stock markets, 7 days for crypto/24h markets)
• Customizable daily session length (8.5h for FTSE MIB/DAX, 6.5h for US equities, 24h for crypto/forex)
• Automatically adjusts bar count per week on any chart timeframe (including Weekly)
• Classic Martin Pring KST parameters (10/13/15/20 ROC weeks, 10/13/15/20 SMA weeks, 1-2-3-4 weighting)
• Includes signal line (SMA of KST) and visual fill between KST and signal (green/red)
What is the Long-term KST used for?
The KST (Know Sure Thing) is a momentum oscillator created by Martin Pring to detect major trend changes, confirm the primary trend direction, and identify significant reversals in medium- to long-term cycles (weeks to months).
Main practical uses:
• Major trend reversals: KST crossing above/below signal line
• Primary trend confirmation: KST above/below zero line
• Classic divergences: Price vs KST divergences often precede important tops/bottoms
• Cycle identification: Helps spot the end of multi-month corrections or the start of new bull/bear phases
• Trend-following filter: Stay long when KST > 0 and rising, stay short when KST < 0 and falling
It is especially powerful on major indices (FTSE MIB, DAX, SPX, NDX, RUT, CAC40, Nikkei…) because it captures institutional money flow with fewer, higher-quality signals compared to faster oscillators.
Best used on:
• Daily, 4H, Weekly charts
• European indices (FTSE MIB, DAX, IBEX…)
• US indices/ETFs (SPX, NDX, RUT…)
• Crypto pairs (set week_length=7, session_duration=24h)
Enjoy trading the big-picture momentum!

Market time opens @NeoNztime opens marked out new york session , london session, asia session and highs and lows of each one

Price Prediction Forecast ModelPrice Prediction Forecast Model
This indicator projects future price ranges based on recent market volatility.
It does not predict exact prices — instead, it shows where price is statistically likely to move over the next X bars.
How It Works
Price moves up and down by different amounts each bar. This indicator measures how large those moves have been recently (volatility) using the standard deviation of log returns.
That volatility is then:
Projected forward in time
Scaled as time increases (uncertainty grows)
Converted into future price ranges
The further into the future you project, the wider the expected range becomes.
Volatility Bands (Standard Deviation–Based)
The indicator plots up to three projected volatility bands using standard deviation multipliers:
SD1 (1.0×) → Typical expected price movement
SD2 (1.25×) → Elevated volatility range
SD3 (1.5×) → High-volatility / stress range
These bands are based on standard deviation of volatility, not fixed probability guarantees.
Optional Drift
An optional drift term can be enabled to introduce a long-term directional bias (up or down).
This is useful for markets with persistent trends.

Gemini Smart SMA Pro + Wyckoff V2 (Enhanced Cloud)The Smart SMA Pro + Wyckoff V2 is an advanced trend-following and market-cycle indicator built for traders who utilize Wyckoff Theory and Volume Spread Analysis (VSA). It is specifically designed to identify the transition from "Cause" (Squeeze/Accumulation) to "Effect" (Expansion/Markup).
By analyzing the volatility spread between two customizable Moving Averages and validating movements with relative volume, this tool helps traders stay out of sideways markets and enter only when high-conviction momentum is present.
Key Features
Wyckoff Phase Detection: Automatically detects Squeeze (Accumulation/Distribution) and Expansion (Markup/Markdown) phases.
Intelligent Dynamic Cloud: The cloud between the MAs changes its transparency dynamically based on the Volume Ratio and trend slope. Darker colors indicate high-volume trend confirmation.
Dual-Layered SOS/SOW Signals: * SOS (Sign of Strength): A Yellow Dot appears on a bullish squeeze breakout. A Yellow Arrow is added only if the move is validated by High Relative Volume.
SOW (Sign of Weakness): An Orange Dot appears on a bearish breakout, with an Orange Arrow appearing only if supported by high volume.
Live Multi-Data Dashboard: A real-time table displaying the status of Fast/Slow MAs, the current market cycle stage, and the Volume Ratio.
Professional Alerts: Built-in alerts for Sign of Strength (SOS) and Sign of Weakness (SOW) breakouts.
How to Trade with it
Grey Cloud (Squeeze): Market is building a "Cause." Avoid trading and prepare for a breakout.
Yellow Dot + Arrow: This is a Confirmed SOS. It indicates institutional participation and a high probability of a new Markup phase.
Buy/Sell Labels: Standard trend entries based on price crossing the Signal Line (Fast MA). Use these to join an already established trend.
Dashboard Monitoring: Check the "Vol. Ratio" to see if the current move has enough strength to sustain the expansion.
How this Indicator was Created
This project is the result of a cutting-edge collaborative development process between a human trader and Gemini (Google’s AI).
Logic Synthesis: We combined traditional technical analysis with AI-optimized algorithms to calculate the Volatility Ratio, ensuring the "Squeeze" detection is more accurate than standard Bollinger-based tools.
Conditional Visuals: The logic was refined through multiple iterations to create a "Smart Visual" system. For instance, the Volume-Validated Arrow was an architectural decision to separate minor breakouts from high-conviction institutional moves.
Code Optimization: The entire script was written in Pine Script® V6, ensuring maximum performance, low latency on charts, and a clean, responsive Dashboard interface using advanced table objects.
----------------------------------------------------------------------------------------------------------------------------------------------------
The Partnership: This indicator represents the perfect synergy between human market intuition and AI’s computational precision, resulting in a tool that is both mathematically sound and visually intuitive for professional use.
