Shock Wave: EMA9 Slope / ATR (Normalized) for SPYShock Wave – EMA9 Slope Normalized by ATR (Fragility Gauge)
This indicator measures trend fragility, not direction.
Instead of relying on visual trendline angles (which change with zoom and chart scaling), this tool normalizes the slope of the 9-EMA by ATR, producing a scale-independent steepness metric that remains consistent across timeframes and zoom levels.
The goal is to identify late-stage acceleration and liquidity vulnerability — conditions where price is advancing faster than inventory can rebalance and the market becomes sensitive to forced liquidation.
What this indicator shows
Normalized EMA9 slope (ATR per bar)
An angle-like degree value derived from the normalized slope (for intuition only)
Background shading to highlight trend maturity / fragility
A compact table showing live readings on the chart
How to interpret
Green / low values (< ~0.30 ATR/bar): Healthy, sustainable trend
Orange / mid values (~0.30–0.40 ATR/bar): Late-stage acceleration
Red / high values (≥ ~0.45 ATR/bar): Fragile / liquidation-prone conditions
These thresholds are empirically derived from historical index behavior (e.g., SPY prior to 2018, 2020, 2022 volatility events).
Important notes
This is not a buy or sell signal
Red does not mean “short”
The indicator highlights risk asymmetry, not timing
Best used on higher timeframes (weekly) in conjunction with liquidity, inducement, and higher-timeframe structure analysis
Why use this
Markets often fail after strong trends, not because they are weak, but because they are crowded. This tool helps quantify when a trend has become structurally vulnerable, providing context for liquidity-based frameworks and macro risk management.
อินดิเคเตอร์และกลยุทธ์

Multi-Ticker Overlay V6 [SPY/QQQ/ES]Key Improvements in this Version:Triple Ticker Support: You now have three distinct sections in the settings (SPY, QQQ, and ES1!). You can toggle them on or off individually.Flexible Symbols: While I defaulted them to SPY, QQQ, and ES, you can use the Ticker Symbol input to change them to anything (e.g., change ES to "DIA" to see Dow Jones levels).Decimal Increments: I changed the increment to a float. You can now set SPY to 1.0 and QQQ to 0.5 or 5.0 depending on how much "clutter" you want.Individual Aesthetics:Colors: Each ticker has its own color picker.Labels: Labels are prefixed with the symbol name (e.g., "QQQ 450") so you don't get confused about which line belongs to which ticker.Smart Ratio Engine: All three tickers respect the "Freeze at 16:00" rule if you turn it on, ensuring the levels stay mathematically accurate based on the market close.Note on Performance: Because this script draws many lines (up to 3 tickers $\times$ 21 lines each), I set the extend to none. The lines will appear as short segments to the right of the current price to keep your chart clean.

Gold DropGold Drop – Intraday Trading System (India Markets)
Gold Drop is a rule-based intraday trading strategy designed specifically for Indian index trading (BANKNIFTY / NIFTY), combining trend, momentum, strength, and fixed reference levels to deliver consistent and disciplined trade execution.
The system is built to avoid emotional trading, over-trading, and shifting levels during the session

ORB 5 Min Break & Retest + Alerts By KhanORB 5-Minute Break & Retest Indicator
This indicator plots the high and low of the first 5-minute candle of the trading session (Opening Range). It then monitors price for a breakout above or below the ORB levels and triggers an alert when price retests the broken level and holds.
Designed to help identify high-probability ORB continuation setups with clear visual levels and TradingView alerts.
If you want, I can also:
Make it even shorter (1–2 lines)
Write a more detailed TradingView public script description
Add a usage guide (rules + best timeframe)
Disclaimer:
This is general information only and not financial advice. For personal guidance, please talk to a licensed professional.

extradestrategy super BTCUSD M15cocok untuk btc usd tidak di perjual belikan harap tidak menggunakan sembarangan


PDH PDL PWH PWL + IMB 15m / 1H / 4H + Weekly LogicPDH PDL PWH PWL indycators
weekly indycators automaticly generated.
for a every week

Trinity Swing Trading Buy and SellThis is a simple little Heiken Ashi MA + ADX & MACD trend-following trading system designed to capture medium- to longer-term moves while filtering out noise and weak trends. It combines modified Heiken Ashi candles (for smoother trend detection) with a moving average alignment, plus optional confirmation from ADX (trend strength) and MACD (momentum).
In practice, the indicator works well on higher timeframes (e.g., 1H, 4H, daily) where trends are more sustained. It performs best in trending markets and naturally avoids choppy/range-bound conditions thanks to the ADX filter (requiring ADX > 20 by default). All key components are fully customizable, so you can disable filters or adjust parameters to suit different instruments (stocks, forex, crypto, futures).
Default settings are:
16 HMA
8,17,9 MACD
15,20 ADX
Recommend to add an additional longer term EMA like 200 for long term trend confirmation.
Adjust inputs in the settings panel as needed:
Toggle MA, ADX, or MACD filters on/off.
Change MA type/length, MACD parameters, ADX threshold
- Use the visual blue diamonds (below bars) for long entries and purple diamonds (above bars) for short entries as confirmation of signals.
- Set alerts on the "Buy Alert" and "Sell Alert" conditions if you want real-time notifications.
This setup gives you a complete, rule-based system that avoids emotional trading and repetitive entries, making it suitable for both backtesting and live trading with proper risk management.

NeuralFlow Forecast Levels | SPY WeeklyThis is a companion script that plots AI-adaptive market equilibrium & expansion mapping levels for SPY on chart.
NeuralFlow Forecast levels are generated though a Artificial Intelligence framework trained to identify where price is statistically inclined to re-balance and where expansion zones historically exhaust rather than extend.
What the Bands Represent
Band Layer Meaning
AI Equilibrium (white core) Primary weekly balance zone where price is most likely to mean-revert
Predictive Rails (aqua / purple) High-confidence corridor of institutional flow containment
Outer Zones (green / red) Expansion limits where continuation historically decays
Extreme Zones (top/bottom) Rare deviation envelope where auction completion is statistically favored
NeuralFlow operates Artificial Intelligence models trained specifically to map statistical re-balancing behavior, not trader predictions or sentiment. No discretionary drawing. No correlations. No lagging overlays.
This engine updates only when underlying structure changes — not when candles fluctuate intraday.
Risk:
Educational & analytical use only. Not financial advice

Maestro 4hThis indicator is designed to help traders analyze market trends and identify potential trading opportunities.
It provides clear visual signals based on price behavior and technical calculations, allowing traders to better understand market structure, momentum, and direction.
The indicator can be used on any market and timeframe, making it suitable for both intraday and swing trading.
It is intended as a decision-support tool and should be used in combination with proper risk management and other forms of analysis.

king 3//@version=5
indicator("BTC_QQQ_Crown_Indicator", overlay=true)
// 1. MACD Numbers (8, 16, 11)
= ta.macd(close, 8, 16, 11)
// 2. Engulfing Candle Logic
bull = close < open and open < close and close > open
bear = close > open and open > close and close < open
// 3. Crown Signal Condition
crownBuy = bull and hist > hist
crownSell = bear and hist < hist
// 4. Drawing Crowns on Chart
plotshape(crownBuy, title="Buy_Crown", style=shape.labelup, location=location.belowbar, color=color.yellow, size=size.normal, text="👑 BUY", textcolor=color.black)
plotshape(crownSell, title="Sell_Crown", style=shape.labeldown, location=location.abovebar, color=color.red, size=size.normal, text="👑 SELL", textcolor=color.white)

Muros Multi-TF Pro Dashboard v2fwrvw w fw wf fs rf wf wf jni hb hu huhb yhi ib i ibb uoobu ic biicb ibc bic k

HMA Direction Scalping + Liquidity Zones + Metricsuses hma to determine buy and sell using 9hma for direction.

Udta Teer MKCIts normal vwap which is already available in TradingView. Now we have modified it with help of AI for bands

Rainbow Road [kingthies]Rainbow Road
Rainbow Road is a trend-structure and momentum visualization tool built around a cascading chain of smoothed simple moving averages. Instead of plotting independent moving averages on price, each line is progressively smoothed from the prior one using the same length, creating a layered “road” that reveals trend strength, direction, and transition with exceptional clarity.
OVERVIEW
Rainbow Road visualizes trend quality using a spectrum of fast-to-slow moving averages derived from one another. Because each average is smoothed from the prior line, the indicator forms a continuous structure rather than a collection of unrelated signals. This makes trend alignment, momentum expansion, and compression immediately visible.
HOW IT WORKS
The first average is a Simple Moving Average of price
Each subsequent average is an SMA of the previous average using the same length
This creates a cascading chain of averages with increasing smoothness
Colors progress from red (fastest) to purple (slowest) to represent trend hierarchy
HOW TO READ IT
Strong Trend : All averages are aligned and expanding in the same direction
Acceleration : Spacing between averages increases
Deceleration : Spacing narrows while direction remains intact
Consolidation : Averages converge and overlap
Reversal Risk : Faster averages cross back through the slowest average
TREND CONTEXT
The optional fill between the fastest and slowest averages visualizes overall trend pressure. Expanding fill suggests strengthening momentum, while contracting fill highlights compression and potential regime change.
USE CASES
Trend confirmation and directional bias
Momentum expansion vs compression analysis
Identifying trend exhaustion and early reversal zones
Contextual filtering for entries and exits
WHY RAINBOW ROAD
Traditional moving average stacks often produce clutter and redundant signals. Rainbow Road focuses on structure and flow, helping traders evaluate the quality of a trend rather than reacting to individual crossovers.
BEST USED WITH
Price action and market structure
Support and resistance
Volatility or range-based tools
Higher-timeframe trend bias
Rainbow Road is designed to sit quietly on your chart and clearly communicate whether the market is flowing, stalling, or preparing to turn.

Fundamental Dashboard [Standalone]Overview
The Fundamental Strength Dashboard is a streamlined utility designed to evaluate the fundamental health of a stock directly on your chart. Instead of relying solely on price action, this indicator fetches real-time financial data to assess profitability, valuation, and financial stability.
It aggregates five core financial metrics into a single "Fundamental Score" (0-5) and displays a clear rating (Strong Buy, Buy, Neutral, or Weak/Sell) in a customizable dashboard table.
How It Works
The script analyzes the following 5 Key Fundamental Metrics. For a stock to receive a "point" for a specific metric, it must meet the criteria defined in your settings:
Net Income (Profitability): Checks if the company is actually profitable (Net Income > 0).
EPS (Earnings Per Share): Ensures the company has positive Earnings Per Share (TTM).
P/E Ratio (Valuation): Checks if the stock is valued reasonably compared to your maximum threshold (default: < 45).
Debt-to-Equity (Leverage): Analyzes financial risk. Lower is better (default: < 0.5).
ROE (Efficiency): Measures how effectively management uses equity to generate profit (default: > 15%).
The Scoring System
The indicator calculates a cumulative score based on how many of the above criteria are met:
Score 5/5 → STRONG BUY: The stock meets all profitability, valuation, and stability criteria.
Score 4/5 → BUY: The stock misses only one criterion but is otherwise fundamentally sound.
Score 0-3 → WEAK / SELL: The stock fails multiple fundamental checks (e.g., negative earnings, high debt, or overvaluation).
Features & Customization
Every trader has different risk appetites and sector preferences. You can fully customize the thresholds in the Settings menu:
Max P/E Threshold: Adjust this based on the sector (e.g., Tech stocks typically have higher P/Es than Utilities).
Min ROE %: Set your requirement for management efficiency.
Max Debt/Equity: Tighten or loosen leverage requirements.
Visuals: Change the table position (Top Right, Bottom Right, etc.) and color scheme to match your chart theme.
How to Use
Add the indicator to your chart.
Open the Settings (Gear icon).
Adjust the Dynamic Thresholds to fit the sector you are trading.
Look at the dashboard on the chart to see a snapshot of the stock's fundamental health.
Disclaimer
This script is for educational and informational purposes only. It relies on third-party financial data provided by TradingView, which may occasionally be missing or delayed. Always do your own research (DYOR) before making investment decisions.

XAUUSD M15 momentum realDetects when xausd enters a healthy directional phase during the NY session, and only flags entries with real momentum and controlled volatility.

V3 Valentini Pro Scalper [Dashboard]Gemini 3.0 pro's take on Fabio Valentini's world #1 strategy scalp 12/19/2025

FVG Strategy with validationThe code needs to be fixed because it renders the boxes incorrectly, otherwise you can see that the code is profitable in some markets

Minervini Template + Powerplay detectorMinervini Template + PowerPlay Detector
This indicator implements a rule-based Minervini trend template to identify stocks in strong, institutionally supported uptrends, combined with a Power Play momentum detector for explosive leadership moves.
Minervini Model (MM) Rules
The MM dashboard turns GREEN only when all of the following rules are met:
Close ≥ 150-day SMA
Close ≥ 200-day SMA
50-day SMA > 150-day SMA
50-day SMA > 200-day SMA
150-day SMA ≥ 200-day SMA
200-day SMA is rising (current value higher than ~1 month ago)
Close is at least 30% above the 52-week low
Close is within 25% of the 52-week high
Close is not more than 8% below the 50-day SMA
These rules ensure:
Proper long-term trend structure
Institutional accumulation alignment
Strength near highs, not extended weakness
When MM is red, hovering over it shows exactly which rules failed, allowing quick diagnosis of why a stock does not qualify.
POWERPLAY Logic
POWERPLAY highlights rare, high-velocity leadership moves:
Triggers when a stock gains 90% or more within any rolling window of up to 60 trading sessions
Remains active as long as the condition continues to hold
Hover tooltip displays:
Start date of the move
Current date
Total percentage gain so far
This captures fast institutional momentum, even if the move occurs in fewer than 60 sessions.
Dashboard Features
Moveable to any corner of the chart
Adjustable size
Adjustable opacity
Designed for trend followers and momentum traders seeking true market leaders, not short-term noise or late-stage breakouts.


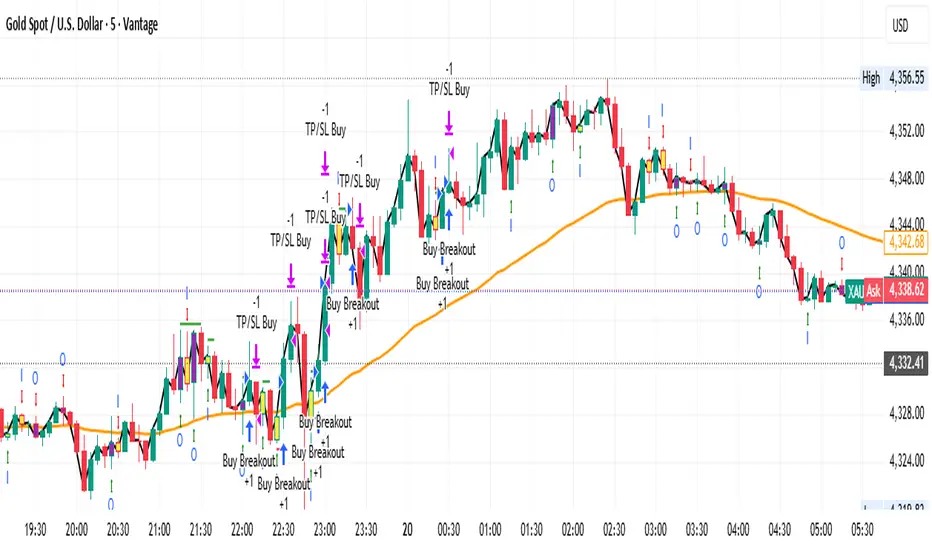
Gold M5 Scalping (Strategy)This is the New Strategy for my new Indicator for M5 Scalping.
Just to test my result.
Will release my indicator soon
Jpi for LIFEEEEhmm like idk it kinda just marks out with a veritcal line 8am nyc 10:30 nyc and 10am nyc idk why but like ye ig its comfortable
