Antigravity OCC Strategy (MA 5 + Delayed TSL)# OCC Strategy Optimized (MA 5 + Delayed TSL) - User Guide
## Introduction
The **OCC Strategy Optimized** is an enhanced version of the classic **Open Close Cross (OCC)** strategy. This strategy is designed for high-precision trend following, utilizing the crossover logic of Open and Close moving averages to identify market shifts. This optimized version incorporates advanced risk management, multi-timeframe analysis, and a variety of moving average types to provide a robust trading solution for modern markets.
>
> **Special Thanks:** This strategy is based on the original work of **JustUncleL**, a renowned Pine Script developer. You can find their work and profile on TradingView here: (in.tradingview.com).
---
## Key Features
### 1. Optimized Core Logic
- **MA Period (Default: 5):** The strategy is tuned with a shorter MA length to reduce lag and capture trends earlier.
- **Crossing Logic:** Signals are generated when the Moving Average of the **Close** crosses the Moving Average of the **Open**.
### 2. Multi-Timeframe (MTF) Analysis
- **Alternate Resolution:** Use a higher timeframe (Resolution Multiplier) to filter out noise. By default, it uses $3 \times$ your current chart timeframe to confirm the trend.
- **Non-Repainting:** Includes an optional delay offset to ensure signals are confirmed and do not disappear (repaint) after the bar closes.
### 3. Advanced Risk Management
This script features a hierarchical exit system to protect your capital and lock in profits:
- **Fixed Stop Loss (Initial):** Protects against sudden market reversals immediately after entry.
- **Delayed Trailing Stop Loss (TSL):**
- **Activation Delay:** The TSL only activates after the trade reaches a specific profit threshold (e.g., 1%). This prevents being stopped out too early in the trade's development.
- **Ratchet Trail:** Once activated, the stop loss "ratchets" up/down, never moving backward, ensuring you lock in profits as the trend continues.
- **Take Profit (TP):** A fixed percentage target to exit the trade at a pre-defined profit level.
### 4. Versatility
- **12 MA Types:** Choose from SMA, EMA, DEMA, TEMA, WMA, VWMA, SMMA, HullMA, LSMA, ALMA, SSMA, and TMA.
- **Trade Direction:** Toggle between Long-only, Short-only, or Both.
- **Visuals:** Optional bar coloring to visualize the trend directly on the candlesticks.
---
## User Input Guide
### Core Settings
- **Use Alternate Resolution?:** Enable this to use the MTF logic.
- **Multiplier for Alternate Resolution:** How many charts higher the "filter" timeframe should be.
- **MA Type:** Select your preferred moving average smoothing method.
- **MA Period:** The length of the Open/Close averages.
- **Delay Open/Close MA:** Use `1` or higher to force non-repainting behavior.
### Risk Management Settings
- **Use Trailing Stop Loss?:** Enables the TSL system.
- **Trailing Stop %:** The distance the stop follows behind the price.
- **TSL Activation % (Delay):** The profit % required before the TSL starts moving.
- **Initial Fixed Stop Loss %:** Your hard stop if the trade immediately goes against you.
- **Take Profit %:** Your ultimate profit target for the trade.
---
## How to Trade with This Strategy
1. **Identify the Trend:** Look for the Moving Average lines (Close vs Open) to cross.
2. **Wait for Confirmation:** If using MTF, ensure the higher timeframe also shows a trend change.
3. **Manage the Trade:** Let the TSL work. Once the trade hits the activation threshold, the TSL will take over, protecting your runner.
4. **Position Sizing:** Adjust the `Properties` tab in the script settings to match your desired capital allocation (Default is 10% of equity).
---
## Credits
Original Strategy by: **JustUncleL**
Optimized and Enhanced by: **Antigravity AI**
อินดิเคเตอร์และกลยุทธ์

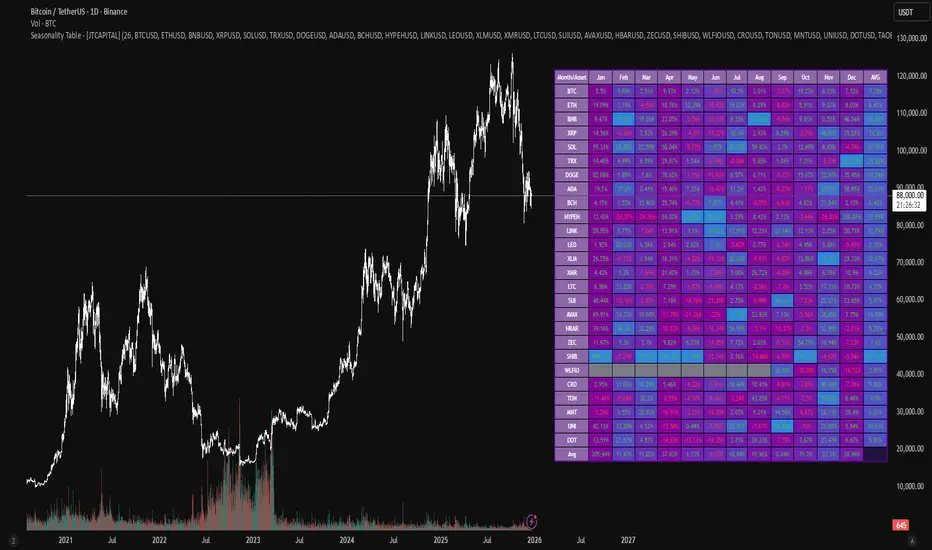
Seasonality Table - [JTCAPITAL]Seasonality Table - is a modified way to use monthly return aggregation across multiple assets to identify seasonal trends in cryptocurrencies and indices.
The indicator works by calculating in the following steps:
Asset Selection
The user defines a list of assets to include in the seasonality table. By default, the script allows up to 32 assets, including popular cryptocurrencies like BTC, ETH, BNB, XRP, and others. Each asset is identified by its symbol (e.g., "CRYPTO:BTCUSD").
Monthly Return Calculation
For each asset, the script requests monthly price data using request.security. Specifically, it retrieves the monthly open, close, and month number. The monthly return is calculated as:
Return = (Close - Open) / Open
This step provides a normalized measure of performance for each asset per month.
Data Aggregation
The script stores two key arrays for each asset and month combination:
sumReturns: The cumulative sum of monthly returns
countReturns: The number of months with valid data
This allows averaging returns later while handling months with missing data gracefully.
Table Construction
Rows representing months (January–December)
Columns representing each asset
An additional column showing the average return for all assets per month
A final row showing the yearly average return for each asset
Filling the Table
The table cells are filled as follows:
Monthly returns are averaged for each asset and displayed as a percentage.
Positive returns are colored green, negative returns red.
Missing data is displayed as a gray “—” placeholder.
Each row’s values are normalized for the color gradient to show relative performance.
Averages Computation
The script calculates two types of averages:
Monthly Average Across Assets : Sum of all asset returns for a month divided by the number of valid data points.
Yearly Average Per Asset : Sum of all monthly returns for an asset divided by the number of months with valid data.
These averages are displayed in the last column and last row respectively, with gradient coloring for visual comparison.
Buy and Sell Conditions
This indicator does not generate explicit buy or sell signals. Instead, it provides a visual heatmap of historical seasonality, allowing traders to:
Identify months where an asset historically outperforms (bullish bias)
Identify months with weak historical performance (bearish caution)
Compare seasonal patterns across multiple assets for portfolio allocation
Filters can be applied by adjusting the asset list, changing the color mapping, or focusing on specific months to highlight seasonal anomalies.
Features and Parameters
Number of assets: Set how many assets are included in the table (1–32).
Assets: Input symbols for the assets you want to analyze.
Low % Color: Defines the color for the lowest monthly returns in the gradient.
High % Color: Defines the color for the highest monthly returns in the gradient.
Cleaned asset names for concise display.
Gradient-based visualization for easier pattern recognition.
Monthly and yearly averages for comparative analysis.
Specifications
Monthly Return Calculation
Uses the formula (Close - Open) / Open for each asset per month. This standardizes performance across different price scales and ensures comparability between assets.
Arrays for Storage
sumReturns: Float array storing cumulative monthly returns.
countReturns: Integer array storing the number of valid data points per month.
These arrays allow efficient aggregation and average calculations without overwriting previous values.
Data Retrieval via Security Calls
Requests monthly OHLC data for each asset using request.security.
Ensures calculations reflect the correct timeframe and allow for historical comparison.
Color and Text Assignment
Green text for positive returns, red for negative returns.
Gray cells indicate missing data.
Gradient background shows relative magnitude within the month.
Seasonality Analysis
The table visually encodes which months historically produce stronger returns.
Useful for portfolio rotation, risk management, and identifying cyclical trends.
Scalability
Supports up to 32 assets.
Dynamically adapts to the number of assets and data availability.
Gradient scales automatically per row for consistent comparison.
deKoder | Business Cycle vs BitcoinThis indicator overlays Bitcoin's detrended momentum with the US ISM Manufacturing PMI (a key business cycle proxy) to visually dissect the relationship between crypto cycles and broader economic health.
Inspired by ongoing debates in crypto macro analysis (e.g., "Is there a 4-year halving cycle, or is it just the business cycle?" ), it highlights potential lead-lag dynamics - challenging the popular view that PMI strictly leads Bitcoin rallies and tops.
Key Features
• BTC Momentum Wave (Yellow/Orange Line):
Detrended deviation from Bitcoin's long-term "fair value" (24-month SMA).
Formula: ((close / sma(close, 24)) * 100 - 100) * 0.15
- Positive (yellow): BTC overvalued relative to trend | bullish momentum
- Negative (orange): Undervalued relative to trend | bearish momentum
• PMI Wave (Teal/Red Line):
ISM Manufacturing PMI centered at zero (raw PMI - 50, scaled ×3 for alignment).
- Positive (teal): Expansion (>50 raw) — economic tailwinds.
- Negative (red): Contraction (<50 raw) — headwinds, often linked to risk-off in assets.
• S&P 500 Momentum (White Line, Optional):
Similar deviation for SPX, showing how equities bridge BTC's volatility and PMI's smoothness.
• Divergence Highlights (Bar & Background Colors):
- Teal/Green Zones : BTC momentum positive while PMI negative → BTC signaling early recovery (potential lead by 1-3+ months at bottoms).
- Maroon/Red Zones : BTC momentum negative while PMI positive → BTC warning of rollovers (early bear signals).
- Neutral: No color — aligned cycles.
• Overlaid SMA on Price Chart :
24-month SMA for BTC (teal when price above, red when below) — quick fair value reference.
How to Interpret: Does BTC Lead the Business Cycle?
The chart flips the common meme ( "No 4-year cycle, it's just the business cycle" ) by visually emphasising BTC's potential as a forward-looking signal .
Historical cycles (2013–2025) show:
• BTC Leads at Bottoms : E.g., 2018–2019 and 2022 troughs — BTC momentum crosses positive 2–4 months before PMI, as speculative traders price in liquidity easing/recoveries ahead of manufacturing data.
• Coincident or BTC-Led at Tops : Peaks align closely (e.g., 2017, 2021), with PMI rollovers often coinciding or slightly leading the initial BTC euphoria fade. BTC then rolls over before PMI confirms later.
• Why? Markets are anticipatory (6–12 months forward), while PMI is a lagged survey snapshot. BTC, as a high-beta risk asset, amplifies early sentiment shifts before they hit factory orders/employment.
Inputs & Customization
• BTC Source (Default: BITSTAMP:BTCUSD)
• Fair Value MA Length (Default: 24 months)
• Show S&P (Default: False)
• PMI Multiplier (Default: 3.0)
• BTC Momentum Multiplier (Default: 0.15)
• Cap BTC Momentum at ±100 (Default: True)
• Toggle Early Cross Arrows, Bar/Background Deviation Colors, Difference Histogram

Order Flow: Structural Sniper [Profile + Signals]Overview
This script is a comprehensive tool designed to bridge the gap between Market Structure and Order Flow analysis. It aims to eliminate the subjectivity of static support and resistance lines by focusing on dynamic liquidity and the behavior of aggressive versus passive market participants.
Unlike traditional indicators that plot static data, the Structural Delta Map dynamically anchors its analysis to the start of the current trend (Pivots), providing a clear "X-Ray" view of how volume was distributed during the current price swing.
How it Works
The indicator combines three distinct technical concepts into a single system:
1. Market Structure (Pivots):
It uses a pivot detection algorithm to identify significant Swing Highs and Swing Lows. This determines the market bias and anchors the analysis to the origin of the movement.
2. Anchored VWAP (Fair Price):
It automatically calculates the Volume Weighted Average Price (VWAP) starting from the last confirmed pivot. This yellow line acts as the "spine" of the trend, serving as dynamic institutional support/resistance.
3. Delta Profile & Heatmap:
A Volume Profile is plotted on the left side, anchored to the pivot.
Split Delta: Instead of a single color, bars are split into Green (Buying Volume) and Red (Selling Volume) based on price action estimation.
Heatmap Logic: The opacity of the bars adjusts automatically. Bright/Solid bars represent High Volume Nodes (HVN), while transparent bars represent Low Volume Nodes (LVN) or liquidity voids.
How to Use (Strategy)
The indicator provides both visual context and specific entry signals:
1. Visual Context:
Profile: Look for reactions at bright, wide bars (High Volume Nodes). These act as magnets or barriers.
Yellow Line (VWAP): In an uptrend, look for buy opportunities when price retraces to this line. In a downtrend, look for shorts on the retest.
2. Aggression Signals (Triangle "AGR"):
Type: Trend Continuation / Pullback.
Logic: Triggers when price retraces to the structural value zone (near VWAP), rejects it with higher-than-average volume, and closes in the direction of the trend.
3. Absorption Signals (Cross "ABS"):
Type: Reversal / Trap.
Logic:
Bullish Absorption: Price makes a new local low with high volume (selling pressure), but the candle closes bullish (leaving a long bottom wick). Passive buyers absorbed the aggression.
Bearish Absorption: Price makes a new local high with high volume, but closes bearish. Passive sellers absorbed the buying pressure.
Settings
Pivot Sensitivity: Adjusts how the script detects trend changes.
Profile Resolution: Controls the number of rows in the histogram.
Signal Filters: Enable/Disable signals and adjust the Volume Multiplier threshold.
Technical Disclaimer
This indicator estimates "Delta" (Buy vs. Sell volume) based on OHLC price action and bar volume, as Pine Script does not grant access to historical tick-by-tick data. While this approximation is highly effective for identifying aggression and absorption, it differs slightly from Level 2 footprint data found on platforms like Sierra Chart. Accuracy depends on the volume data provided by your exchange.

Liquidity Maxing [JOAT]Liquidity Maxing - Institutional Liquidity Matrix
Introduction
Liquidity Maxing is an open-source strategy for TradingView built around institutional market structure concepts. It identifies structural shifts, evaluates trades through multi-factor confluence, and implements layered risk controls.
The strategy is designed for swing trading on 4-hour timeframes, focusing on how institutional order flow manifests in price action through structure breaks, inducements, and liquidity sweeps.
Core Functionality
Liquidity Maxing performs three primary functions:
Tracks market structure to identify when control shifts between buyers and sellers
Scores potential trades using an eight-factor confluence system
Manages position sizing and risk exposure dynamically based on volatility and user-defined limits
The goal is selective trading when multiple conditions align, rather than frequent entries.
Market Structure Engine
The structure engine tracks three key events:
Break of Structure (BOS): Price pushes beyond a prior pivot in the direction of trend
Change of Character (CHoCH): Control flips from bullish to bearish or vice versa
Inducement Sweeps (IDM): Market briefly runs stops against trend before moving in the real direction
The structure module continuously updates strong highs and lows, labeling structural shifts visually. IDM markers are optional and disabled by default to maintain chart clarity.
The trade engine requires valid structure alignment before considering entries. No structure, no trade.
Eight-Factor Confluence System
Instead of relying on a single indicator, Liquidity Maxing uses an eight-factor scoring system:
Structure alignment with current trend
RSI within healthy bands (different ranges for up and down trends)
MACD momentum agreement with direction
Volume above adaptive baseline
Price relative to main trend EMA
Session and weekend filter (configurable)
Volatility expansion/contraction via ATR shifts
Higher-timeframe EMA confirmation
Each factor contributes one point to the confluence score. The default minimum confluence threshold is 6 out of 8, but you can adjust this from 1-8 based on your preference for trade frequency versus selectivity.
Only when structure and confluence agree does the strategy proceed to risk evaluation.
Dynamic Risk Management
Risk controls are implemented in multiple layers:
ATR-based stops and targets with configurable risk-to-reward ratio (default 2:1)
Volatility-adjusted position sizing to maintain consistent risk per trade as ranges expand or compress
Daily and weekly risk budgets that halt new entries once thresholds are reached
Correlation cooldown to prevent clustered trades in the same direction
Global circuit breaker with maximum drawdown limit and emergency kill switch
If any guardrail is breached, the strategy will not open new positions. The dashboard clearly displays risk state for transparency.
Market Presets
The strategy includes configuration presets optimized for different market types:
Crypto (BTC/ETH): RSI bands 70/30, volume multiplier 1.2, enhanced ATR scaling
Forex Majors: RSI bands 75/25, volume multiplier 1.5
Indices (SPY/QQQ): RSI bands 70/30, volume multiplier 1.3
Custom: Default values for user customization
For crypto assets, the strategy automatically applies ATR volatility scaling to account for higher volatility characteristics.
Monitoring and Dashboards
The strategy includes optional monitoring layers:
Risk Operations Dashboard (top-right):
Trend state
Confluence score
ATR value
Current position size percentage
Global drawdown
Daily and weekly risk consumption
Correlation guard state
Alert mode status
Performance Console (top-left):
Net profit
Current equity
Win rate percentage
Average trade value
Sharpe-style ratio (rolling 50-bar window)
Profit factor
Open trade count
Optional risk tint on chart background provides visual indication of "safe to trade" versus "halted" state.
All visualization elements can be toggled on/off from the inputs for clean chart viewing or full telemetry during parameter tuning.
Alerts and Automation
The strategy supports alert integration with two formats:
Standard alerts: Human-readable messages for long, short, and risk-halt conditions
Webhook format: JSON-formatted payloads ready for external execution systems (optional)
Alert messages are predictable and unambiguous, suitable for manual review or automated forwarding to execution engines.
Built-in Validation Suite
The strategy includes an optional validation layer that can be enabled from inputs. It checks:
Internal consistency of structure and confluence metrics
Sanity and ordering of risk parameters
Position sizing compliance with user-defined floors and caps
This validation is optional and not required for trading, but provides transparency into system operation during development or troubleshooting.
Strategy Parameters
Market Presets:
Configuration Preset: Choose between Crypto (BTC/ETH), Forex Majors, Indices (SPY/QQQ), or Custom
Market Structure Architecture:
Pivot Length: Default 5 bars
Filter by Inducement (IDM): Default enabled
Visualize Structure: Default enabled
Structure Lookback: Default 50 bars
Risk & Capital Preservation:
Risk:Reward Ratio: Default 2.0
ATR Period: Default 14
ATR Multiplier (Stop): Default 2.0
Max Drawdown Circuit Breaker: Default 10%
Risk per Trade (% Equity): Default 1.5%
Daily Risk Limit: Default 6%
Weekly Risk Limit: Default 12%
Min Position Size (% Equity): Default 0.25%
Max Position Size (% Equity): Default 5%
Correlation Cooldown (bars): Default 3
Emergency Kill Switch: Default disabled
Signal Confluence:
RSI Length: Default 14
Trend EMA: Default 200
HTF Confirmation TF: Default Daily
Allow Weekend Trading: Default enabled
Minimum Confluence Score (0-8): Default 6
Backtesting Considerations
When backtesting this strategy, consider the following:
Commission: Default 0.05% (adjustable in strategy settings)
Initial Capital: Default $100,000 (adjustable)
Position Sizing: Uses percentage of equity (default 2% per trade)
Timeframe: Optimized for 4-hour charts, though can be tested on other timeframes
Results will vary significantly based on:
Market conditions and volatility regimes
Parameter settings, especially confluence threshold
Risk limit configuration
Symbol characteristics (crypto vs forex vs equities)
Past performance does not guarantee future results. Win rate, profit factor, and other metrics should be evaluated in context of drawdown periods, trade frequency, and market conditions.
How to Use This Strategy
This is a framework that requires understanding and parameter tuning, not a one-size-fits-all solution.
Recommended workflow:
Start on 4-hour timeframe with default parameters and appropriate market preset
Run backtests and study performance console metrics: focus on drawdown behavior, win rate, profit factor, and trade frequency
Adjust confluence threshold to match your risk appetite—higher thresholds mean fewer but more selective trades
Set realistic daily and weekly risk budgets appropriate for your account size and risk tolerance
Consider ATR multiplier adjustments based on market volatility characteristics
Only connect alerts or automation after thorough testing and parameter validation
Treat this as a risk framework with an integrated entry engine, not merely an entry signal generator. The risk controls are as important as the trade signals.
Strategy Limitations
Designed for swing trading timeframes; may not perform optimally on very short timeframes
Requires sufficient market structure to identify pivots; may struggle in choppy or low-volatility environments
Crypto markets require different parameter tuning than traditional markets
Risk limits may prevent entries during favorable setups if daily/weekly budgets are exhausted
Correlation cooldown may delay entries that would otherwise be valid
Backtesting results depend on data quality and may not reflect live trading with slippage
Design Philosophy
Many indicators tell you when price crossed a moving average or RSI left oversold. This strategy addresses questions institutional traders ask:
Who is in control of the market right now?
Is this move structurally significant or just noise?
Do I want to add more risk given what I've already done today/week?
If I'm wrong, exactly how painful can this be?
The strategy provides disciplined, repeatable answers to these questions through systematic structure analysis, confluence filtering, and multi-layer risk management.
Technical Implementation
The strategy uses Pine Script v6 with:
Custom types for structure, confluence, and risk state management
Functional programming approach for reusable calculations
State management through persistent variables
Optional visual elements that can be toggled independently
The code is open-source and can be modified to suit individual needs. All important logic is visible in the source code.
Disclaimer
This script is provided for educational and informational purposes only. It is not intended as financial, investment, trading, or any other type of advice or recommendation. Trading involves substantial risk of loss and is not suitable for all investors. Past performance, whether real or indicated by historical tests of strategies, is not indicative of future results.
No representation is being made that any account will or is likely to achieve profits or losses similar to those shown. In fact, there are frequently sharp differences between backtested results and actual results subsequently achieved by any particular trading strategy.
The user should be aware of the risks involved in trading and should trade only with risk capital. The authors and publishers of this script are not responsible for any losses or damages, including without limitation, any loss of profit, which may arise directly or indirectly from use of or reliance on this script.
This strategy uses technical analysis methods and indicators that are not guaranteed to be accurate or profitable. Market conditions change, and strategies that worked in the past may not work in the future. Users should thoroughly test any strategy in a paper trading environment before risking real capital.
Commission and slippage settings in backtests may not accurately reflect live trading conditions. Real trading results will vary based on execution quality, market liquidity, and other factors not captured in backtesting.
The user assumes full responsibility for all trading decisions made using this script. Always consult with a qualified financial advisor before making investment decisions.
Enjoy - officialjackofalltrades

Daytrading Suite: Neon TPO + FVG v6.1Here is the summary of the code and the trading guide in English.
---
### 1. Code Summary: What does the chart show?
The script combines three dimensions of trading into a single chart:
* **The Context (TPO / Market Profile - Yesterday):**
* **Gold Zone (Center):** Yesterday's **POC (Point of Control)**. This was the "fairest price". It often acts as a magnet.
* **White Dashed Lines:** The **VAH (Value Area High)** and **VAL (Value Area Low)**. Yesterday, 70% of all trading volume happened between these lines. This is the area of "Balance".
* **The Structure (HTF - 1 Hour+):**
* **Red/Green Boxes (Right Edge):** Automatic **Supply & Demand Zones** based on the 1-hour chart (or your setting). They indicate major resistance and support levels.
* **The Timing (Entries):**
* **Neon FVG Boxes (Small):** "Fair Value Gaps". These represent imbalances in price. If price revisits these, it is often your **entry signal**.
* **Lines (VWAP, EMA, PDH/PDL):** Act as dynamic support and trend indicators.
---
### 2. Trading Strategy: How to use it
Do not just trade every colored spot. You must combine **Location (TPO)** with **Signal (FVG)**.
#### Step A: The Open (Where are we?)
In the morning (or at the US Open), check where the price is relative to the **white TPO lines**.
1. **Inside the White Lines (In Balance):**
* The market is undecided. Expect ranging/choppy behavior.
* **Strategy:** Buy at the bottom edge (VAL), Sell at the top edge (VAH). The target is often the Gold Zone (POC) in the middle.
2. **Outside the White Lines (Imbalance):**
* The market is seeking new prices. Danger of a Trend!
* **Strategy:** If price breaks above VAH and tests it from above -> **Long**. If it breaks below VAL -> **Short**.
#### Step B: The Setup (The High Probability Scenario)
Here is the "Rejection" Setup (Long Example):
1. Price drops to the lower white line (**VAL**) or into a green **Demand Zone**.
2. It bounces (shows a wick).
3. In the process, a small **green Neon FVG** is formed.
4. **Entry:** Limit Order at the top of the Neon FVG.
5. **Target:** The Gold Zone (POC) or the upper white line (VAH).
6. **Stop Loss:** Below the recent swing low.
#### Step C: Warning Signals (When NOT to trade)
* **In "No Man's Land":** If the price is sitting right in the middle between Gold (POC) and White (VAH/VAL), do nothing. The risk is 50/50. Wait until price hits an edge.
* **Against the Flow:** If EMA 9 and 21 are pointing steeply downwards, do not buy blindly at the VAL just because the line is there. Wait for confirmation (FVG).
### Pre-Trade Checklist:
1. **Level:** Am I at a white line (VAH/VAL) or the Gold Zone (POC)?
2. **Structure:** Do I have an HTF Demand/Supply Zone backing me up?
3. **Trigger:** Do I see a Neon FVG pointing in my direction?

king//@version=5
indicator("BTC_QQQ_Crown_Indicator", overlay=true)
// 1. MACD Numbers (8, 16, 11)
= ta.macd(close, 8, 16, 11)
// 2. Engulfing Candle Logic
bull = close < open and open < close and close > open
bear = close > open and open > close and close < open
// 3. Crown Signal Condition
crownBuy = bull and hist > hist
crownSell = bear and hist < hist
// 4. Drawing Crowns on Chart
plotshape(crownBuy, title="Buy_Crown", style=shape.labelup, location=location.belowbar, color=color.yellow, size=size.normal, text="👑 BUY", textcolor=color.black)
plotshape(crownSell, title="Sell_Crown", style=shape.labeldown, location=location.abovebar, color=color.red, size=size.normal, text="👑 SELL", textcolor=color.white)

ICT Precision Turtle Soup NuNi1. Identify the CRT Range (The Context)
Before looking for a trade, the indicator defines the Candle Range Theory (CRT) boundaries based on your lookback period.
CRT High (Red Line): Represents old buy-side liquidity.
CRT Low (Green Line): Represents old sell-side liquidity.
HTF Filter: The code ensures the higher timeframe trend (e.g., 4H) aligns with your direction. Only look for Buys if the HTF trend is bullish.
2. The Manipulation (Turtle Soup 🐢)
Wait for price to move outside the CRT boundaries.
The Trap: Price must sweep below the CRT Low or above the CRT High.
The Reclaim: A Turtle Body Soup (TBS) occurs when the candle body closes back inside the range, or a wick rejection happens.
Symbol: A 🐢 icon will appear on the chart. Do not entry yet. This is just a warning that a setup is forming.
3. The Shift & Momentum (The Trigger)
To ensure a high-probability entry, the indicator waits for two technical confirmations:
MSS (Market Structure Shift): Price must break the most recent swing high (for Buys) or swing low (for Sells).
Displacement: The breaking candle must be "displaced"—meaning it has a large, energetic body compared to previous candles. This proves that big banks/institutions are moving the price.
4. The Entry Execution
Once all conditions are met, the "⭐ PRECISION ENTRY" label will appear.
Execution: You can enter at the market price when the label appears.
Retest Entry: Alternatively, look for the price to return to the IFVG or Breaker Zone (the shaded box) drawn by the indicator for a more refined entry.

EMA and Dow Theory Strategies V2📘 Overview
This strategy is an advanced evolution of the original EMA × Dow Theory hybrid model. V2 introduces true swing‑based trend detection, gradient trend‑zones, higher‑timeframe swing overlays, and dynamic exit logic designed for intraday to short‑term trading across crypto, forex, stocks, and indices.
The system provides precise entries, adaptive exits, and highly visual guidance that helps traders understand trend structure at a glance.
🧠 Key Features
🔹 1. Dual‑EMA Trend Logic (Symbol + External Index)
Both the chart symbol and an external index (OTHERS.D) are evaluated using fast/slow EMAs to determine correlation‑based trend bias.
🔹 2. Dow Theory Swing Detection (Real‑time)
The script identifies swing highs/lows and updates trend direction when price breaks them. This creates a structural trend model that reacts faster than EMAs alone.
🔹 3. Gradient Trend Zones (Visual Trend Strength)
When trend is up or down, the area between price and the latest swing level is filled with a multi‑step gradient. This makes trend strength and distance-to-structure visually intuitive.
🔹 4. Higher‑Timeframe Swing Trend (htfTrend)
Swing highs/lows from a higher timeframe (e.g., 4H) are plotted to show macro structure. Used only for visual context, not for filtering entries.
🔹 5. RSI‑Based Entry Protection
RSI prevents entries during extreme overbought/oversold conditions.
🔹 6. Dynamic Exit System
Includes:
Custom stop‑loss (%)
Partial take‑profit (TP1/TP2/TP3)
Automatic scale‑out when trend color weakens
“Color‑change lockout” to prevent immediate re‑entry
Real‑time PnL tracking and labels
🔹 7. Alerts for All Key Events
Entry, stop‑loss, partial exits, and trend‑change exits all generate structured JSON alerts.
🔹 8. Visual PnL Labels & Equity Tracking
PnL for the latest trade is displayed directly on the chart, including scale‑out adjustments.
⚙️ Input Parameters
Parameter Description
Fast EMA / Slow EMA EMAs used for symbol trend detection
Index Fast / Slow EMA EMAs applied to external index
StopLoss (%) Custom stop‑loss threshold
Scale‑Out % Portion to exit when trend color weakens
RSI Period / Levels Overbought/oversold filters
Swing Detection Length Bars used to detect swing highs/lows
Stats Display Position of statistics table
🧭 About htfTrend (Higher Timeframe Trend)
The higher‑timeframe swing trend is displayed visually but not used for entry logic.
Why? Strict HTF filtering reduces trade frequency and often removes profitable setups. By keeping it visual‑only, traders retain flexibility while still benefiting from macro structure awareness.
Use it as a contextual guide, not a constraint.
📘 概要
本ストラテジーは、V1 を大幅に拡張した EMA × ダウ理論 × スイング構造 × 上位足トレンド可視化 の複合型モデルです。 短期〜デイトレード向けに最適化されており、仮想通貨・FX・株式・指数など幅広いアセットで利用できます。
V2 では、スイング構造の自動検出、グラデーションによるトレンド強度の可視化、上位足スイングライン、動的な利確/損切りロジック が追加され、視覚的にもロジック的にも大幅に強化されています。
🧠 主な機能
🔹 1. 銘柄+外部インデックスの EMA クロス判定
対象銘柄と OTHERS.D の EMA を比較し、相関を考慮したトレンド方向を判定します。
🔹 2. ダウ理論に基づくスイング高値・安値の自動検出
スイング更新によりトレンド方向を切り替える、構造ベースのトレンド判定を採用。
🔹 3. グラデーション背景によるトレンド強度の可視化
スイングラインから現在価格までを段階的に塗り分け、 「どれだけトレンドが伸びているか」を直感的に把握できます。
🔹 4. 上位足スイングトレンド(htfTrend)の表示
4H などの上位足でのスイング高値・安値を表示し、 大局的なトレンド構造を視覚的に把握できます(ロジックには未使用)。
🔹 5. RSI による過熱・売られすぎフィルター
極端な RSI 状態でのエントリーを防止。
🔹 6. 動的イグジットシステム
カスタム損切り(%)
TP1/TP2/TP3 の段階的利確
トレンド色の弱まりによる自動スケールアウト
色変化後の再エントリー制限(waitForColorChange)
リアルタイム PnL の追跡とラベル表示
🔹 7. アラート完備(JSON 形式)
エントリー、損切り、部分利確、トレンド反転などすべてに対応。
🔹 8. 損益ラベル・統計表示
直近トレードの損益をチャート上に表示し、視覚的に把握できます。
⚙️ 設定項目
設定項目名 説明
Fast / Slow EMA 銘柄の EMA 設定
Index Fast / Slow EMA 外部インデックスの EMA 設定
損切り(%) カスタム損切りライン
部分利確割合 トレンド弱化時のスケールアウト割合
RSI 期間・水準 過熱/売られすぎフィルター
スイング検出期間 スイング高値・安値の検出に使用
統計表示位置 テーブルの表示位置
🧭 上位足トレンド(htfTrend)について
上位足スイングの更新に基づくトレンド判定を表示しますが、 エントリー条件には使用していません。
理由: 上位足を厳密にロジックへ組み込むと、トレード機会が大幅に減るためです。
本ストラテジーでは、 「大局の把握は視覚で、エントリーは柔軟に」 という設計思想を採用しています。
→ 裁量で利確判断や逆張り回避に活用できます。

Low-High Waves for NeowaveOpen your chart at daily and hide the symbol graphic. Now you can see the waves. It’s including limited data sorry for this but I’m not a programmer and TradingView have limitations.

OCC Strategy Optimized (MA 5 + Delayed TSL)# OCC Strategy Optimized (MA 5 + Delayed TSL) - User Guide
## Introduction
The **OCC Strategy Optimized** is an enhanced version of the classic **Open Close Cross (OCC)** strategy. This strategy is designed for high-precision trend following, utilizing the crossover logic of Open and Close moving averages to identify market shifts. This optimized version incorporates advanced risk management, multi-timeframe analysis, and a variety of moving average types to provide a robust trading solution for modern markets.
>
> **Special Thanks:** This strategy is based on the original work of **JustUncleL**, a renowned Pine Script developer. You can find their work and profile on TradingView here: (in.tradingview.com).
---
## Key Features
### 1. Optimized Core Logic
- **MA Period (Default: 5):** The strategy is tuned with a shorter MA length to reduce lag and capture trends earlier.
- **Crossing Logic:** Signals are generated when the Moving Average of the **Close** crosses the Moving Average of the **Open**.
### 2. Multi-Timeframe (MTF) Analysis
- **Alternate Resolution:** Use a higher timeframe (Resolution Multiplier) to filter out noise. By default, it uses $3 \times$ your current chart timeframe to confirm the trend.
- **Non-Repainting:** Includes an optional delay offset to ensure signals are confirmed and do not disappear (repaint) after the bar closes.
### 3. Advanced Risk Management
This script features a hierarchical exit system to protect your capital and lock in profits:
- **Fixed Stop Loss (Initial):** Protects against sudden market reversals immediately after entry.
- **Delayed Trailing Stop Loss (TSL):**
- **Activation Delay:** The TSL only activates after the trade reaches a specific profit threshold (e.g., 1%). This prevents being stopped out too early in the trade's development.
- **Ratchet Trail:** Once activated, the stop loss "ratchets" up/down, never moving backward, ensuring you lock in profits as the trend continues.
- **Take Profit (TP):** A fixed percentage target to exit the trade at a pre-defined profit level.
### 4. Versatility
- **12 MA Types:** Choose from SMA, EMA, DEMA, TEMA, WMA, VWMA, SMMA, HullMA, LSMA, ALMA, SSMA, and TMA.
- **Trade Direction:** Toggle between Long-only, Short-only, or Both.
- **Visuals:** Optional bar coloring to visualize the trend directly on the candlesticks.
---
## User Input Guide
### Core Settings
- **Use Alternate Resolution?:** Enable this to use the MTF logic.
- **Multiplier for Alternate Resolution:** How many charts higher the "filter" timeframe should be.
- **MA Type:** Select your preferred moving average smoothing method.
- **MA Period:** The length of the Open/Close averages.
- **Delay Open/Close MA:** Use `1` or higher to force non-repainting behavior.
### Risk Management Settings
- **Use Trailing Stop Loss?:** Enables the TSL system.
- **Trailing Stop %:** The distance the stop follows behind the price (Optimized Default: 1.5%).
- **TSL Activation % (Delay):** The profit % required before the TSL starts moving. (Optimized Default: 2.0% to ensure 0.5% profit is locked immediately).
- **Initial Fixed Stop Loss %:** Your hard stop if the trade immediately goes against you.
- **Take Profit %:** Your ultimate profit target for the trade.
---
## How to Trade with This Strategy
1. **Identify the Trend:** Look for the Moving Average lines (Close vs Open) to cross.
2. **Wait for Confirmation:** If using MTF, ensure the higher timeframe also shows a trend change.
3. **Manage the Trade:** Let the TSL work. With the default **2.0% Activation** and **1.5% Trail**, the strategy will automatically lock in **0.5% profit** the moment the threshold is hit, then follow the price higher.
4. **Position Sizing:** Adjust the `Properties` tab in the script settings to match your desired capital allocation (Default is 10% of equity).
---
## Recommended Settings
1. Trialing < Activation
2. Check ranging
## Credits
Original Strategy by: **JustUncleL**
Optimized and Enhanced by: **Antigravity AI**

TRS (Trend Readiness System)TRS – Trend Readiness System
TRS (Trend Readiness System) is a trend-aligned trading framework designed to help you identify stocks that are becoming ready for entry , not just those already breaking out.
Instead of producing noisy buy/sell signals, TRS evaluates trend quality, pullback structure, momentum rebuilding, and market context , and converts them into clear scores, states, and timing awareness — both on the chart and inside the TradingView Screener.
---
Core Philosophy
Strong trends don’t start at the breakout — they start when conditions quietly align.
TRS focuses on:
• Primary trend alignment
• Healthy pullbacks above long-term support
• Early momentum recovery
• Market regime confirmation
• Entry timing (fresh vs late)
---
What TRS Measures
1. Setup Score (Trend Quality)
Answers the question: “Is this stock structurally worth watching?”
Based on:
• Price position relative to MA150
• Long-term trend direction
• Higher-low structure
• Distance from MA150 (overextension control)
• Market regime (bullish / bearish)
---
2. Entry Score (Timing Quality)
Answers the question: “Is the timing right — or still early?”
Based on:
• Short and mid-term moving averages
• Pullback behavior
• Momentum stabilization
• Volume confirmation
---
3. General Score
A combined readiness score used for ranking in the TradingView Screener:
General Score = Setup Score + Entry Score
---
Entry State Tracking (Key Feature)
TRS tracks the full entry lifecycle , not just signals:
• Valid Entry
• Pending Entry (almost ready)
• Bars Since Valid Entry
• Entry Window (Fresh / Expired)
• Entry Still Valid (Yes / No)
This helps avoid chasing late or already-played setups.
---
Market Regime Filter
Signals automatically adapt to overall market conditions:
• Market trend confirmation (e.g. SPY / QQQ)
• Reduced false signals during weak markets
• Clear explanation when setups are blocked
---
Visual Dashboard (Optional)
The on-chart dashboard can display:
• General Score
• Market state
• Setup quality
• Entry status
• Entry window
• Bars since entry
• Blocking reason (if any)
You can switch between:
• Minimal mode – essential info only
• Full table mode – detailed diagnostics
---
Screener Integration
TRS exposes clean numeric outputs for the TradingView Pine Screener:
• Setup Score
• Entry Score
• General Score
• Pending Entry (1 / 0)
• Valid Entry (1 / 0)
• Bars Since Valid Entry
• Market Bullish (1 / 0)
Example Screener Filters:
• Setup Score ≥ 50
• Pending Entry = 1
• Bars Since Valid Entry ≤ 3
• Market Bullish = 1
---
How to Use TRS (Daily Routine)
Step 1 – Scan
• Look for high Setup Score
• Prefer Pending Entry = 1
Step 2 – Review
• Confirm pullback quality
• Check MA150 support
• Observe momentum rebuilding
Step 3 – Act
• Enter only on Valid Entry
• Avoid expired entry windows
• Skip setups blocked by market regime
---
What TRS Is NOT
• Not a breakout chaser
• Not a day-trading system
• Not signal spam
TRS is a decision-support system for swing and position traders who value structure, context, and timing.
---
Best Used On
• Daily timeframe (1D)
• Liquid stocks & ETFs
• Trend-following strategies
• Portfolio-level screening
---

Heikin Ashi Wick Strategy
🔥 Heikin Ashi Wick Momentum Strategy
“Trade momentum decay before the trend breaks.
>> FOCUS ON WICKS, NOT ONLY CANDLE COLOR<<
What Makes This Different (Traffic Driver)
✔ Uses Heikin Ashi wicks (almost nobody does this correctly)
✔ Captures trend continuation, not breakouts
✔ Exits before momentum collapse, not after
✔ Non-repainting
✔ Clean charts, instant readability
This Strategy Is REALLY Trading
This is a Heikin Ashi momentum-decay system:
• Enters when trend is strong but not euphoric
• Exits when:
o Trend stops probing higher
o Sellers gain relative strength
It avoids:
• Chasing strong breakout candles
• Holding through momentum rollovers
Candle Type Used: Heikin Ashi (manually calculated)
NOTE: The script does not use regular candles.
It reconstructs Heikin Ashi (HA) candles from raw OHLC:
• HA Close = average of open, high, low, close
• HA Open = midpoint of prior HA candle (smoothed)
• HA High / Low = extremes of HA open/close vs real high/low
➡️ This filters noise and emphasizes trend structure and momentum.
Strengths
✅ Works well in strong, smooth trends
✅ Very clean logic (no indicators)
✅ Non-repainting
✅ Early exits protect capital
Best Use
This works best on:
• Daily timeframe
• Strong trend ETFs / megacaps
o QQQ
o SPY
o NVDA, MSFT, AAPL
• When combined with:
o EMA 21 trend filter (your preference)
o Market regime filter (e.g., above 50/200 SMA)
o Rising 10 EMA and 20 EMA
________________________________________
8️⃣ Weaknesses (Important)
⚠️ No stop loss (only structure-based exits)
⚠️ Can exit too early in explosive trends
⚠️ Will chop in sideways markets
⚠️ No volatility filter (ATR, EMA, regime)
How to Avoid the Weaknesses — Summary
Turn the setup from a concept into a robust strategy by adding these controls:
1. Trade Only Trends
o Require price above EMA-21 (optionally EMA-21 > EMA-50)
o Eliminates chop and sideways markets
2. Improve Exits (Avoid Leaving Winners Too Early)
o Partial exit when upper wick disappears
o Full exit only when lower wick dominates
o Optional: require 2 consecutive exit candles
3. Add Risk Protection
o Use a volatility stop: ~1.5× ATR(14) below entry or below HA swing low
o Protects against gaps and sudden reversals
4. Filter Weak Signals
o Require meaningful wick size (≈30–40% of candle range)
o Avoids low-quality indecision candles
5. Avoid Bad Volatility
o Skip entries when ATR is expanding aggressively
o Focus on calmer, controllable trends
6. Limit Time in Trade
o Add a max bars hold (e.g., 10–15 bars on daily)
o Prevents capital getting stuck in fading trends
⚠️ Educational use only. Not financial advice. Trading involves risk and losses can exceed expectations. Past performance does not guarantee future results. Use at your own risk.

Monday Range - User Defined LookbackEnglish Description
Monday Range Expansion & Multi-Week Projections
This indicator identifies the Monday Range (the price action from Monday's open at 00:00) and projects symmetric expansion levels across the entire trading week. It is designed for traders who use the weekly open and Monday's volatility as a benchmark for the week's price action.
Key Features:
Exact Monday 00:00 Start: Using advanced logic, the indicator pins the starting point precisely to the weekly open (Monday 00:00), ensuring no lag or offset regardless of your timeframe.
Symmetric Expansion Levels: It calculates the Monday High-Low range and projects a +100%, +50%, -50%, and -100% expansion, providing clear support and resistance targets.
User-Defined Lookback: You can choose exactly how many past weeks to display on your chart, keeping your workspace clean and focused.
Force Overlay Technology: All lines and labels use force_overlay, ensuring they always stay on the top layer, above candles and other indicators.
Weekly Freeze: Historical weeks stay "frozen" at their Friday closing points, allowing for clear backtesting of previous weekly levels.

CSA / Infinity MKR / Final Pro [NPR21}Title: CSA – Precision Infinity MKR & Confluence Dashboard
The Institutional Edge: Multi-Kernel Smoothing & Real-Time Confluence
The CSA Precision Infinity MKR is an advanced trend-following suite that replaces traditional, lagging EMAs with a high-performance Multi-Kernel Regression (MKR) engine. Designed for the "Top Center" of the chart, this script features our proprietary Infinity Bridge —a logic system that ensures your trend signal never breaks or snaps, tracking price action with surgical precision directly to the live candle.
Key Technical Features
1
7-Kernel Smoothing Engine: Unlike standard indicators, you can cycle through 17 different mathematical kernels (Sinc, Gaussian, Lorentzian, etc.) to match the specific volatility of any asset class, from high-cap Stocks to volatile Crypto.
The Infinity Bridge: We solved the "broken line" issue. Our script bridges historical regression math with live price data, providing a continuous, seamless trend line that never lags behind the current price.
15-Indicator Confluence HUD: A professional "Heads-Up Display" tracks 15 momentum and trend metrics (Heikin Ashi, SuperTrend, TTM, RSI, etc.) simultaneously. It does the heavy lifting so you can focus on execution.
High-Vis Neon Aesthetics: Built for dark-mode traders. Featuring Neon Fluorescent Green and Bright Red trend lines with a high-contrast dark green dashboard for zero eye strain.
Trader’s Manual: How to Trade the Suite
Step 1: Identify the Regime (The MKR Line)
Bullish: When the MKR line is Neon Green , you are in a buy-only regime.
Bearish: When the MKR line is Bright Red , you are in a sell-only regime.
The Curve: Watch the "hook" of the line. When the line begins to curve toward price, a trend shift is imminent.
Step 2: Confirm Confluence (The Dashboard)
Look at the CONFIRMED tally on the far right of the HUD:
Strong Buy (11/15 – 15/15): Deep green signal. High-probability entry.
Caution (7/15 – 10/15): Orange signal. The trend is weakening or consolidating.
No Trade (Below 7/15) : Red signal. High risk of "chop" or reversal. Avoid new entries.
Step 3: Check the "Non-Trending" Filter
Look for the Non-Trending cell. If it is Dark Blue , the market has officially entered a "Trending State." If it is Gray, the market is sideways, and signals should be taken with caution.
Settings & Customization
Thickness: Defaulted to 3px for a strong chart presence.
Styles: Fully adjustable Solid, Dashed, and Dotted options in the Inputs tab.
Alerts: Built-in alert conditions for Strong Confluence (11/15) and State Flips (Long to Short).

pD Zones [MMT]pD Zones plots a clean set of intraday high‑of‑day (HOD) and low‑of‑day (LOD) zones that automatically extend forward, flip color on mitigation, and archive as historical levels for context. It is designed to give intraday traders a simple visual map of premium/discount zones derived from a chosen calculation timeframe.
Overview
Objective : Highlight the current day’s HOD/LOD wick zones as actionable intraday support and resistance.
Core logic runs on a user‑selectable source timeframe (default 15m), then projects those zones onto any chart you are trading.
Zones extend into the future, react to price via mitigation logic, and then optionally roll into a dimmed historical layer.
Zone logic
Each session, the script tracks the extreme high and low plus their wick limits (open/close‑based) on the source timeframe to form two intraday zones.
When a new day starts, the finalized prior‑day zones are “locked in” and the current day begins tracking a fresh HOD/LOD pair.
Only one HOD and one LOD zone are created per day, reducing clutter and keeping focus on the most relevant levels.
Mitigation & color flips
Active HOD zones behave as resistance: a decisive break above the top of the box flips it to a bullish (supportive) color profile, while a move back below can re‑flip it.
Active LOD zones behave as support: a break below the bottom of the box flips it to a bearish profile, and a sustained reclaim can re‑flip it as well.
Once mitigated and carried into a new day, zones are restyled with a softer historical color so they remain visible but unobtrusive.
Alerts
When price breaks a HOD zone to the upside, the script can trigger an alert message noting that HOD resistance has been broken and showing the exact level.
When price breaks a LOD zone to the downside, an alert notes that LOD support has been broken, again with the precise price printed.
These alerts are meant for intraday confirmation of structure shifts at key daily extremes, rather than frequent scalper signals.
Inputs & customization
- Calculation Timeframe: choose which timeframe defines the daily HOD/LOD zones (e.g., 5m, 15m, 1h), independent from the chart.
- Visual Settings: customize support/resistance fill colors and border color to integrate with existing layouts.
- Logic Settings:
Max Active Zones: cap how many live zones remain on the chart at once to control noise.
Max Historical Zones: keep only the most recent historical levels or show all past days.
Zone Extension Offset (Bars): control how aggressively boxes project into the future.
- Mitigation Settings: choose the historical zone color to distinguish active levels from archived ones at a glance.

Long Position (Manual Setup)BINANCE:BTCUSDT
This script is for long position setup manually....
Just enter the following data ......
1. higher entry price
2. lower entry price
3. stop loss price
4. targets ( up to 5 targets)
5- extra targets ( up to 3 extra targets)
then you will have the long position draw in the chart with the trade summary including risk and reward percentage.

SMC Structure & Expectation [WavesUnchained]SMC Structure & Expectation - Professional Context & Confirmation Tool
A sophisticated Smart Money Concepts indicator that combines objective market structure analysis with intelligent expectation logic and professional order block validation. Built for traders who value context over signal spam.
4-LAYER ARCHITECTURE
Layer 1: Market Structure
✓ Objective HH/HL/LH/LL detection based on confirmed pivot swings
✓ Internal structure tracking (micro swings within major legs)
✓ Structure alignment detection (Internal + External agreement)
✓ No predictions - pure price action description
Layer 2: Expectation/Bias
✓ Logical hypotheses derived from current structure
✓ "Expect HL" in bullish structure / "Expect LH" in bearish structure
✓ "Expect Continuation" after BOS events
✓ Expectation ≠ Signal (can be wrong, that's the point)
Layer 3: Confirmation (BOS + Order Blocks)
✓ Break of Structure (BOS) detection with 2 modes:
• Conservative: Close-cross (default)
• Aggressive: High/Low-cross with optional close confirmation
✓ Professional Order Block System with 8 intelligent filters
✓ Only creates OBs when expectation is met
✓ Maximum 1 OB per direction (quality over quantity)
Layer 4: Optional Warnings
✓ Trendline break detection
✓ Early Top/Bottom warnings (volume + volatility divergence)
✓ Can be disabled for clean chart focus
PROFESSIONAL ORDER BLOCK SYSTEM
8 Quality Filters (Cascade Logic):
1. BOS-Only Guard : No OB without confirmed Break of Structure
2. Displacement Filter : Minimum 1.0 ATR momentum (customizable)
3. Location Filter : Must be in Premium (bearish) or Discount (bullish) zone
4. Size Filter : 3 modes available:
• Hard Limit: Reject oversized OBs (strict)
• Score Penalty: Allow but reduce priority (balanced, default)
• Disabled: No size filtering (permissive)
5. Volume Filter : Optional relative volume threshold
6. FVG Filter : Optional Fair Value Gap requirement
7. Mitigation Tracking : 30% penetration = mitigated (score penalty)
8. TTL (Time-To-Live) : Auto-delete after 80 bars (prevents chart clutter)
Priority Scoring System (0-100):
• HIGH Priority (>80) : Bright colors, zero transparency
• MED Priority (50-80) : Normal colors, 30% transparency
• LOW Priority (<50) : Faded colors, 60% transparency
Score Components:
✓ Displacement strength (10-30 points)
✓ FVG confluence (+20 points)
✓ Relative volume (+5-15 points)
✓ Premium/Discount location (+10-20 points)
✓ Structure alignment (+30 points if aligned, -15 if conflict)
✓ Leg strength (+15-25 points for strong impulse vs correction ratio)
✓ Size penalty (-0 to -30 points if oversized, Score Penalty mode only)
BAR COLORING MODES
Choose your preferred visual feedback:
1. Off : No bar coloring
2. Structure : Bullish/Bearish/Neutral structure states
3. Expectation : Continuation zones (green = expect bullish, red = expect bearish)
4. BOS + OB Priority (Default):
• Highlights active Order Blocks by priority
• BOS events in bright neon
• Faded structure colors when no OB active
5. Multi-Layer : Combines structure + priority intensity
6. Alignment : Shows Internal/External structure alignment (orange = conflict warning)
INTELLIGENT LOGGING SYSTEM
Priority-based log filtering to reduce noise:
• All : Every event (debug mode)
• MED+ : Only medium and high priority events
• HIGH Only : Only high priority setups
• Smart (Default): Adaptive filtering based on priority + context
Logs include:
✓ Structure changes (HH/HL/LH/LL)
✓ Expectation updates
✓ BOS events with confirmation status
✓ OB creation with full scoring breakdown
✓ OB reactions (Tap/Deep/Failure classification)
✓ Rejection reasons with "Potential Lost" analysis
CONFIGURATION HIGHLIGHTS
Layer 1: Structure
• Pivot detection length: 5 (left) / 5 (right)
• Internal structure: Optional micro-swing tracking
• Swing confirmation: Closes beyond pivot required
Layer 2: Expectation
• Expectation expiry: 40 bars (auto-reset after timeout)
• Visual feedback: Labels + optional expectation zones
Layer 3: Confirmation
• BOS Mode: Close-cross (conservative) / High/Low-cross (aggressive)
• Close Confirmation: Optional 3-bar window for aggro mode
• Displacement: Min 1.0 ATR (customizable)
• Size Filter Mode: Hard Limit / Score Penalty / Disabled
• OB Location: 38% discount / 62% premium thresholds
• OB Size Range: 0.3-1.2 ATR (customizable)
• TTL: 80 bars default
• Volume Filter: Optional, 1.0x minimum
• FVG Requirement: Optional
Layer 4: Warnings
• Trendline break detection
• Early Top/Bottom signals
• Can be fully disabled
BEST USE CASES
✓ Context Tool : Understand where you are in the market cycle
✓ Confirmation Filter : Validate trade ideas with structure alignment
✓ Order Block Trading : High-probability zones with priority scoring
✓ Educational : Learn SMC concepts with transparent logic
✓ Multi-Timeframe Analysis : Combine with HTF structure for confluence
Optimized for:
• Commodities (NatGas, Gold, Oil)
• 1H - 4H timeframes
• Swing trading / Intraday positioning
KEY FEATURES SUMMARY
✓ Zero signal spam - only high-conviction setups
✓ Transparent scoring system - know why each OB matters
✓ Adaptive to market conditions - structure alignment detection
✓ Flexible filtering - customize to your risk tolerance
✓ Priority-based visuals - instantly identify best opportunities
✓ Professional logging - learn from rejections and acceptances
✓ Clean chart - auto-cleanup with TTL system
✓ Bar coloring modes - choose your visual feedback style
✓ Size Filter Mode - prevent blocking of high-quality oversized setups
PHILOSOPHY
This indicator follows the principle: "Context over signals, quality over quantity"
Expectations can be wrong - that's the point. They help you stay aware of the most likely scenario while remaining open to structure changes. When expectation is met AND confirmed by BOS + quality OB, you get a high-conviction setup.
Not a holy grail. Not a signal service. A professional analysis tool.
Version: 1.0.0
Author: WavesUnchained
Pine Script: v6

RSI Divergences KittenRSI Divergences + Adjustable RSI σ-Bands + Band Pierce Signals (with optional US weekend filter)
Description:
This indicator combines three RSI tools into one clean workflow:
1. RSI σ-Bands (mean ± k·σ)
It builds dynamic upper/lower bands around RSI using a moving mean and standard deviation. These bands adapt to regime changes (expanding in volatile periods, contracting in quiet periods). Bands can be clipped to RSI’s natural 0–100 range and optionally filled for readability.
2. Band “Pierce” Signals
It prints a marker when RSI crosses outside the upper band (overextension) or outside the lower band (underextension). These pierces are useful as timing signals for mean-reversion setups, especially when you expect price to revert back toward a reference mean (e.g., VWAP). Optional “re-entry” markers show when RSI crosses back inside the bands.
3. Proper RSI Divergences (Regular + Hidden)
Divergences are detected using RSI pivots (not price pivots). At each RSI pivot, the script samples the corresponding price high/low on that pivot bar and compares it to the previous pivot within a configurable bar-distance window.
• Bullish divergence: price lower low + RSI higher low
• Hidden bullish: price higher low + RSI lower low
• Bearish divergence: price higher high + RSI lower high
• Hidden bearish: price lower high + RSI higher high
Line width is configurable for visibility.
Manual Band Adjustment (Near-Miss Control):
If your best reversals “nearly” tag the band, you can manually tune sensitivity without rewriting the math:
• Band offset (RSI points): nudges trigger levels
• Band width scale: tightens/widens the σ-band envelope
US Weekend Filter (Optional):
You can optionally suppress pierce/divergence signals during US weekend hours (Fri 17:00 ET → Sun 17:00 ET) and optionally shade those periods to help isolate low-liquidity behavior.
Notes / Intended Use:
This is designed as a mean-reversion timing tool, not a standalone trading system. For best results, combine signals with a market “mean” (e.g., rolling VWAP) and basic risk controls.

XAUUSD M15 momentum real Detects when xausd enters a healthy directional phase during the NY session, and only flags entries with real momentum and controlled volatility.


ORB FX REPLAY - FINAL SAFEHere is the description in English, written to sound professional and meet all the requirements for publishing on TradingView:
Script Description:
Title: ORB Strategy Backtest Pro - Ultra Compatibility
Description: This is an Opening Range Breakout (ORB) strategy specifically designed for professional backtesting. It is optimized to run smoothly on external platforms like FX Replay and TradingView's replay mode.
Key Features:
Custom Session: Automatically calculates the High and Low of a specific time window (default: 10:00 - 10:15 Bucharest/GMT+2).
Impulse Confirmation: Features a "Min Impulse" filter to ensure entries happen on strong momentum, avoiding "fake-outs" near the range boundaries.
Hard Target Management: Designed for "Set & Forget" backtesting. Once a trade is triggered, the script tracks it until it hits either the Stop Loss (SL) or the final Take Profit 3 (TP3).
Visual Projections: Draws clear, real-time lines for Entry, SL, and TP3 on the chart for easy visual tracking.
Automated Statistics: Includes a dynamic label system that tracks Total Trades, Win Count, and Loss Count based on the TP3/SL logic.
Optimized Code: Built using Pine Script v5 with a focus on stability and compatibility, avoiding complex tables that often cause errors on external engines.

Trend Pulse Channel StrategyOverview
Trend Pulse Channel Strategy is a long-only trend-following breakout strategy built around an adaptive multi-pole smoothing filter and a volatility-adjusted price channel.
The strategy is designed to participate in sustained directional moves by entering only when price confirms momentum strength beyond a dynamic upper boundary, while avoiding mean-reversion and low-quality consolidation phases.
This script is published as a strategy and includes realistic backtesting assumptions for position sizing, commissions, and slippage.
Core Concept
At the heart of the strategy is a multi-pole adaptive EMA-based filter, inspired by advanced digital signal smoothing techniques.
Using multiple poles allows the filter to reduce noise while preserving responsiveness to genuine trend changes.
To adapt the channel width to changing market conditions, the strategy applies the same filtering logic to True Range, producing a volatility-aware envelope rather than a static or fixed-percentage band.
This combination allows the strategy to:
Track directional bias using a smoothed central filter
Adjust channel width dynamically based on market volatility
Trigger entries only when price expansion confirms trend strength
Entry Logic
A long position is opened when:
Price crosses above the upper channel band
The signal occurs within the user-defined date range
This condition represents a volatility-confirmed breakout aligned with the prevailing directional filter.
Exit Logic
The long position is closed when:
Price crosses back below the upper band
This exit logic aims to stay in trending moves while exiting when upside momentum weakens.
The strategy does not open short positions by design.
Inputs and Defaults
The default inputs are selected to balance smoothness, responsiveness, and stability:
Source (HLC3): Reduces single-price noise by averaging high, low, and close
Period (144): Defines the primary smoothing horizon of the adaptive filter
Poles (4): Controls the smoothness vs. responsiveness trade-off
Range Multiplier (1.414): Scales the volatility envelope using filtered True Range
Reduced Lag (optional): Applies lag compensation to improve responsiveness
Fast Response (optional): Blends multi-pole and single-pole filters for quicker reaction at the cost of smoothness
All inputs are fully configurable and can be adjusted to suit different instruments and timeframes.
Risk Management & Position Sizing
The strategy uses:
Position size: 10% of equity per trade
No pyramiding
Long positions only
This sizing approach is intended to reflect sustainable risk exposure rather than aggressive capital deployment. Users may further adjust position size based on their own risk tolerance.
Backtesting Assumptions
The strategy is tested using :
Initial capital: 10,000
Commission: 0.1%
Slippage: 1 tick
Order fill model: Standard OHLC
These settings are chosen to provide more realistic performance estimates compared to idealized backtests.
This strategy is best suited for :
Trend-oriented markets
Higher timeframes where breakouts are more reliable
Users seeking systematic trend participation rather than frequent scalping
In sideways or range-bound market conditions, price may cross the channel boundaries frequently.
This can result in a higher number of entry and exit signals that do not develop into sustained trends.
For this reason, the strategy should be used with an understanding of basic technical analysis concepts, including market structure, trend identification, and consolidation behavior.
It is intended as a decision-support tool, not a standalone trading system.
Users—whether beginners or experienced traders—should avoid relying solely on this strategy and are encouraged to combine it with broader market context and additional analysis methods.
Disclaimer
This script is provided for educational and analytical purposes only. It does not constitute financial advice. Past performance does not guarantee future results.
