Liquidity Void and Repair EngineLiquidity Void & Repair Engine
OVERVIEW
The Liquidity Void & Repair Engine is a high-fidelity institutional order flow tool designed to identify and track "Market Imbalances" or "Fair Value Gaps" (FVG). Unlike standard gap indicators that clutter the chart with every minor price jump, this engine uses Volatility-Adjusted Range Mapping to isolate high-conviction voids where price moved so rapidly that liquidity was left "unfilled."
The standout feature of this tool is its Active Repair Logic. The engine doesn't just draw static boxes; it monitors price action in real-time to determine when an imbalance has been "healed" by subsequent trading volume, providing a dynamic look at where the market has "unfinished business."
TECHNICAL LOGIC & ORIGINALITY
This script is published Open Source to contribute to the Pine Script community’s understanding of dynamic object management and order flow visualization.
ATR-Relative Filtering: To ensure only significant voids are plotted, the script uses a user-defined ATR (Average True Range) multiplier. This filters out market noise and focuses on institutional "impulse" moves.
Dynamic Box Management: Utilizing the Pine Script box array system, the script manages memory efficiently by updating existing objects rather than creating redundant ones.
The "Repair" Algorithm: The script tracks the high and low of every active void. When price action fully traverses the coordinates of a void, the script "seals" the box, visually marking the moment of liquidity equilibrium.
HOW TO USE
1. Identifying the "Magnet" (The Void)
When price moves aggressively, it leaves a "hole" in the auction.
Bullish Voids (Green): These represent areas where price surged so fast that buyers may still have unfilled orders sitting below. These act as Magnets for pullbacks.
Bearish Voids (Red): These represent areas where price plummeted, leaving a vacuum of selling pressure. These act as Magnets for relief rallies.
2. Trading the "Repair" Process
The Engine tracks how the market "repairs" these holes:
Partial Fill: If price enters a box but doesn't cross it, the "Magnet" is still active.
Full Repair: When a box is "sealed" (stops extending right), it indicates the imbalance is gone. If price "Seals" a green box and then bounces, it confirms the zone as Valid Institutional Support.
3. Confluence with the Trend
Continuation: In a strong uptrend, look for price to drop into a Green Bullish Void and find support. This is often the "Golden Entry" for trend followers.
Reversal Confirmation: If price ignores a Red Bearish Void and blasts right through it (sealing it instantly), it signals a massive shift in market regime and extreme bullish conviction.
USER SETTINGS
Lookback Period: How far back the engine searches for un-repaired gaps.
Min Gap Size (ATR %): Increase this to see only the "Major" institutional gaps; decrease it for a more granular intraday look.
Visual Styles: Fully customizable colors and transparency to match any chart theme (Dark/Light).
NOTES & DISCLAIMER
This script is a visualization of historical price imbalances and is intended for educational purposes only. It does not provide trade signals, entry/exit points, or financial advice. All trading involves risk.
อินดิเคเตอร์และกลยุทธ์

Precision Trendlines - Relevant Current TFPrecision Structural Trendlines (Current TF)
Overview
The Precision Structural Trendlines indicator is a high-performance price action tool designed for traders who rely on market structure and trend convergence. Unlike standard trendline scripts that clutter the chart with every possible connection, this indicator strictly follows professional structural rules—connecting Lower Highs for resistance and Higher Lows for support.
Key Features
Structural Integrity: The engine ensures that resistance lines are only drawn during bearish sequences (Lower Highs) and support lines during bullish sequences (Higher Lows), aligning with core Price Action principles.
Dynamic Relevance Filter: Solve the "web of lines" problem. By default, the script only shows trendlines that are currently relevant to price. As price moves away from old trends, they fade out, keeping your workspace clean.
Zero Drift Synchronization: Built using absolute time-anchoring (xloc.bar_time), ensuring that trendlines stay perfectly "glued" to the candle wicks regardless of how much you scroll or zoom.
Customizable Aesthetics: Choose between Random Dark Colors to easily distinguish overlapping trends or a Static Color for a unified look. Global width controls allow for instant visibility adjustments.
How to Use
Trend Confirmation: Use the Minimum Points setting. Set it to 2 for aggressive, early trend detection, or 3 to only see lines that have been validated by multiple touches.
Major vs. Minor Swings: Adjust the Pivot Strength. A value of 30 (default) captures significant intraday turns, while 20+ is ideal for identifying major swing structure.
Relevance Buffer: Tune the Price Buffer % to determine how close price must be to a historical trendline before it reappears on your chart.
Settings Breakdown
Minimum Points: Number of pivot points required to anchor a line.
Pivot Strength: The "look-left/look-right" requirement to confirm a peak or valley.
Validation Tolerance: The vertical buffer allowed for a 3rd point to "hit" the trendline.
Show Relevant Only: Toggles the visibility filter (highly recommended for high-volume traders).

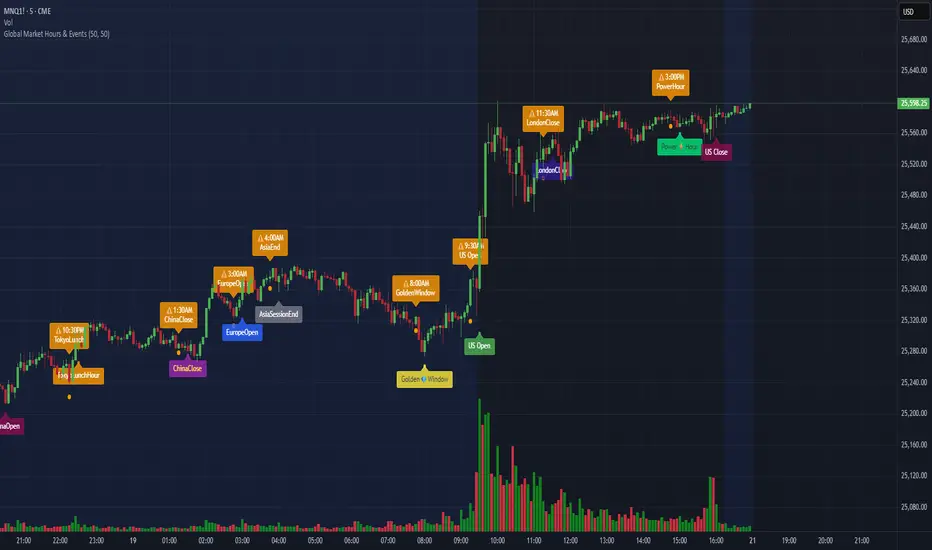
Global Market Hours & Eventswww.tradingview.com
Global Market opens and closes and other related events,
15min warning ahead of time, visual indicator for warning and for the event
not over-crowded with the possibility to remove labels and have just a little circle marker.
Adjustements for labels and circles are in the settings
Activate Pane Label to identify
Trinity Swing Trading Buy and SellThis is a simple little Heiken Ashi MA + ADX & MACD trend-following trading system designed to capture medium- to longer-term moves while filtering out noise and weak trends. It combines modified Heiken Ashi candles (for smoother trend detection) with a moving average alignment, plus optional confirmation from ADX (trend strength) and MACD (momentum).
In practice, the indicator works well on higher timeframes (e.g., 1H, 4H, daily) where trends are more sustained. It performs best in trending markets and naturally avoids choppy/range-bound conditions thanks to the ADX filter (requiring ADX > 20 by default). All key components are fully customizable, so you can disable filters or adjust parameters to suit different instruments (stocks, forex, crypto, futures).
Default settings are:
16 HMA
8,17,9 MACD
15,20 ADX
Recommend to add an additional longer term EMA like 200 for long term trend confirmation.
Adjust inputs in the settings panel as needed:
Toggle MA, ADX, or MACD filters on/off.
Change MA type/length, MACD parameters, ADX threshold
- Use the visual blue diamonds (below bars) for long entries and purple diamonds (above bars) for short entries as confirmation of signals.
- Set alerts on the "Buy Alert" and "Sell Alert" conditions if you want real-time notifications.
This setup gives you a complete, rule-based system that avoids emotional trading and repetitive entries, making it suitable for both backtesting and live trading with proper risk management.


Multi-Ticker Overlay V6 [SPY/QQQ/ES]Key Improvements in this Version:Triple Ticker Support: You now have three distinct sections in the settings (SPY, QQQ, and ES1!). You can toggle them on or off individually.Flexible Symbols: While I defaulted them to SPY, QQQ, and ES, you can use the Ticker Symbol input to change them to anything (e.g., change ES to "DIA" to see Dow Jones levels).Decimal Increments: I changed the increment to a float. You can now set SPY to 1.0 and QQQ to 0.5 or 5.0 depending on how much "clutter" you want.Individual Aesthetics:Colors: Each ticker has its own color picker.Labels: Labels are prefixed with the symbol name (e.g., "QQQ 450") so you don't get confused about which line belongs to which ticker.Smart Ratio Engine: All three tickers respect the "Freeze at 16:00" rule if you turn it on, ensuring the levels stay mathematically accurate based on the market close.Note on Performance: Because this script draws many lines (up to 3 tickers $\times$ 21 lines each), I set the extend to none. The lines will appear as short segments to the right of the current price to keep your chart clean.

V3 Valentini Pro Scalper [Dashboard]Gemini 3.0 pro's take on Fabio Valentini's world #1 strategy scalp 12/19/2025

Low-High Waves for NeowaveOpen your chart at daily and hide the symbol graphic. Now you can see the waves. It’s including limited data sorry for this but I’m not a programmer and TradingView have limitations.

ML Adaptive SuperTrend Strategy [trade_crush]# ML Adaptive SuperTrend Strategy - User Guide
## Introduction
The **ML Adaptive SuperTrend Strategy** is a sophisticated trading tool that combines traditional trend-following logic with **Machine Learning (K-Means Clustering)** to dynamically adapt to market volatility. Unlike standard SuperTrend indicators that use a fixed ATR, this strategy analyzes historical volatility to categorize the current market into distinct clusters, providing more precise entries and exits.
>
> **Special Thanks:** This strategy is based on the innovative work of **AlgoAlpha**. You can explore their extensive library of high-quality indicators and strategies on TradingView: (www.tradingview.com).
---
## Machine Learning Engine (K-Means)
The core of this strategy is its ability to "learn" from recent market behavior.
- **K-Means Clustering**: The script takes the last $N$ bars of ATR data and runs an iterative clustering algorithm to find three "centroids" representing **High**, **Medium**, and **Low** volatility.
- **Adaptive ATR**: Based on the current volatility, the strategy selects the nearest centroid to use as the ATR value for the SuperTrend calculation. This ensures the trailing stop tightens during low volatility and widens during high volatility to avoid "noise".
---
## Key Features
### 1. Non-Repainting Signals
- **Confirm Signals**: When enabled, signals are only triggered after a bar closes. This ensures that the arrows and entries you see on the chart are permanent and reliable for backtesting.
### 2. Intelligent Risk Management
- **Multiple SL/TP Types**: Choose between **Percentage** based stops or **ATR** based stops for both Stop Loss and Take Profit.
- **Trailing Stop Loss (TSL)**:
- Supports both Percentage and ATR modes.
- **Activation Offset**: Only activates the trailing mechanism after the price has moved a certain percentage in your favor, protecting early-stage trades.
### 3. Risk-Based Position Sizing
- **Dynamic Quantity**: If enabled, the strategy automatically calculates the trade size based on your **Risk % Per Trade** and the distance to your **Stop Loss**. This ensures you never lose more than your defined risk on a single trade.
---
## User Input Guide
### SuperTrend & ML Settings
- **ATR Length**: The window used to calculate market volatility.
- **SuperTrend Factor**: The multiplier that determines the distance of the trailing stop from the price.
- **Use ML Adaptive ATR**: Toggle between the ML-enhanced logic and standard ATR.
- **Training Data Length**: How many historical bars the ML engine analyzes to find clusters.
### Risk Management
- **Stop Loss Type**: Set to Percentage, ATR, or None.
- **TS Activation Offset**: The profit buffer required before the trailing stop starts following the price.
- **Use Risk-Based Sizing**: Toggle this to let the script manage your position size automatically.
---
## How to Trade with This Strategy
1. **Monitor the Dashboard**: Check the top-right table to see which volatility cluster the market is currently in.
2. **Observe the Fills**: The adaptive fills (green/red) visualize the "breathing room" the strategy is giving the price.
3. **Execution**: The strategy enters on "ML Bullish" (Triangle Up) and "ML Bearish" (Triangle Down) signals.
4. **Exits**: The script will automatically exit based on your SL, TP, or Trailing Stop settings.
---
## Credits
Original Concept: **AlgoAlpha**
Strategy Conversion & Enhancements: **Antigravity AI**

EMAs ChimuTraderPublicoscrip de emas 200 y 50 periodos para anlizar todo BINANCE:SOLUSDT y muchas monedas mas

MacroTide Elasticity SystemThe MacroTide Elasticity System is a professional-grade technical analysis tool designed to identify potential trend exhaustions and reversals by modeling price action as an elastic band stretched from a volume-weighted baseline. Unlike standard oscillators (like RSI) that only look at price changes, MacroTide integrates Volume, Price Range, and Volatility to gauge the "energy" behind a move.
1. Concepts and Methodology
The core concept is Mean Reversion based on Volume-Weighted Elasticity. Markets tend to snap back to a value consensus (mean) after over-extension.
Volume-Weighted Baseline: We use a Volume Weighted Moving Average (VWMA) rather than a simple SMA. This ensures that heavy-volume trading days pull the baseline closer to price, while low-volume drift allows the baseline to lag, accurately representing the "true" average cost.
Elasticity Physics: The oscillator calculates how far price has deviated from this VWMA baseline, measured in standard deviations. This creates a normalized "Elasticity Score" (0-100).
High Score (>80): Price is over-extended to the upside (Overbought) relative to volume support.
Low Score (<20): Price is over-extended to the downside (Oversold).
Institutional Absorption (Churn): The script detects specific bar anomalies where Volume is High but Price Range is Low. This pattern often indicates "Churn"—where institutions are absorbing supply or unloading positions without moving the price significantly.
2. Key Features
MacroTrend Detection: Visualizes the market's stretch limits.
Divergence Scanner: Automatically detects and labels Regular Bullish and Bearish divergences. This occurs when price makes a new extreme, but the Elasticity Oscillator fails to confirm it, signaling waning momentum.
Absorption Events: Highlights yellow "sun" markers on the oscillator when high-volume churn is detected, often preceding a breakout or reversal.
Dynamic Coloring: Candles and oscillator lines change color based on the slope of the elasticity (Green for rising momentum, Red for falling).
3. How to Use
Trend Reversals: Look for the oscillator to enter the Overbought (80) or Oversold (20) zones. A reversal signal (triangle marker) is generated when the oscillator crosses back out of these zones, indicating the "snap back" effect has begun.
Divergence Confirmation: Use the "DIV" labels as early warning signs. A Bullish Divergence in an oversold zone is a high-probability setup for a long entry.
Filtering Trends: The center line (50) acts as a trend filter. Above 50 indicates bullish bias; below 50 indicates bearish bias.
4. Settings & Customisation
Lookback Period: Default is 21 (Swing). Increase to 50 or 100 for Macro/Long-term analysis.
StdDev Multiplier: Adjusts the sensitivity of the bands. Higher values (e.g., 2.5 or 3.0) are better for volatile assets like Crypto.
Absorption Volume Factor: Threshold for detecting churn. Default is 1.5x average volume.
Disclaimer: This tool is for informational purposes only. Past performance (divergences/signals) does not guarantee future results. Always manage risk effectively.

Bullish/Bearish Movement SumThis indicator calculates and displays the cumulative sum of bullish and bearish price movements over a specified period.
Features:
- Green line: Cumulative sum of all bullish movements
- Red line: Cumulative sum of all bearish movements (absolute value)
- Blue area: Net difference (bullish - bearish)
- Information table showing current values and bull/bear ratio
Settings:
- Calculation Period: Choose rolling window size (default: 100 bars) or 0 for cumulative from start
- Calculation Mode: Choose between "Points" (absolute price changes) or "Percentage" (% changes)
Use Cases:
- Identify market directional strength
- Compare bullish vs bearish pressure
- Spot divergences between price and directional momentum
- Ratio > 1 indicates more bullish than bearish movement
Developed with assistance from Claude (Anthropic)

Rainbow Road [kingthies]Rainbow Road
Rainbow Road is a trend-structure and momentum visualization tool built around a cascading chain of smoothed simple moving averages. Instead of plotting independent moving averages on price, each line is progressively smoothed from the prior one using the same length, creating a layered “road” that reveals trend strength, direction, and transition with exceptional clarity.
OVERVIEW
Rainbow Road visualizes trend quality using a spectrum of fast-to-slow moving averages derived from one another. Because each average is smoothed from the prior line, the indicator forms a continuous structure rather than a collection of unrelated signals. This makes trend alignment, momentum expansion, and compression immediately visible.
HOW IT WORKS
The first average is a Simple Moving Average of price
Each subsequent average is an SMA of the previous average using the same length
This creates a cascading chain of averages with increasing smoothness
Colors progress from red (fastest) to purple (slowest) to represent trend hierarchy
HOW TO READ IT
Strong Trend : All averages are aligned and expanding in the same direction
Acceleration : Spacing between averages increases
Deceleration : Spacing narrows while direction remains intact
Consolidation : Averages converge and overlap
Reversal Risk : Faster averages cross back through the slowest average
TREND CONTEXT
The optional fill between the fastest and slowest averages visualizes overall trend pressure. Expanding fill suggests strengthening momentum, while contracting fill highlights compression and potential regime change.
USE CASES
Trend confirmation and directional bias
Momentum expansion vs compression analysis
Identifying trend exhaustion and early reversal zones
Contextual filtering for entries and exits
WHY RAINBOW ROAD
Traditional moving average stacks often produce clutter and redundant signals. Rainbow Road focuses on structure and flow, helping traders evaluate the quality of a trend rather than reacting to individual crossovers.
BEST USED WITH
Price action and market structure
Support and resistance
Volatility or range-based tools
Higher-timeframe trend bias
Rainbow Road is designed to sit quietly on your chart and clearly communicate whether the market is flowing, stalling, or preparing to turn.

Smart Money Concept Change of Character Break of StructureSMC Structure
Visualizes Change of Character (CHoCH) and Break of Structure (BoS) - two fundamental Smart Money Concepts for identifying trend reversals and continuations.
This is the 1st version of an implementation of this concept.
It is NOT supposed to be used as a signal but a confirmation. Best use during NYSE hours.
Full Description
Overview
This indicator automatically detects and displays two core Smart Money Concepts (SMC) directly on your chart:
CHoCH (Change of Character) – The first structural break against the prevailing trend, signaling a potential reversal
BoS (Break of Structure) – A structural break in the direction of the current trend, confirming continuation
These concepts are essential building blocks of SMC trading methodology, helping traders identify where institutional players may be entering or exiting positions.
How It Works
The indicator uses pivot-based swing detection to identify significant highs and lows. When price breaks through these levels, it classifies the move as either a CHoCH or BoS based on the current trend context.
CHoCH (Change of Character)
Occurs when price breaks structure AGAINST the current trend
First warning sign that the trend may be reversing
Displayed as a solid horizontal line with "CHoCH" label
Green = Bullish reversal | Red = Bearish reversal
BoS (Break of Structure)
Occurs when price breaks structure IN THE DIRECTION of the current trend
Confirms that the existing trend remains intact
Displayed as a dashed horizontal line with "BoS" label
Teal = Bullish continuation | Maroon = Bearish continuation
Visual Example
Uptrend with BoS (continuation):
HH ◄── BoS (trend continues)
/
HL
/
HH
/
HL
Uptrend → CHoCH → Downtrend (reversal):
HH
/ \
HL \
LL ◄── CHoCH (trend reversal!)
Settings
Pivot Settings
Pivot Lookback: Number of bars used to identify swing highs/lows (default: 5). Higher values = fewer but more significant structure points.
Display Options
Show CHoCH: Toggle CHoCH visualization
Show BoS: Toggle BoS visualization
Show Swing Points: Display SH/SL labels at detected pivots
Extend Lines to Right: Extend structure lines into future bars
Show Info Table: Display current trend and last swing levels
Show Trend Background: Color the chart background based on trend direction
Colors
Fully customizable colors for all elements
How to Use
Identify the trend: Look at the sequence of CHoCH and BoS signals to understand market structure
Watch for CHoCH: A CHoCH signals potential reversal – wait for confirmation before trading against the previous trend
Trade with BoS: BoS confirms trend continuation – look for entries on pullbacks in the direction of the trend
Combine with other SMC concepts: Works great alongside Order Blocks, Fair Value Gaps, and liquidity concepts
Tips
Use higher pivot lookback values on higher timeframes for cleaner signals
A CHoCH doesn't guarantee reversal – it's the first warning sign, not confirmation
Multiple BoS signals in a row indicate a strong, healthy trend
Look for CHoCH occurring at key levels (support/resistance, order blocks) for higher probability setups
Feedback Welcome!
This is an open-source indicator and I'd love to hear your thoughts!
Please comment below if you have:
Feature requests or ideas for improvements
Bug reports or issues
Suggestions for additional SMC concepts to add
Your feedback helps make this indicator better for everyone. Happy trading! 🚀

S_Sigma HTF Candles (UTC Draw / NY Labels)🕯️ S_Sigma HTF Candles (UTC Draw / NY Labels)
Multi-Timeframe Overlay with Session Labels & Imbalances
S_Sigma HTF Candles is a powerful, non-repainting overlay indicator that allows you to visualize up to 6 different Higher Timeframes (HTF) directly on your current chart.
Designed specifically for traders who need context without switching tabs, this tool draws accurate HTF candles using UTC time (standard for Crypto) while labeling them with New York Timezone data (standard for Stocks/Forex). It also detects Fair Value Gaps (FVG) and Volume Imbalances automatically.
🌟 Key Features
📊 6 Independent HTF Slots
Configure up to 6 different timeframes simultaneously (e.g., 15m, 1H, 4H, 1D, 1W). Each slot is customizable and can be toggled on/off independently.
🌍 UTC Drawing + NY Labels (The "Sigma" Edge)
Drawing: Candles are calculated strictly using UTC time to ensure wicks and bodies match exchange data (perfect for BTC/ETH).
Labels: Day of the Week (Mon/Tue/Wed) and Time labels are converted to America/New_York time. Never get confused by candle closes again.
#HTF Countdown Timer**
See exactly how much time is left until the Higher Timeframe candle closes. Essential for timing entries at the "Candle Close."
📈 Smart Imbalance Detection
FVG (Fair Value Gaps): Automatically highlights 3-candle reversal gaps.
VI (Volume Imbalance): Highlights wicks that pierce previous bodies.
🏗️ Custom Session Starts
Don't like the standard Daily candle? Force the Daily candle to open at 08:30 NY or 09:30 NY (Market Open) instead of Midnight UTC.
⚙️ Customization Options
Visuals: Full control over Bull/Bear colors, borders, wicks, and opacity.
Layout: Adjust padding, width, and spacing between timeframes to prevent overlap.
Trace Lines: Optional lines tracing the Open, High, Low, and Close of the forming HTF candle.
Labels: Toggle HTF names, Timers, and Day-of-Week labels on/off.
💡 How to Use
Add to Chart: The indicator draws candles to the right of the current price (offset) to keep your chart clean.
Check Alignment: Ensure the "Daily Name" matches your expected market session (NY Time).
Spot Entries: Look for price entering an FVG (Gray box) or hitting a HTF Support/Resistance level (Wick of the HTF candle).
Time Entries: Wait for the Timer to hit 00:00 for a confirmed candle close.
Perfect for: Smart Money Concepts (SMC), ICT, Wyckoff, and Multi-Timeframe Analysis.

SMA 20/50/100/200Simple Moving Averages indicator plotting the 20, 50, 100, and 200 SMAs based on the **active chart timeframe**. Designed to adapt dynamically as you change timeframes, it helps visualize short-, medium-, and long-term trend structure, momentum shifts, and dynamic support and resistance. Color-coded for clarity with consistent line thickness for clean, readable trend analysis.

QuantCrawler 5m ORB Pro - Opening Range with Confluence FiltersThis indicator captures the 5-minute Opening Range and generates entry signals using a breakout-then-retest methodology. It includes optional confluence filters to refine entries and reduce false signals.
HOW IT WORKS
1. Captures the 5-minute Opening Range (high, low, midpoint) at your selected session open
2. Waits for price to break beyond OR high or low by your defined distance
3. After breakout, monitors for price to retest the OR midpoint
4. Signals LONG after bullish breakout + midpoint retest
5. Signals SHORT after bearish breakout + midpoint retest
6. Marks invalidated signals with (X) if price breaks through the opposite side
PRE-CONFIGURED SESSIONS
- NYSE - 9:30-9:35 ET
- CME - 8:30-8:35 CT
- London - 3:00-3:05 ET
- Asia - 7:00-7:05 PM ET
- Custom - Define your own session times and timezone
BREAKOUT DISTANCE OPTIONS
Choose between fixed points or percentage-based breakout threshold. Percentage mode automatically scales to the instrument price.
CONFLUENCE FILTERS
Optional filters to add confirmation before signals fire:
- VWAP - Long requires price above VWAP, short requires below
- EMA Slope - Confirms trend direction using 20-period EMA
- Volume - Requires relative volume above 1.5x average
- FVG - Requires a Fair Value Gap supporting trade direction
- ATR - Filters Opening Ranges that are abnormally small or large relative to ATR
When filters block a valid setup, the indicator displays a BLOCKED label so you can see what you missed and why.
STATUS BOX
Real-time display showing:
- Current trade state (Building OR, Watching, Awaiting Retest, Long/Short Active)
- OR High, Low, and Midpoint levels
- Active filters and block reasons
ALERTS
Built-in alerts for Long Entry, Short Entry, or Any Entry.

EMA 9/21/50 BandEMA band indicator plotting the 9, 21, and 50 exponential moving averages based on the **active chart timeframe**. Designed to adapt dynamically as you change timeframes, helping visualize short-term momentum, trend alignment, and dynamic support and resistance. Useful for identifying trend strength, pullbacks, and momentum shifts without anchoring to a fixed higher timeframe.

QuantCrawler ORB Break & Retest 15m - Opening Range StrategyThis indicator automates the 15-minute Opening Range Breakout and Retest strategy. It captures the high, low, and midpoint of the first 15-minute candle, then monitors for confirmed breakouts followed by midpoint retests to generate entry signals.
HOW IT WORKS
1. Captures the high, low, and midpoint of the first 15-minute candle (default 8:00-8:15 premarket)
2. Waits for price to close beyond the OR high or low by your specified breakout distance
3. After breakout confirmation, monitors for price to pull back and touch the midpoint
4. Signals LONG after bullish breakout + midpoint retest
5. Signals SHORT after bearish breakout + midpoint retest
6. Resets after each signal allowing multiple setups per session
WHY 15-MINUTE ORB
The 15-minute Opening Range captures more price action than a 5-minute OR, often providing stronger support/resistance levels. The 8:00 AM default captures premarket activity before the 9:30 open, giving you levels established before the crowd arrives.
WHY BREAKOUT + RETEST
Entering on the initial breakout often results in chop and false signals. This indicator requires confirmation - price must first prove direction by closing beyond the breakout distance, then offer a pullback entry at the midpoint. This filters out many failed breakouts.
SETTINGS
- Breakout Distance - Points beyond OR zone required to confirm breakout
- Timezone - Select your market timezone
- Opening Range Time - Customizable (default 8:00-8:15)
- Session End Time - When to stop monitoring (default 4:00 PM)
VISUAL OUTPUT
- Green line - OR High
- Red line - OR Low
- Orange dotted line - OR Midpoint
- Status box displays current state (Watching, Active, Closed)
ALERTS
Built-in alerts for Long Entry, Short Entry, or Any Entry.
Works on any timeframe chart. The indicator pulls 15-minute data automatically using request.security().

Daily SMA 20/50/100/200Simple Moving Averages indicator displaying four commonly used trend lines on the price chart. Plots the 20, 50, 100, and 200 period SMAs to help identify short-, medium-, and long-term trend direction, dynamic support and resistance, and overall market structure. Color-coded for clarity: 20 SMA in green, 50 SMA in blue, 100 SMA in orange, and 200 SMA in red, with uniform line thickness for clean visual consistency.

Daily SMA 20/50/100/200Simple Moving Averages indicator displaying four commonly used trend lines on the price chart. Plots the 20, 50, 100, and 200 period SMAs to help identify short-, medium-, and long-term trend direction, dynamic support and resistance, and overall market structure. Color-coded for clarity: 20 SMA in green, 50 SMA in blue, 100 SMA in orange, and 200 SMA in red, with uniform line thickness for clean visual consistency.

RSI Monitor (High/Low) + MTF & Time FilterDual-Source RSI: Calculates RSI on the candle High (to detect selling pressure/overbought) and Candle Low (to detect buying pressure/oversold) rather than just the Close.
Multi-Timeframe (MTF) Dashboard: An on-screen table displays the Real-Time RSI High and Low values for your current chart plus two user-defined higher timeframes (e.g., 1H, 4H).
Session-Based Alerts: A built-in time filter restricts alerts to a specific trading window (e.g., 09:30–16:00), effectively blocking signals during low-volume overnight sessions.
Independent Alert Timeframe: You can configure alerts to monitor a specific timeframe (e.g., 60-min) regardless of the timeframe you are currently viewing.
Real-Time Execution: Alerts trigger immediately when levels are crossed (no bar-close confirmation required), ensuring you catch moves as they happen.

Statistical Deviation per AssetINDICATOR: STATISTICAL DEVIATION PER ASSET (SDPA)
1. Overview
The Statistical Deviation per Asset (SDPA) is a quantitative analysis tool designed to measure the strength and exhaustion of price movements. Unlike standard oscillators (like RSI ), the SDPA calculates the actual percentage deviation from the most recent pivot point (High or Low) and compares it against historical performance averages specific to each asset.
---
2. Core Logic & Calculation
The script operates on a Mean Reversion principle. It assumes that every asset (Gold, Bitcoin, Ethereum, etc.) has a unique "volatility signature" depending on the timeframe.
* Dynamic Pivot Detection : The indicator identifies recent Swing Highs and Swing Lows using an adaptive lookback period.
* Real-Time Return Calculation : Once a pivot is confirmed, the script calculates the real-time percentage gain (from a Low) or loss (from a High).
* Zero-Indexed Histogram : This return is plotted as an oscillator centered around a Zero Line , representing the current trend's progress since the last reversal.
---
3. Adaptive Intelligence (Multi-Asset & Multi-TF)
The SDPA is pre-loaded with a statistical database. It automatically adjusts its sensitivity and thresholds based on:
1. The Selected Asset : Whether trading XAUUSD , Bitcoin , or Solana , the deviation thresholds adapt to the specific volatility of that instrument.
2. The Timeframe (TF) : The calculation period ( period ) and performance targets ( hausse_perf / baisse_perf ) change dynamically. For example, a 1-minute scalping setup uses a longer lookback (200) compared to a Daily swing setup (10).
---
4. Visual Anatomy
The interface is designed for instant "at-a-glance" interpretation:
* The Histogram :
* Green : Price is trending up since the last Swing Low .
* Red : Price is trending down since the last Swing High .
* Threshold Lines (The Statistical Averages) :
* Thick Line (60% Opacity) : Represents the Average Historical Deviation . When the histogram hits this line, the move is considered "statistically mature."
* Thin Line (70% Opacity) : Represents the Strong Deviation Zone (1.5x the average), indicating extreme momentum or potential exhaustion.
* Background Highlighting : The chart background colors automatically when the price exceeds historical averages, signaling a High-Probability Reversal Zone .
---
5. How to Trade with SDPA
* Trend Maturity : If the histogram exceeds the Bullish Average (Green line), the current move has reached its typical historical limit. Traders should look for take-profit opportunities or wait for a reversal.
* Impulse Strength : A rapid move from the Zero Line toward the thresholds confirms strong institutional interest.
* Mean Reversion : When the histogram reaches the Strong Zone (1.5x), the price is "overextended" statistically, offering a high reward-to-risk ratio for counter-trend setups.
---
6. Technical Parameters
* Asset Choice : Dropdown menu to select the specific asset.
* Colors : Customizable Bullish and Bearish colors to match any UI theme.
* Precision : Set to 4 decimal places to ensure accuracy across all asset types.
