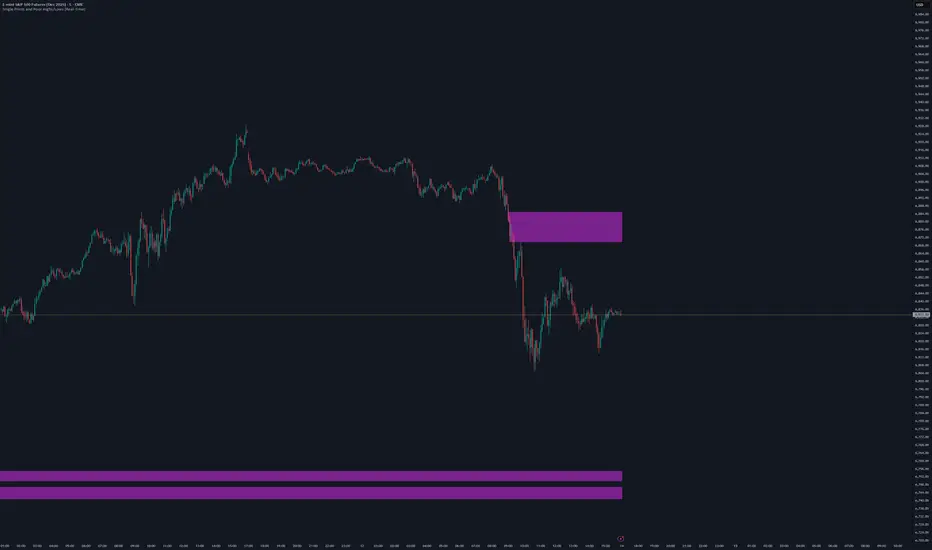
Single Prints and Poor Highs/Lows [Real-Time]This indicator is designed for traders utilizing Auction Market Theory (AMT) who need real-time visibility into market structure inefficiencies. Unlike standard TPO tools that often wait for closed bars or finished sessions, this script builds a developing TPO profile tick-by-tick to identify Single Prints and Poor Highs/Lows the moment they form.
Key Features:
Real-Time Single Prints: Automatically detects and highlights areas of single-print inefficiencies (buying/selling tails) as they happen. These "ghost" boxes persist on the chart until price repairs (fills) them, acting as immediate targets or support/resistance zones.
Poor High/Low Detection: Strictly implements AMT logic to identify "unfinished" auctions. If a session extreme is formed by two or more TPO blocks (indicating a flat top/bottom rather than a rejection tail), it marks the level with a dotted line.
Repair Logic: Both Single Prints and Poor High/Low lines are dynamic. If price revisits and repairs the structure, the markers automatically vanish to keep your chart clean.
Session Control: Fully customizable RTH (Regular Trading Hours) session input (default 08:30–15:15) to ensure profiles are built on relevant liquidity.
Quantization: Adjustable "Ticks per Block" allowing you to tune the sensitivity of the TPO profile to different assets (ES, NQ, CL, etc.).
How It Works:
TPO Construction: The script breaks the session into 30-minute periods (configurable) and tracks price overlap.
Single Prints: When the market expands rapidly, leaving gaps in the profile (single TPO blocks), a box is drawn. If price trades back through this box, it deletes itself.
Poor Extremes: It monitors the current session High and Low. If the extreme price level has a TPO count of ≥ 2, it is flagged as "Poor." If the extreme is a single print (count = 1), it is considered a valid tail and left unmarked.
Settings:
RTH Session: Define your specific trading session time.
TPO Period: Default is 30 minutes (standard AMT).
Ticks per Block: Controls the vertical resolution of the TPO. (Higher values = coarser profile, Lower values = more precision).
Colors: Fully customizable colors for Live Prints, Historical Prints, and Poor High/Low lines.
Usage:
Use this tool to spot immediate structural targets. A Poor High often acts as a magnet for price to revisit and "repair," while Single Prints often defend as support/resistance on the first retest.
อินดิเคเตอร์และกลยุทธ์
3 EMA with Alerts 2025This indicator plots three key EMAs (20, 50, and 200) directly on the chart, making it easy to track short-, medium-, and long-term trends. A color-coded table is displayed in the top-right corner for quick reference.
The script also includes smart alerts that trigger only when the state changes:
• 🔵 EMA 20 crossing above EMA 50 & EMA 200 → Bullish signal
• 🔴 EMA 20 crossing below EMA 50 & EMA 200 → Bearish signal
This tool is designed for traders who want clean visuals, reliable alerts, and simplified trend recognition in 2025 markets.

Volume Delta Divergence Candle ColorThis indicator identifies divergences between price action and volume delta, highlighting potential reversal or continuation signals by coloring candles when buyer/seller pressure conflicts with the candle's direction.
**How It Works:**
The indicator analyzes real-time up/down volume data to detect two types of divergences:
🟣 **Seller Divergence (Fuscia)** - Occurs when a candle closes bullish (green) but the volume delta is negative, indicating more selling pressure despite the upward price movement. This suggests weak buying or potential distribution.
🔵 **Buyer Divergence (Cyan)** - Occurs when a candle closes bearish (red) but the volume delta is positive, indicating more buying pressure despite the downward price movement. This suggests weak selling or potential accumulation.
**Features:**
✓ Colors only divergent candles - non-divergent candles maintain your chart's default colors
✓ Uses actual exchange volume delta data (works best with CME futures and other instruments with tick-level data)
✓ Optional triangle markers above/below divergent candles for quick visual identification
✓ Clean, minimal design that doesn't clutter your chart
**Best Used For:**
- Identifying potential reversals or continuations
- Spotting weak price movements that may not follow through
- Confirming price action with underlying volume pressure
- Works on any timeframe with available volume delta data
**Note:** This indicator requires volume data from exchanges that provide tick-level information (CME futures, cryptocurrency exchanges, etc.). Results may vary on instruments with limited volume data.

VIX Term Structure Pro [v7.0 Enhanced]# VIX Term Structure Pro v7.0
[! (img.shields.io)](www.tradingview.com)
[! (img.shields.io)](www.tradingview.com)
[! (img.shields.io)](LICENSE)
**Professional VIX-based Market Sentiment & Timing Indicator**
专业的 VIX 市场情绪与择时指标
---
## 🌟 Overview / 概述
VIX Term Structure Pro is an advanced multi-factor market timing indicator that analyzes the VIX futures term structure, volatility regime, and market breadth to generate actionable buy/sell signals.
VIX Term Structure Pro 是一款高级多因子市场择时指标,通过分析 VIX 期货期限结构、波动率区间及市场广度,生成可操作的买卖信号。
---
## 🚀 Key Features / 核心功能
### 📊 Multi-Factor Scoring System / 多因子评分系统
- **Term Structure Z-Score**: Measures deviation from historical mean / 期限结构 Z 分数:衡量与历史均值的偏离
- **VIX/VX1 Basis**: Spot premium detection for panic signals / VIX 现货溢价:恐慌信号检测
- **Contango Analysis**: Futures curve shape insights / 期货升水分析
- **SKEW Integration**: Options skew for tail risk / SKEW 整合:尾部风险监测
- **Put/Call Ratio**: Sentiment extremes / 看跌/看涨比率:情绪极端
- **VVIX Support**: Volatility of volatility (optional) / VVIX 支持:波动率的波动率
### 🎯 Three-Tier Signal System / 三级信号系统
| Signal | Score | Description |
|--------|-------|-------------|
| 🚨 **CRASH BUY** | ≥ 6 | Extreme panic, rare opportunity / 极端恐慌,罕见机会 |
| 🟢 **STRONG BUY** | ≥ 5 | Multi-factor confluence / 多因子共振 |
| 🟡 **BUY DIP** | ≥ 4 | Accumulate on weakness / 逢低吸纳 |
| 🟠 **SELL/HEDGE** | ≤ -2 | Consider reducing risk / 考虑减仓对冲 |
| 🔴 **STRONG SELL** | ≤ -5 | Strong bearish signals / 强烈看跌信号 |
| 🔥 **EUPHORIA SELL** | ≤ -6 | Extreme greed, sell signal / 极度贪婪,卖出信号 |
### 📈 Dashboard Indicators / 仪表盘指标解读
| Indicator | Bullish 🟢 | Bearish 🔴 |
|-----------|------------|------------|
| Overall Bias | STRONG BUY / BUY DIP | STRONG SELL / SELL/HEDGE |
| AI Score | ≥ 5 (Extreme Fear) | ≤ -5 (Extreme Greed) |
| Market Trend | 🟢SPX 🟢NDX (Above MA200) | 🔴SPX 🔴NDX (Below MA200) |
| VIX Regime | LOW VOL (<15) | HIGH VOL (>25) |
| Term Struct Z | < -2.0 (Panic) | > 2.0 (Complacency) |
---
## ⚙️ Configuration / 配置选项
### 📡 Data Sources / 数据源
- **VIX Symbol**: Default `CBOE:VIX` (Alternative: `TVC:VIX`)
- **Put/Call Ratio**: Default `INDEX:CPCI` (Index P/C)
- **Timeframe**: Daily (stable) or Chart (real-time)
### ⚠️ Strategy Mode / 策略模式
- **High (Scalping)**: Sensitive, for short-term trades / 高敏感,短线
- **Normal (Swing)**: Balanced approach / 平衡模式
- **Low (Trend/Safe)**: Conservative, trend-following / 保守,趋势跟踪
### 🔬 Backtest Mode / 回测模式
- **OFF (Real-time)**: Shows current day data, suitable for live monitoring / 显示当日数据,适合实盘监控
- **ON (Historical)**: Uses only confirmed data, avoids look-ahead bias / 仅使用已确认数据,避免未来函数
---
## 📖 Usage Guide / 使用指南
### Best Practices / 最佳实践
1. **Apply to SPX/SPY/QQQ daily charts** for optimal signal accuracy
在 SPX/SPY/QQQ 日线图上使用,信号准确度最佳
2. **Wait for next trading day** to execute signals (signals trigger on daily close)
信号触发后在下一交易日执行(信号基于日线收盘)
3. **Use in conjunction with price action** for confirmation
结合价格走势确认信号
4. **Enable Market Trend Filter** (MA200) for safer entries in uncertain markets
开启趋势过滤(MA200)以在不确定市场中更安全入场
### Signal Interpretation / 信号解读
```
🚨 CRASH BUY (Score ≥ 6)
→ Rare extreme panic event
→ Historical average return: significant positive over 2 months
→ Consider aggressive positioning
🟢 STRONG BUY (Score ≥ 5)
→ Multiple indicators align
→ Historical average return: positive over 1 month
→ Consider building positions
🟡 BUY DIP (Score ≥ 4)
→ Moderate fear detected
→ Suitable for adding to existing positions
→ Filtered out in bear markets if Trend Filter is ON
```
---
## 📊 Historical Statistics / 历史统计
The indicator tracks signal frequency and average subsequent returns:
- **CRASH BUY**: 40-day return period (~2 months)
- **STRONG BUY**: 20-day return period (~1 month)
- **BUY DIP**: 10-day return period (~2 weeks)
指标追踪信号频率和后续平均收益,可在仪表盘中查看历史统计。
---
## 🔔 Alerts / 警报
Built-in alert conditions with cooldown mechanism to prevent spam:
| Alert | Condition |
|-------|-----------|
| Crash Buy Alert | Score ≥ 6, extreme panic |
| Strong Buy Alert | Score ≥ 5, multi-factor confluence |
| Buy Dip Alert | Score ≥ threshold |
| Euphoria Sell Alert | Score ≤ -6, extreme greed |
| Strong Sell Alert | Score ≤ -5 |
| VIX Basis Panic | VIX spot premium spike |
---
## 📋 Changelog / 更新日志
### v7.0 (Current)
- ✨ Three-tier buy/sell signal system
- 📊 Signal statistics with average return tracking
- 🔬 Backtest Mode toggle for historical testing
- 🎨 Configurable ±1 Z-Score reference lines
- ⚡ Modular scoring functions
- 🛡️ Dual index trend display (SPX + NDX)
- 📱 Compact & Full dashboard modes
---
## ⚠️ Disclaimer / 免责声明
**English:**
This indicator is for educational and informational purposes only. It does not constitute financial advice. Past performance does not guarantee future results. Always do your own research and consider your risk tolerance before trading.
**中文:**
本指标仅供教育和信息参考,不构成投资建议。过往表现不代表未来收益。交易前请自行研究并评估风险承受能力。
---
## 📄 License / 许可证
MIT License - Feel free to use, modify, and share.
---
## 🤝 Contributing / 贡献
Issues and pull requests are welcome!
欢迎提交问题和贡献代码!
---
**Made with ❤️ for the trading community**
**为交易社区用心打造**

Index & Stock Options Reference Tool-(ISORT) [Arjo]The Index & Stock Options Reference Tool-(ISORT) is an indicator that helps users observe price trend direction together with commonly used option strike levels for selected indices and stocks in Indian market .
The indicator integrates a smoothed trend framework with structured option-related data to help users observe how price direction aligns with commonly referenced option strike levels .
It does not generate trading signals, does not provide buy or sell recommendations, and does not evaluate profitability .
Key Features
1. Trend Context Engine
Uses a Super-Smoother filter combined with EMA smoothing
Highlights directional context through color-based trend states
Designed to reduce short-term noise
2. Dynamic ATM & Strike Reference
Automatically computes ATM strike and offset strike levels to select OTM strike
Strike intervals adapt to the selected index or stock
Supports both NSE and BSE instruments, including SENSEX
3. Expiry Awareness
User-selectable expiry date inputs
Displays a visual warning if the selected expiry has already passed
Helps avoid referencing outdated option contracts
4. Option Price Reference Panel
Displays last observed CALL and PUT prices (when available)
Allows optional manual entry values for analytical comparison
All price values are shown strictly as references
5. Informational Table Overlay
Customizable on-chart table layout
Displays strike, timestamp, price reference, and arithmetic P&L values
Table values are informational only, not predictive or advisory
How to Use
1. Select the Underlying Instrument
Choose whether to reference the current chart symbol or a custom index/stock from the input settings
Supported instruments include major NSE indices, selected stocks, and SENSEX
2. Configure Expiry Parameters
Enter the option expiry date using the Day, Month, and Year inputs
If an expired date is selected, the indicator will display a visual warning
This helps ensure option references remain time-relevant
3. Observe Trend Context
The smoothed trend line provides directional context only
Color changes reflect shifts in price structure, not trade instructions
This trend is intended for contextual analysis, not timing entries
4. Review Strike References
The indicator automatically calculates ATM and offset strike levels
Strike spacing adjusts based on the selected index or stock
These values serve as reference levels commonly observed in options markets
5. Interpret the Information Table
The on-chart table displays:
Strike level
Timestamp of the most recent context change
Last observed option price (when available)
Arithmetic price difference values
All values are informational references only and do not represent performance or outcomes
6. Optional Manual Inputs
Manual price fields can be used to compare external reference values
These inputs do not trigger signals or automated calculations
Important Notes
This indicator is not a trading system
It does not generate buy or sell signals
It does not provide financial or trading advice
It is intended for learning, observation, and market study
Disclaimer
This script is provided for educational and analytical purposes only. It does not constitute investment advice, trading advice. The author assumes no responsibility for decisions made using this indicator.
Happy Trading (Arjo)

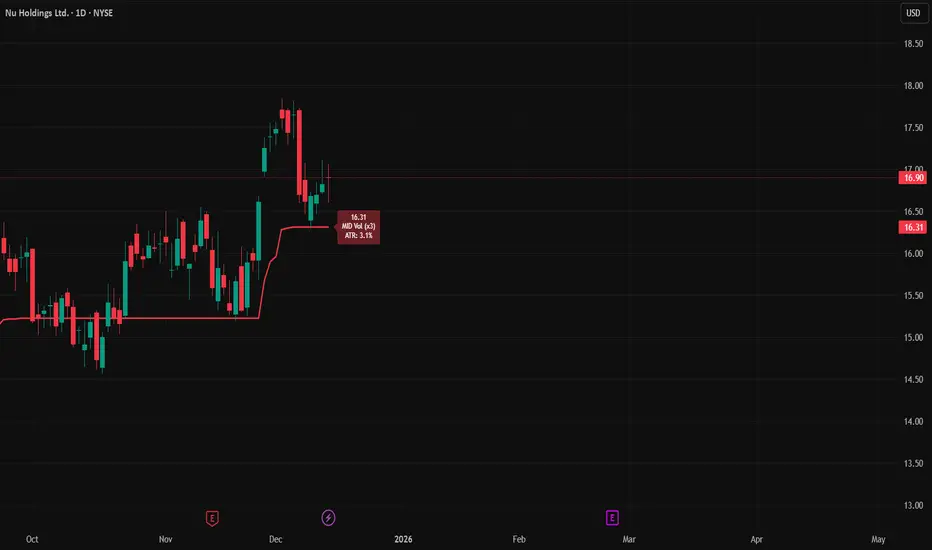
ATR Trailing StopATR Trailing Stop (Dynamic Volatility Regimes)
==============================================
This indicator implements an adaptive ATR-based trailing stop for long positions. The stop automatically adjusts based on stock volatility, tightening during fast movements and widening during calm periods. It is designed as a trade management tool to help protect profits while staying aligned with strong trends.
How It Works
------------
* Tracks the highest high over a configurable lookback window and ensures this “top” never moves downward.
* Computes the trailing stop as:**Top – ATR × Dynamic Multiplier**
* The ATR multiplier changes depending on volatility:
* Low volatility → Wide stop (slower trailing)
* Medium volatility → Standard trailing
* High volatility → Tight stop (faster trailing)
* The trailing stop only moves upward; it never decreases.
* If price falls significantly below the stop (default: 5%), the system resets and begins trailing from a new top.
* An optional price-scale label displays:
* Current stop value
* Volatility regime (LOW / MID / HIGH)
* ATR percentage and active multiplier
Alerts
------
Two alert conditions are included:
### Trailing Stop – Near
Triggers when price moves within a user-defined percentage above the stop.
### Trailing Stop – Hit
Triggers when price touches or closes below the stop.
How to Use
----------
1. Add the indicator to any chart (daily timeframe recommended).
2. Configure:
* ATR length
* Lookback bars
* Volatility thresholds
* ATR multipliers
3. Set alerts for early warnings or stop-hit events.
4. Use the stop line as a dynamic risk-management tool to guide exit decisions and protect profits.
Notes
-----
* Designed for long-only trailing logic.
* This indicator does not generate entry signals; it is intended for stop management.
Volatility High/Low Projection (PHOD / PLOD)AP Capital – Volatility + High/Low Projection
This indicator is designed to identify high-probability intraday turning points by combining daily range statistics, session behaviour, and volatility context into a single clean framework.
It is built for index, forex, and metals traders who want structure, not noise.
🔹 Core Features
1️⃣ Potential High of Day (PHOD) & Potential Low of Day (PLOD)
The indicator highlights likely intraday extremes based on:
Session timing (Asia, London, New York)
Current day volatility vs historical averages
Prior day expansion or compression behaviour
Each level is displayed with:
A clear label (PHOD / PLOD)
A forward-extending box acting as a live Point of Interest (POI)
Automatic invalidation when price breaks the zone
2️⃣ Volatility & Range Context (Info Panel)
A compact information panel in the top-right corner provides real-time context without cluttering the chart:
20-Day Average Range
% of the average range already used today
Range status (NORMAL / EXHAUSTED)
Average session ranges for:
Asia
London
New York
This allows traders to immediately assess whether price is:
Early in the day with room to trend
Statistically stretched and prone to reversal
Over-extended where breakout chasing is risky
3️⃣ Session-Aware Logic
The model respects how markets behave across the trading day:
Asia favours accumulation and potential lows
London provides expansion
New York often delivers distribution or exhaustion
This prevents random high/low marking and focuses only on structurally meaningful levels.
🧠 How to Use
Use PHOD / PLOD boxes as reaction zones, not blind entries
Combine with your own confirmation (structure break, momentum, volume, EMA reclaim, etc.)
Avoid chasing trades when the Range Status = EXHAUSTED
Particularly effective on 15m – 1h timeframes
⚠️ Important Notes
This indicator does not repaint
It is contextual, not a buy/sell signal generator
Best used as part of a complete trading plan
📈 Suitable Markets
XAUUSD (Gold)
Indices (NASDAQ, S&P 500, DAX)
Major FX pairs
📌 Disclaimer
This indicator is for educational and analytical purposes only.
It does not constitute financial advice. Trading involves risk.

Weekend Asia High/Low Dots + Trading Window (UTC+1)**Weekend Asia High/Low Dots & Trading Window** is a lightweight TradingView indicator designed to **mark the exact Asia session extremes on weekends (Saturday & Sunday)** and highlight predefined **trading time windows** with maximum clarity and minimal chart clutter.
The indicator focuses on **precision, simplicity, and manual trading workflows**.
---
### 🔍 Key Features
#### 🟢 Asia Session High & Low (Weekend Only)
* Tracks the **Asia session on Saturday and Sunday**
* Marks **exactly two points per session**:
* One dot at the **true wick high**
* One dot at the **true wick low**
* Dots are plotted **only once**, at the **end of the Asia session**
* **No lines, no boxes, no extensions** – just clean reference points
* Ideal for traders who prefer to **draw their own ranges manually**
#### 🟩 Trading Window Highlight
* Customizable **trading time windows** for Saturday and Sunday
* Displayed as a **clean outline box** (no background fill)
* Helps visually separate **range formation** from **active trading hours**
---
### ⏰ Time Handling
* All session times are defined in **UTC+1**
* Uses a **fixed UTC+1 timezone** (`Etc/GMT-1`) for consistent behavior
* Easily adjustable to other timezones if needed
---
### ⚙️ Customizable Inputs
* Asia session times (Saturday & Sunday)
* Trading session times (Saturday & Sunday)
* Optional trading window labels
* Easy point size adjustment directly in the code
---
### 🎯 Use Cases
* Weekend trading (Crypto, Indices, Synthetic markets)
* Asia range analysis
* Manual range drawing & breakout planning
* Clean, distraction-free chart layouts
---
### 🧠 Who Is This Indicator For?
* Price action traders
* Range & session-based traders
* Traders who prefer **manual chart markup**
* Anyone trading **weekends with structured time windows**
---
### 🛠 Technical Details
* Pine Script® **Version 6**
* Overlay indicator
* Optimized for clarity and performance
---
If you want, I can also provide:
* a **short description** (1–2 lines for the TradingView header)
* **tags & keywords** for better discoverability
* or a **version with user-adjustable dot size via Inputs**

ORB + Killzones - Universal AutoORB + Killzones • Universal Auto
A clean overlay indicator that automatically plots 15-minute Opening Range Breakout (ORB) levels for major global sessions with full DST handling and optional Killzone shading.
Key Features
Universal auto-detection: adapts session times and timezones perfectly for crypto (24/7) and traditional markets (cash hours only)
15-minute ORB high/low lines for Tokyo, Hong Kong, China, London, and New York sessions
Precise DST-aware London (Europe/London) and New York (America/New_York) sessions
Optional translucent Killzone background shading: London Open (0800–1100), NY Open (0930–1100), London Close (1530–1630) — with custom colors and transparency
Individual toggle switches for each session ORB and Killzone display
Clean neon color scheme matching popular retrowave setups (Tokyo teal, HK magenta, China red, London blue, NY gold)
Efficient drawing with persistent lines that extend until session end
No repainting, low resource usage (max 250 lines, 60 labels)
Ideal for ICT/SMC traders who want accurate multi-session ORBs and high-probability Killzone windows on any instrument or timeframe. Works on forex, indices, stocks, and crypto.
Recommend to uncheck timeframes over 1 hour in the Visibility tab of the Settings.

FOMC Sweep Reaction AP Capital – FOMC Sweep Reaction v1.0
AP Capital – FOMC Sweep Reaction v1.0 is a news-reaction and liquidity-based trading tool designed specifically to track and trade FOMC volatility on Gold (XAUUSD) and other highly reactive instruments.
The indicator focuses on liquidity sweeps, structure breaks, and EMA reclaims that commonly occur around Federal Reserve interest-rate decisions and Powell speeches, helping traders identify high-probability reversal or continuation moves after the initial spike.
🔍 What This Indicator Detects
This tool highlights the most repeatable FOMC behaviours observed across multiple months of broker data:
• Sweeps of previous day’s high or low
• Stop-hunt wicks into liquidity pools
• EMA13 reclaim after the news spike
• Break and close beyond short-term structure
• Momentum shift following volatility exhaustion
The goal is not to predict the news, but to react to confirmed price behaviour after liquidity has been taken.
📌 Core Features
• FOMC Sweep Detection
Identifies aggressive wicks into prior highs/lows during news volatility
• EMA Reclaim Confirmation
Uses EMA13 to validate momentum shift after the sweep
• Market Structure Awareness
Filters reactions that fail to break structure to avoid false reversals
• Session-Aligned Logic
Designed around London → NY → FOMC release timing
• Clean Visuals
Minimal chart clutter for fast decision-making during volatile conditions
🧠 How to Use
Wait for FOMC release / Powell speech
Allow price to sweep previous liquidity (PDH / PDL / local extremes)
Observe reclaim of EMA13
Enter only after structure confirmation
Manage trade using EMA trailing or structure-based exits
⚠️ This is a reaction system, not a prediction tool.
📊 Best Use Cases
• XAUUSD (Gold)
• NASDAQ / US indices
• High-impact macro news events
• 5-min to 15-min timeframes
⚠️ Important Notes
• News volatility is extreme — risk management is essential
• Not designed for low-volatility or ranging markets
• Best combined with a clear trading plan and strict risk rules
📎 Disclaimer
This indicator is for educational purposes only and does not constitute financial advice. Trading during high-impact news events involves significant risk.


Zee's A+ MOMO BreakThis just shows an indicator when you have a 5 minute momentum candle that breaks PMH under specific parameters, i.e candle size, wick size, relative volume, time of day, etc. It will plot the PMH with a gold line automatically. Entry would be at the close of the MOMO break. I highly encourage you to back test your results and see how strong this setup is. Any questions feel free to comment or reach out, thanks.

Round Strike Price, Levels Options Series➤ Strike Price Range Mode:
➤ Exact Strike Price Mode:
⭐ Overview and How It Works
Round Strike Price or Levels is a precision-focused visual tool designed for options and index traders.
It dynamically plots round strike levels around the current price and presents them either as:
⠀ — Exact strike prices, or
⠀ — Strike price ranges, where each zone represents the midpoint between two adjacent strikes.
The indicator continuously recalculates the base strike using the current price and aligns all surrounding levels using a fixed step size.
All lines and labels are updated only on the last bar for optimal performance and stability.
This makes StrikePrice ideal for:
🔹 Identifying key option strikes.
🔹 Visualizing price acceptance zones.
🔹 Understanding strike-to-strike movement during intraday trading.
⭐ Key Features and Functionality
Strike Price Range:
⠀ — Treats each pair of strike lines as a price zone.
⠀ — Labels are plotted at the midpoint between two lines.
⠀ — Last label is intentionally hidden (no upper range exists)
Exact Strike Price:
⠀ — Labels are plotted directly on each strike line.
⠀ — Useful for precise strike-based analysis.
Dynamic Base Calculation:
⠀ — Automatically snaps price to the nearest round strike.
⠀ — Re-centers the entire grid as price moves.
⠀ — No manual adjustment required.
Efficient Object Management:
⠀ — Uses persistent arrays for lines and labels.
⠀ — Objects are reused instead of recreated.
⠀ — Prevents flickering and avoids TradingView object limits.
🎨 Visualizations and User Experience
Clean horizontal strike grid with configurable:
⠀ — Line width, Line color, Line style (Solid / Dashed / Dotted), Extension direction (Left / Right / Both / None).
Labels are:
⠀ — Positioned to the right of price, Size-adjustable, Fully customizable in text color and background color.
Designed to stay visually clear even on:
⠀ — Fast-moving intraday charts, Options-focused layouts, Multi-indicator setups.
Tip: Increase Right Bars Margin in chart settings to give labels proper spacing.
⭐ Settings and Customization
🔹 Strike Settings:
⠀ — Step (points): Distance between adjacent strike levels (e.g., 50, 100)
⠀ — Levels per side: Number of strike levels plotted above and below the base.
⠀ — Strike Mode: Strike Price Range, Exact Strike Price.
🔹 Line Settings:
⠀ — Line width, Line color, Line style (Solid / Dashed / Dotted), Line extension direction.
🔹 Label Settings:
⠀ — Show / hide labels, Label distance (bars to the right), Label size, Label text color, Label background color.
All label properties are updated dynamically, allowing real-time UI tuning without reloading the script.
⭐ Uniqueness of the Concept:
Unlike generic round-number indicators, StrikePrice:
⠀ — Understands option-style strike structure.
⠀ — Separates range-based thinking from exact price levels.
⠀ — Uses midpoint logic to visualize strike-to-strike movement.
⠀ — Maintains strict performance discipline by updating only when necessary.
This makes it especially useful for:
⠀ • NIFTY / BANKNIFTY options.
⠀ • Index and futures traders.
⠀ • Intraday strike rotation analysis.
⠀ • Premium decay and range-bound setups.
🚀 Conclusion:
StrikePrice is a focused, professional-grade indicator for traders who think in strikes, ranges, and levels rather than arbitrary prices.
It offers:
⠀ • Clear structure
⠀ • Accurate strike alignment
⠀ • Clean visuals
⠀ • Zero repainting logic

PCR Put-Call Ratio//@version=5
indicator("PCR Put-Call Ratio", overlay=false, precision=4)
// Input parameters
pcrLength = input(20, "PCR Length", group="Settings")
maLength = input(5, "MA Length", group="Settings")
showOI = input(true, "Use Open Interest", group="Settings")
// Get PCR data from CBOE (requires daily data availability)
pcrData = request.security("CBOE:PC", "D", close)
// Calculate moving average of PCR
pcrMA = ta.sma(pcrData, maLength)
// Levels for interpretation
overbought = 1.2
oversold = 0.6
neutral = 0.9
// Plot PCR value
plot(pcrData, title="PCR Value", color=color.blue, linewidth=2)
plot(pcrMA, title="PCR MA", color=color.orange, linewidth=1)
// Add reference lines
hline(overbought, "Overbought (Bearish)", color.red, linestyle=hline.style_dashed)
hline(neutral, "Neutral", color.gray, linestyle=hline.style_dotted)
hline(oversold, "Oversold (Bullish)", color.green, linestyle=hline.style_dashed)
// Background coloring based on sentiment
bgColor = pcrData > overbought ? color.new(color.red, 80) :
pcrData < oversold ? color.new(color.green, 80) :
color.new(color.gray, 90)
bgcolor(bgColor)

ICT Premium/Discount Zones [Exponential-X]Premium/Discount Zones - Visual Market Structure Tool
Overview
This indicator helps traders visualize premium and discount price zones based on recent market structure. It automatically identifies swing highs and lows within a specified lookback period and divides the price range into three key areas: Premium Zone, Equilibrium, and Discount Zone.
What This Indicator Does
The script continuously monitors price action and calculates:
Highest High and Lowest Low within the lookback period
Equilibrium Level - the midpoint between the swing high and low
Premium Zone - the area from equilibrium to the swing high (typically viewed as relatively expensive price levels)
Discount Zone - the area from the swing low to equilibrium (typically viewed as relatively cheap price levels)
Core Calculation Method
The indicator uses pivot point logic to identify significant swing highs and lows based on the pivot strength parameter. It then calculates the highest high and lowest low over the specified lookback period. The equilibrium is computed as the arithmetic mean of these two extremes, creating a fair value reference point.
The zones are dynamically updated as new price data becomes available, ensuring the visualization remains relevant to current market conditions.
Key Features
Dynamic Zone Detection
Automatically adjusts zones based on recent price action
Uses customizable lookback period for flexibility across different timeframes
Employs pivot strength parameter to filter out minor price fluctuations
Visual Clarity
Color-coded zones for easy identification (red for premium, green for discount)
Optional equilibrium line display
Adjustable zone label placement
Customizable color schemes to match your charting preferences
Alert Capabilities
Alerts when price enters the premium zone
Alerts when price enters the discount zone
Alerts when price returns to equilibrium
Helps traders monitor key zone interactions without constant chart watching
Customization Options
Adjustable lookback period (5-500 bars)
Configurable pivot strength for swing detection (1-20 bars)
Control over box extension into the future
Toggle labels and equilibrium line on/off
Full color customization for all visual elements
How to Use This Indicator
Setup
Add the indicator to your chart
Adjust the lookback period to match your trading timeframe (shorter for intraday, longer for swing trading)
Set pivot strength to filter out noise (higher values for major swings, lower for more frequent updates)
Customize colors and labels to your preference
Interpretation
Premium Zone: Price trading here may indicate potential resistance or selling opportunities when aligned with other technical factors
Discount Zone: Price trading here may indicate potential support or buying opportunities when aligned with other technical factors
Equilibrium: Acts as a fair value reference point where price often consolidates or reacts
Trading Applications
This tool works well when combined with other forms of analysis such as:
Trend identification indicators
Volume analysis
Support and resistance levels
Price action patterns
Market structure analysis
Important Considerations
This indicator identifies zones based purely on historical price data
Premium and discount zones are relative to the recent lookback period
The effectiveness varies across different market conditions and timeframes
Should be used as part of a comprehensive trading strategy, not in isolation
Past price structure does not guarantee future price behavior
Technical Details
Calculation Method
Uses Pine Script's ta.pivothigh() and ta.pivotlow() functions for swing detection
Employs ta.highest() and ta.lowest() for range calculation
Updates dynamically with each new bar
Draws zones using box objects for clear visual representation
Performance Optimization
Efficiently manages box and line objects to minimize resource usage
Uses conditional plotting to reduce unnecessary calculations
Limited to essential visual elements for chart clarity
Timeframe Compatibility
This indicator works on all timeframes but the recommended settings vary:
1-5 minute charts: Lookback period 10-20, Pivot strength 3-5
15-60 minute charts: Lookback period 20-50, Pivot strength 5-10
Daily charts: Lookback period 50-100, Pivot strength 10-15
Weekly charts: Lookback period 20-50, Pivot strength 5-10
Adjust these values based on the volatility of your specific instrument.
Limitations and Considerations
What This Indicator Does NOT Do
Does not provide buy or sell signals on its own
Does not predict future price movements
Does not account for fundamental factors or market events
Does not guarantee profitability or accuracy
Market Condition Awareness
In strong trending markets, price may remain in premium or discount zones for extended periods
During ranging conditions, price typically oscillates between zones more predictably
High volatility can cause frequent zone recalculations
Low volatility may result in narrow zones with limited practical use
Risk Considerations
Premium and discount are relative concepts, not absolute values
What appears as a discount zone may continue lower in a downtrend
What appears as a premium zone may continue higher in an uptrend
Always use proper risk management and position sizing
Consider multiple timeframe analysis for context
Version Information
This indicator is written in Pine Script v6, ensuring compatibility with the latest TradingView features and optimal performance.
Final Notes
This tool is designed to enhance your market analysis by providing a clear visual representation of premium and discount price zones. It should be used as one component of a well-rounded trading approach that includes proper risk management, multiple forms of analysis, and realistic expectations about market behavior.
The concept of premium and discount zones is rooted in auction market theory and the idea that price oscillates around fair value. However, traders should understand that these zones are interpretive tools based on historical data and do not constitute trading advice or predictions about future price action.
Remember to backtest any strategy using this indicator on historical data before applying it to live trading, and always trade responsibly within your risk tolerance.
Disclaimer: The information provided by this indicator is for educational and informational purposes only. It does not constitute financial advice, investment advice, trading advice, or any other sort of advice. Always conduct your own research and consult with qualified financial professionals before making trading decisions.

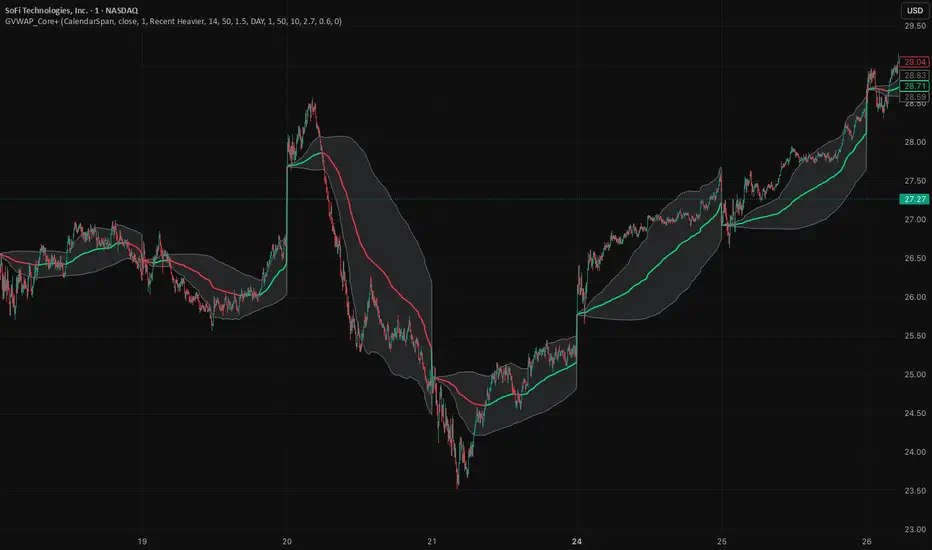
GVWAP_Core (CalendarSpan + EventSpike)GVWAP Core Indicator
General Description (Public)
GVWAP (Generalized Volume-Weighted Average Price) is an advanced anchoring and averaging framework designed to reveal market structure rather than predict price. Unlike traditional VWAP, GVWAP is not limited to volume weighting or session-based anchoring. It can operate on any input series (price, indicators, transforms) and supports multiple weighting schemes, decay behavior, and structural reset logic.
At its core, GVWAP answers a simple question: “Where is the statistically relevant center of activity since the last meaningful structural event?”
The indicator continuously updates a weighted average of the input series, gradually forgetting older data using exponential decay. The anchor point can reset on calendar boundaries (day, week, month, etc.) or on statistically significant events such as abnormal volume spikes. Robust dispersion bands based on mean absolute deviation (MAD) surround the average, providing context for trend, rotation, and compression regimes.
GVWAP is not a trading signal by itself. It is best used as a structural reference layer or as an intermediate transform feeding other indicators, strategies, or regime filters.
Mathematical Description (Quantitative)
Let x_t be an arbitrary input series and w_t a selectable weight function. GVWAP is defined as a normalized exponentially decayed weighted estimator:
GVWAP_t = N_t / D_t
with recursive updates:
N_t = (1 − α)·N_{t−1} + α·w_t·x_t
D_t = (1 − α)·D_{t−1} + α·w_t
where α = 1 − 2^(−1/H) and H is the decay half-life in bars.
Weights may be defined as:
• w_t = V_t (volume)
• w_t = 1 (equal weight)
• w_t = 1 / ATR_t (volatility-normalized)
• w_t = f(n_t) (time-weighted, where n_t is bars since reset)
The estimator resets when a structural condition R_t is satisfied, at which point:
N_t = w_t·x_t, D_t = w_t
For event-based anchoring, volume surprise is computed using a Student‑t–compressed z‑score:
z_t = (V_t − μ_V) / σ_V
tZ_t = z_t / sqrt(1 + z_t² / ν)
A reset occurs when tZ_t exceeds a threshold τ.
Dispersion is measured via a decayed Mean Absolute Deviation:
MAD_t = (Σ λ^{t−i} w_i |x_i − GVWAP_t|) / (Σ λ^{t−i} w_i)
Bands are defined as GVWAP_t ± k·MAD_t.
GVWAP therefore represents a bounded-memory, robust, non‑Gaussian estimator of the local conditional expectation of x_t under dynamic anchoring and weighting.
Relative Strength IndexRSI for indian market buy low and sell high.
rsi 3 low belo 15 buy and rsi high above 85 sell

Pro trade by Amit// This work is licensed under Creative Commons Attribution-NonCommercial-ShareAlike 4.0 International License (CC BY-NC-SA 4.0) creativecommons.org
//@version=5
import HeWhoMustNotBeNamed/utils/1 as ut
import Trendoscope/ohlc/1 as o
import Trendoscope/LineWrapper/1 as wr
import Trendoscope/ZigzagLite/2 as zg
import Trendoscope/abstractchartpatterns/5 as p
import Trendoscope/basechartpatterns/6 as bp
indicator("Installing Wait....", "Automatic Chart Pattern", overlay = true, max_lines_count=500, max_labels_count=500, max_polylines_count = 100)
openSource = input.source(open, '', inline='cs', group='Source', display = display.none)
highSource = input.source(high, '', inline='cs', group='Source', display = display.none)
lowSource = input.source(low, '', inline='cs', group='Source', display = display.none)
closeSource = input.source(close, '', inline='cs', group='Source', display = display.none, tooltip = 'Source on which the zigzag and pattern calculation is done')
useZigzag1 = input.bool(true, '', group = 'Zigzag', inline='z1', display = display.none)
zigzagLength1 = input.int(8, step=5, minval=1, title='', group='Zigzag', inline='z1', display=display.none)
depth1 = input.int(55, "", step=25, maxval=500, group='Zigzag', inline='z1', display=display.none, tooltip = 'Enable and set Length and Dept of Zigzag 1')
useZigzag2 = input.bool(false, '', group = 'Zigzag', inline='z2', display = display.none)
zigzagLength2 = input.int(13, step=5, minval=1, title='', group='Zigzag', inline='z2', display=display.none)
depth2 = input.int(34, "", step=25, maxval=500, group='Zigzag', inline='z2', display=display.none, tooltip = 'Enable and set Length and Dept of Zigzag 2')
useZigzag3 = input.bool(false, '', group = 'Zigzag', inline='z3', display = display.none)
zigzagLength3 = input.int(21, step=5, minval=1, title='', group='Zigzag', inline='z3', display=display.none)
depth3 = input.int(21, "", step=25, maxval=500, group='Zigzag', inline='z3', display=display.none, tooltip = 'Enable and set Length and Dept of Zigzag 3')
useZigzag4 = input.bool(false, '', group = 'Zigzag', inline='z4', display = display.none)
zigzagLength4 = input.int(34, step=5, minval=1, title='', group='Zigzag', inline='z4', display=display.none)
depth4 = input.int(13, "", step=25, maxval=500, group='Zigzag', inline='z4', display=display.none, tooltip = 'Enable and set Length and Dept of Zigzag 4')
numberOfPivots = input.int(5, "Number of Pivots", , 'Number of pivots used for pattern identification.', group='Scanning', display = display.none)
errorThresold = input.float(20.0, 'Error Threshold', 0.0, 100, 5, 'Error Threshold for trend line validation', group='Scanning', display = display.none)
flatThreshold = input.float(20.0, 'Flat Threshold', 0.0, 30, 5, 'Ratio threshold to identify the slope of trend lines', group='Scanning', display = display.none)
lastPivotDirection = input.string('both', 'Last Pivot Direction', , 'Filter pattern based on the last pivot direction. '+
'This option is useful while backtesting individual patterns. When custom is selected, then the individual pattern last pivot direction setting is used',
group='Scanning', display=display.none)
checkBarRatio = input.bool(true, 'Verify Bar Ratio ', 'Along with checking the price, also verify if the bars are proportionately placed.', group='Scanning', inline = 'br', display = display.none)
barRatioLimit = input.float(0.382, '', group='Scanning', display = display.none, inline='br')
avoidOverlap = input.bool(true, 'Avoid Overlap', group='Scanning', inline='a', display = display.none)
repaint = input.bool(false, 'Repaint', 'Avoid Overlap - Will not consider the pattern if it starts before the end of an existing pattern '+
'Repaint - Uses real time bars to search for patterns. If unselected, then only use confirmed bars.',
group='Scanning', inline='a', display = display.none)
allowChannels = input.bool(true, 'Channels', group='Pattern Groups - Geometric Shapes', display = display.none, inline='g')
allowWedges = input.bool(true, 'Wedge', group='Pattern Groups - Geometric Shapes', display = display.none, inline='g')
allowTriangles = input.bool(true, 'Triangle', group='Pattern Groups - Geometric Shapes', display = display.none, inline='g',
tooltip = 'Channels - Trend Lines are parralel to each other creating equidistance price channels'+
' \t- Ascending Channel \t- Descending Channel \t- Ranging Channel'+
' Wedges - Trend lines are either converging or diverging from each other and both the trend lines are moving in the same direction'+
' \t- Rising Wedge (Expanding) \t- Rising Wedge (Contracting) \t- Falling Wedge (Expanding) \t- Falling Wedge (Contracting)'+
' Triangles - Trend lines are either converging or diverging from each other and both trend lines are moving in different directions'+
' \t- Converging Triangle \t- Diverging Triangle \t- Ascending Triangle (Contracting) \t- Ascending Triangle (Expanding) \t- Descending Triangle(Contracting) \t- Descending Triangle(Expanding)')
allowRisingPatterns = input.bool(true, 'Rising', group='Pattern Groups - Direction', display = display.none, inline = 'd')
allowFallingPatterns = input.bool(true, 'Falling', group='Pattern Groups - Direction', display = display.none, inline = 'd')
allowNonDirectionalPatterns = input.bool(true, 'Flat/Bi-Directional', group='Pattern Groups - Direction', display = display.none, inline = 'd',
tooltip = 'Rising - Either both trend lines are moving up or one trend line is flat and the other one is moving up.'+
' \t- Ascending Channel \t- Rising Wedge (Expanding) \t- Rising Wedge (Contracting) \t- Ascending Triangle (Expanding) \t- Ascending Triangle (Contracting)'+
' Falling - Either both trend lines are moving down or one trend line is flat and the other one is moving down.'+
' \t- Descending Channel \t- Falling Wedge (Expanding) \t- Falling Wedge (Contracting) \t- Descending Triangle (Expanding) \t- Descending Triangle (Contracting)'+
' Flat/Bi-Directional - Trend Lines move in different directions or both flat.'+
' \t- Ranging Channel \t- Converging Triangle \t- Diverging Triangle')
allowExpandingPatterns = input.bool(true, 'Expanding', group='Pattern Groups - Formation Dynamics', display = display.none, inline = 'f')
allowContractingPatterns = input.bool(true, 'Contracting', group='Pattern Groups - Formation Dynamics', display = display.none, inline='f')
allowParallelChannels = input.bool(true, 'Parallel', group = 'Pattern Groups - Formation Dynamics', display = display.none, inline = 'f',
tooltip = 'Expanding - Trend Lines are diverging from each other.'+
' \t- Rising Wedge (Expanding) \t- Falling Wedge (Expanding) \t- Ascending Triangle (Expanding) \t- Descending Triangle (Expanding) \t- Diverging Triangle'+
' Contracting - Trend Lines are converging towards each other.'+
' \t- Rising Wedge (Contracting) \t- Falling Wedge (Contracting) \t- Ascending Triangle (Contracting) \t- Descending Triangle (Contracting) \t- Converging Triangle'+
' Parallel - Trend Lines are almost parallel to each other.'+
' \t- Ascending Channel \t- Descending Channel \t- Ranging Channel')
allowUptrendChannel = input.bool(true, 'Ascending ', group = 'Price Channels', inline='uc', display = display.none)
upTrendChannelLastPivotDirection = input.string('both', '', , inline='uc', group='Price Channels', display = display.none,
tooltip='Enable Ascending Channel and select the last pivot direction filter. Last pivot direction will only be used if the Generic Last Pivot Direction parameter is set to Custom')
allowDowntrendChannel = input.bool(true, 'Descending', group = 'Price Channels', inline='dc', display = display.none)
downTrendChannelLastPivotDirection = input.string('both', '', , inline='dc', group='Price Channels', display = display.none,
tooltip='Enable Descending Channel and select the last pivot direction filter. Last pivot direction will only be used if the Generic Last Pivot Direction parameter is set to Custom')
allowRangingChannel = input.bool(true, 'Ranging ', group = 'Price Channels', inline='rc', display = display.none)
rangingChannelLastPivotDirection = input.string('both', '', , inline='rc', group='Price Channels', display = display.none,
tooltip='Enable Ranging Channel and select the last pivot direction filter. Last pivot direction will only be used if the Generic Last Pivot Direction parameter is set to Custom')
allowRisingWedgeExpanding = input.bool(true, 'Rising ', inline='rwe', group = 'Expanding Wedges', display = display.none)
risingWedgeExpandingLastPivotDirection = input.string('down', '', , inline='rwe', group='Expanding Wedges', display = display.none,
tooltip='Enable Rising Wedge (Expanding) and select the last pivot direction filter. Last pivot direction will only be used if the Generic Last Pivot Direction parameter is set to Custom')
allowFallingWedgeExpanding = input.bool(true, 'Falling ', inline='fwe', group = 'Expanding Wedges', display = display.none)
fallingWedgeExpandingLastPivotDirection = input.string('up', '', , inline='fwe', group='Expanding Wedges', display = display.none,
tooltip='Enable Falling Wedge (Expanding) and select the last pivot direction filter. Last pivot direction will only be used if the Generic Last Pivot Direction parameter is set to Custom')
allowRisingWedgeContracting = input.bool(true, 'Rising ', inline='rwc', group = 'Contracting Wedges', display = display.none)
risingWedgeContractingLastPivotDirection = input.string('down', '', , inline='rwc', group='Contracting Wedges', display = display.none,
tooltip='Enable Rising Wedge (Contracting) and select the last pivot direction filter. Last pivot direction will only be used if the Generic Last Pivot Direction parameter is set to Custom')
allowFallingWedgeContracting = input.bool(true, 'Falling ', inline='fwc', group = 'Contracting Wedges', display = display.none)
fallingWedgeContractingLastPivotDirection = input.string('up', '', , inline='fwc', group='Contracting Wedges', display = display.none,
tooltip='Enable Falling Wedge (Contracting) and select the last pivot direction filter. Last pivot direction will only be used if the Generic Last Pivot Direction parameter is set to Custom')
allowRisingTriangleExpanding = input.bool(true, 'Ascending ', inline='rte', group = 'Expanding Triangles', display = display.none)
risingTriangleExpandingLastPivotDirection = input.string('up', '', , inline='rte', group='Expanding Triangles', display = display.none,
tooltip='Enable Ascending Triangle (Expanding) and select the last pivot direction filter. Last pivot direction will only be used if the Generic Last Pivot Direction parameter is set to Custom')
allowFallingTriangleExpanding = input.bool(true, 'Descending', inline='fte', group = 'Expanding Triangles', display = display.none)
fallingTriangleExpandingLastPivotDirection = input.string('down', '', , inline='fte', group='Expanding Triangles', display = display.none,
tooltip='Enable Descending Triangle (Expanding) and select the last pivot direction filter. Last pivot direction will only be used if the Generic Last Pivot Direction parameter is set to Custom')
allowExpandingTriangle = input.bool(true, 'Diverging ', inline='dt', group = 'Expanding Triangles', display = display.none)
divergineTriangleLastPivotDirection = input.string('both', '', , inline='dt', group='Expanding Triangles', display = display.none,
tooltip='Enable Diverging Triangle and select the last pivot direction filter. Last pivot direction will only be used if the Generic Last Pivot Direction parameter is set to Custom')
allowRisingTriangleConverging= input.bool(true, 'Ascending ', inline='rtc', group = 'Contracting Triangles', display = display.none)
risingTriangleContractingLastPivotDirection = input.string('up', '', , inline='rtc', group='Contracting Triangles', display = display.none,
tooltip='Enable Ascending Triangle (Contracting) and select the last pivot direction filter. Last pivot direction will only be used if the Generic Last Pivot Direction parameter is set to Custom')
allowFallingTriangleConverging = input.bool(true, 'Descending', inline='ftc', group = 'Contracting Triangles', display = display.none)
fallingTriangleContractingLastPivotDirection = input.string('down', '', , inline='ftc', group='Contracting Triangles', display = display.none,
tooltip='Enable Descending Triangle (Contracting) and select the last pivot direction filter. Last pivot direction will only be used if the Generic Last Pivot Direction parameter is set to Custom')
allowConvergingTriangle = input.bool(true, 'Converging ', inline='ct', group = 'Contracting Triangles', display = display.none)
convergingTriangleLastPivotDirection = input.string('both', '', , inline='ct', group='Contracting Triangles', display = display.none,
tooltip='Enable Converging Triangle and select the last pivot direction filter. Last pivot direction will only be used if the Generic Last Pivot Direction parameter is set to Custom')
allowedPatterns = array.from(
false,
allowUptrendChannel and allowRisingPatterns and allowParallelChannels and allowChannels,
allowDowntrendChannel and allowFallingPatterns and allowParallelChannels and allowChannels,
allowRangingChannel and allowNonDirectionalPatterns and allowParallelChannels and allowChannels,
allowRisingWedgeExpanding and allowRisingPatterns and allowExpandingPatterns and allowWedges,
allowFallingWedgeExpanding and allowFallingPatterns and allowExpandingPatterns and allowWedges,
allowExpandingTriangle and allowNonDirectionalPatterns and allowExpandingPatterns and allowTriangles,
allowRisingTriangleExpanding and allowRisingPatterns and allowExpandingPatterns and allowTriangles,
allowFallingTriangleExpanding and allowFallingPatterns and allowExpandingPatterns and allowTriangles,
allowRisingWedgeContracting and allowRisingPatterns and allowContractingPatterns and allowWedges,
allowFallingWedgeContracting and allowFallingPatterns and allowContractingPatterns and allowWedges,
allowConvergingTriangle and allowNonDirectionalPatterns and allowContractingPatterns and allowTriangles,
allowFallingTriangleConverging and allowFallingPatterns and allowContractingPatterns and allowTriangles,
allowRisingTriangleConverging and allowRisingPatterns and allowContractingPatterns and allowTriangles
)
getLastPivotDirectionInt(lastPivotDirection)=>lastPivotDirection == 'up'? 1 : lastPivotDirection == 'down'? -1 : 0
allowedLastPivotDirections = array.from(
0,
lastPivotDirection == 'custom'? getLastPivotDirectionInt(upTrendChannelLastPivotDirection) : getLastPivotDirectionInt(lastPivotDirection),
lastPivotDirection == 'custom'? getLastPivotDirectionInt(downTrendChannelLastPivotDirection) : getLastPivotDirectionInt(lastPivotDirection),
lastPivotDirection == 'custom'? getLastPivotDirectionInt(rangingChannelLastPivotDirection) : getLastPivotDirectionInt(lastPivotDirection),
lastPivotDirection == 'custom'? getLastPivotDirectionInt(risingWedgeExpandingLastPivotDirection) : getLastPivotDirectionInt(lastPivotDirection),
lastPivotDirection == 'custom'? getLastPivotDirectionInt(fallingWedgeExpandingLastPivotDirection) : getLastPivotDirectionInt(lastPivotDirection),
lastPivotDirection == 'custom'? getLastPivotDirectionInt(divergineTriangleLastPivotDirection) : getLastPivotDirectionInt(lastPivotDirection),
lastPivotDirection == 'custom'? getLastPivotDirectionInt(risingTriangleExpandingLastPivotDirection) : getLastPivotDirectionInt(lastPivotDirection),
lastPivotDirection == 'custom'? getLastPivotDirectionInt(fallingTriangleExpandingLastPivotDirection) : getLastPivotDirectionInt(lastPivotDirection),
lastPivotDirection == 'custom'? getLastPivotDirectionInt(risingWedgeContractingLastPivotDirection) : getLastPivotDirectionInt(lastPivotDirection),
lastPivotDirection == 'custom'? getLastPivotDirectionInt(fallingWedgeContractingLastPivotDirection) : getLastPivotDirectionInt(lastPivotDirection),
lastPivotDirection == 'custom'? getLastPivotDirectionInt(convergingTriangleLastPivotDirection) : getLastPivotDirectionInt(lastPivotDirection),
lastPivotDirection == 'custom'? getLastPivotDirectionInt(fallingTriangleContractingLastPivotDirection) : getLastPivotDirectionInt(lastPivotDirection),
lastPivotDirection == 'custom'? getLastPivotDirectionInt(risingTriangleContractingLastPivotDirection) : getLastPivotDirectionInt(lastPivotDirection)
)
theme = input.string('Dark', title='Theme', options= , group='Display', inline='pc',
tooltip='Chart theme settings. Line and label colors are generted based on the theme settings. If dark theme is selected, '+
'lighter colors are used and if light theme is selected, darker colors are used. '+
'Pattern Line width - to be used for drawing pattern lines', display=display.none)
patternLineWidth = input.int(2, '', minval=1, inline='pc', group = 'Display', display = display.none)
showPatternLabel = input.bool(true, 'Pattern Label', inline='pl1', group = 'Display', display = display.none)
patternLabelSize = input.string(size.normal, '', , inline='pl1', group = 'Display', display = display.none,
tooltip = 'Option to display Pattern Label and select the size')
showPivotLabels = input.bool(true, 'Pivot Labels ', inline='pl2', group = 'Display', display = display.none, tooltip = 'Option to display pivot labels and select the size')
pivotLabelSize = input.string(size.normal, '', , inline='pl2', group = 'Display', display = display.none)
showZigzag = input.bool(true, 'Zigzag', inline='z', group = 'Display', display = display.none)
zigzagColor = input.color(color.blue, '', inline='z', group = 'Display', display = display.none, tooltip = 'Option to display zigzag within pattern and the default zigzag line color')
deleteOldPatterns = input.bool(true, 'Max Patterns', inline='do', group = 'Display', display = display.none)
maxPatterns = input.int(20, '', minval=1, step=5, inline = 'do', group = 'Display', display = display.none, tooltip = 'If selected, only last N patterns will be preserved on the chart.')
errorRatio = errorThresold/100
flatRatio = flatThreshold/100
showLabel = true
offset = 0
type Scanner
bool enabled
string ticker
string timeframe
p.ScanProperties sProperties
p.DrawingProperties dProperties
array patterns
array zigzags
method getZigzagAndPattern(Scanner this, int length, int depth, array ohlcArray, int offset=0)=>
var zg.Zigzag zigzag = zg.Zigzag.new(length, depth, 0)
var map lastDBar = map.new()
zigzag.calculate(array.from(highSource, lowSource))
var validPatterns = 0
mlzigzag = zigzag
if(zigzag.flags.newPivot)
while(mlzigzag.zigzagPivots.size() >= 6+offset)
lastBar = mlzigzag.zigzagPivots.first().point.index
lastDir = int(math.sign(mlzigzag.zigzagPivots.first().dir))
if(lastDBar.contains(mlzigzag.level)? lastDBar.get(mlzigzag.level) < lastBar : true)
lastDBar.put(mlzigzag.level, lastBar)
= mlzigzag.find(this.sProperties, this.dProperties, this.patterns, ohlcArray)
if(valid)
validPatterns+=1
currentPattern.draw()
this.patterns.push(currentPattern, maxPatterns)
alert('New Pattern Alert')
else
break
mlzigzag := mlzigzag.nextlevel()
true
method scan(Scanner this)=>
var array ohlcArray = array.new()
var array patterns = array.new()
ohlcArray.push(o.OHLC.new(openSource, highSource, lowSource, closeSource))
if(useZigzag1)
this.getZigzagAndPattern(zigzagLength1, depth1, ohlcArray)
if(useZigzag2)
this.getZigzagAndPattern(zigzagLength2, depth2, ohlcArray)
if(useZigzag3)
this.getZigzagAndPattern(zigzagLength3, depth3, ohlcArray)
if(useZigzag4)
this.getZigzagAndPattern(zigzagLength4, depth4, ohlcArray)
var scanner = Scanner.new(true, "", "",
p.ScanProperties.new(offset, numberOfPivots, errorRatio, flatRatio, checkBarRatio, barRatioLimit, avoidOverlap, allowedPatterns=allowedPatterns, allowedLastPivotDirections= allowedLastPivotDirections, themeColors = ut.getColors(theme)),
p.DrawingProperties.new(patternLineWidth, showZigzag, 1, zigzagColor, showPatternLabel, patternLabelSize, showPivotLabels, pivotLabelSize, deleteOnPop = deleteOldPatterns),
array.new())
if(barstate.isconfirmed or repaint)
scanner.scan()
RCI4linesRCI4lines plots four Rank Correlation Index (RCI) lines in a single panel to help you read momentum and trend conditions at a glance.
It shows two short-term RCIs (default: 7 and 9), a middle-term RCI (26), and a long-term RCI (52).
The script also draws shaded threshold zones between +80 to +95 and -80 to -95, making it easier to spot potential overbought / oversold areas and compare short-term moves with the bigger trend.
Useful for scalping to day trading, and for checking whether short-term momentum is aligned with mid/long-term direction.

SPX Master Levels & Correlations [Gemini] (v4.2)This will draw on your chart levels of SPX from other time frames low , high and ES

CRS (2 symbols: Ratio or Normalized) + InverseMade for Crosrate comparison By Leo Hanhart
This script is made to do a comparison between two assets under your current chart.
For example if you want to compare SPX over Growth ETF's Below a current asset to find momentum in your stock trading above it

Razzere Cloned! EzAlgo V.8.1showBuySell = input(true, "Show Buy & Sell", group="BUY & SELL SIGNALS")
hassasiyet = input.float(3, "Hassasiyet (1-6)", 0.1, 99999, group="BUY & SELL SIGNALS")
percentStop = input.float(1, "Stop Loss % (0 to Disable)", 0, group="BUY & SELL SIGNALS")
offsetSignal = input.float(5, "Signals Offset", 0, group="BUY & SELL SIGNALS")
showRibbon = input(true, "Show Trend Ribbon", group="TREND RIBBON")
smooth1 = input.int(5, "Smoothing 1", 1, group="TREND RIBBON")
smooth2 = input.int(8, "Smoothing 2", 1, group="TREND RIBBON")
showreversal = input(true, "Show Reversals", group="REVERSAL SIGNALS")
showPdHlc = input(false, "Show P.D H/L/C", group="PREVIOUS DAY HIGH LOW CLOSE")
lineColor = input.color(color.yellow, "Line Colors", group="PREVIOUS DAY HIGH LOW CLOSE")
lineWidth = input.int(1, "Width Lines", group="PREVIOUS DAY HIGH LOW CLOSE")
lineStyle = input.string("Solid", "Line Style", )
labelSize = input.string("normal", "Label Text Size", )
labelColor = input.color(color.yellow, "Label Text Colors")
showEmas = input(false, "Show EMAs", group="EMA")
srcEma1 = input(close, "Source EMA 1")
lenEma1 = input.int(7, "Length EMA 1", 1)
srcEma2 = input(close, "Source EMA 2")
lenEma2 = input.int(21, "Length EMA 2", 1)
srcEma3 = input(close, "Source EMA 3")
lenEma3 = input.int(144, "Length EMA 3", 1)
showSwing = input(false, "Show Swing Points", group="SWING POINTS")
prdSwing = input.int(10, "Swing Point Period", 2, group="SWING POINTS")
colorPos = input(color.new(color.green, 50), "Positive Swing Color")
colorNeg = input(color.new(color.red, 50), "Negative Swing Color")
showDashboard = input(true, "Show Dashboard", group="TREND DASHBOARD")
locationDashboard = input.string("Middle Right", "Table Location", , group="TREND DASHBOARD")
tableTextColor = input(color.white, "Table Text Color", group="TREND DASHBOARD")
tableBgColor = input(#2A2A2A, "Table Background Color", group="TREND DASHBOARD")
sizeDashboard = input.string("Normal", "Table Size", , group="TREND DASHBOARD")
showRevBands = input.bool(true, "Show Reversal Bands", group="REVERSAL BANDS")
lenRevBands = input.int(30, "Length", group="REVERSAL BANDS")
// Fonksiyonlar
smoothrng(x, t, m) =>
wper = t * 2 - 1
avrng = ta.ema(math.abs(x - x ), t)
smoothrng = ta.ema(avrng, wper) * m
rngfilt(x, r) =>
rngfilt = x
rngfilt := x > nz(rngfilt ) ? x - r < nz(rngfilt ) ? nz(rngfilt ) : x - r : x + r > nz(rngfilt ) ? nz(rngfilt ) : x + r
percWidth(len, perc) => (ta.highest(len) - ta.lowest(len)) * perc / 100
securityNoRep(sym, res, src) => request.security(sym, res, src, barmerge.gaps_off, barmerge.lookahead_on)
swingPoints(prd) =>
pivHi = ta.pivothigh(prd, prd)
pivLo = ta.pivotlow (prd, prd)
last_pivHi = ta.valuewhen(pivHi, pivHi, 1)
last_pivLo = ta.valuewhen(pivLo, pivLo, 1)
hh = pivHi and pivHi > last_pivHi ? pivHi : na
lh = pivHi and pivHi < last_pivHi ? pivHi : na
hl = pivLo and pivLo > last_pivLo ? pivLo : na
ll = pivLo and pivLo < last_pivLo ? pivLo : na
f_chartTfInMinutes() =>
float _resInMinutes = timeframe.multiplier * (
timeframe.isseconds ? 1 :
timeframe.isminutes ? 1. :
timeframe.isdaily ? 60. * 24 :
timeframe.isweekly ? 60. * 24 * 7 :
timeframe.ismonthly ? 60. * 24 * 30.4375 : na)
f_kc(src, len, hassasiyet) =>
basis = ta.sma(src, len)
span = ta.atr(len)
wavetrend(src, chlLen, avgLen) =>
esa = ta.ema(src, chlLen)
d = ta.ema(math.abs(src - esa), chlLen)
ci = (src - esa) / (0.015 * d)
wt1 = ta.ema(ci, avgLen)
wt2 = ta.sma(wt1, 3)
f_top_fractal(src) => src < src and src < src and src > src and src > src
f_bot_fractal(src) => src > src and src > src and src < src and src < src
f_fractalize (src) => f_top_fractal(src) ? 1 : f_bot_fractal(src) ? -1 : 0
f_findDivs(src, topLimit, botLimit) =>
fractalTop = f_fractalize(src) > 0 and src >= topLimit ? src : na
fractalBot = f_fractalize(src) < 0 and src <= botLimit ? src : na
highPrev = ta.valuewhen(fractalTop, src , 0)
highPrice = ta.valuewhen(fractalTop, high , 0)
lowPrev = ta.valuewhen(fractalBot, src , 0)
lowPrice = ta.valuewhen(fractalBot, low , 0)
bearSignal = fractalTop and high > highPrice and src < highPrev
bullSignal = fractalBot and low < lowPrice and src > lowPrev
// Bileşen...
source = close
smrng1 = smoothrng(source, 27, 1.5)
smrng2 = smoothrng(source, 55, hassasiyet)
smrng = (smrng1 + smrng2) / 2
filt = rngfilt(source, smrng)
up = 0.0, up := filt > filt ? nz(up ) + 1 : filt < filt ? 0 : nz(up )
dn = 0.0, dn := filt < filt ? nz(dn ) + 1 : filt > filt ? 0 : nz(dn )
bullCond = bool(na), bullCond := source > filt and source > source and up > 0 or source > filt and source < source and up > 0
bearCond = bool(na), bearCond := source < filt and source < source and dn > 0 or source < filt and source > source and dn > 0
lastCond = 0, lastCond := bullCond ? 1 : bearCond ? -1 : lastCond
bull = bullCond and lastCond == -1
bear = bearCond and lastCond == 1
countBull = ta.barssince(bull)
countBear = ta.barssince(bear)
trigger = nz(countBull, bar_index) < nz(countBear, bar_index) ? 1 : 0
ribbon1 = ta.sma(close, smooth1)
ribbon2 = ta.sma(close, smooth2)
rsi = ta.rsi(close, 21)
rsiOb = rsi > 70 and rsi > ta.ema(rsi, 10)
rsiOs = rsi < 30 and rsi < ta.ema(rsi, 10)
dHigh = securityNoRep(syminfo.tickerid, "D", high )
dLow = securityNoRep(syminfo.tickerid, "D", low )
dClose = securityNoRep(syminfo.tickerid, "D", close )
ema1 = ta.ema(srcEma1, lenEma1)
ema2 = ta.ema(srcEma2, lenEma2)
ema3 = ta.ema(srcEma3, lenEma3)
= swingPoints(prdSwing)
ema = ta.ema(close, 144)
emaBull = close > ema
equal_tf(res) => str.tonumber(res) == f_chartTfInMinutes() and not timeframe.isseconds
higher_tf(res) => str.tonumber(res) > f_chartTfInMinutes() or timeframe.isseconds
too_small_tf(res) => (timeframe.isweekly and res=="1") or (timeframe.ismonthly and str.tonumber(res) < 10)
securityNoRep1(sym, res, src) =>
bool bull_ = na
bull_ := equal_tf(res) ? src : bull_
bull_ := higher_tf(res) ? request.security(sym, res, src, barmerge.gaps_off, barmerge.lookahead_on) : bull_
bull_array = request.security_lower_tf(syminfo.tickerid, higher_tf(res) ? str.tostring(f_chartTfInMinutes()) + (timeframe.isseconds ? "S" : "") : too_small_tf(res) ? (timeframe.isweekly ? "3" : "10") : res, src)
if array.size(bull_array) > 1 and not equal_tf(res) and not higher_tf(res)
bull_ := array.pop(bull_array)
array.clear(bull_array)
bull_
TF1Bull = securityNoRep1(syminfo.tickerid, "1" , emaBull)
TF3Bull = securityNoRep1(syminfo.tickerid, "3" , emaBull)
TF5Bull = securityNoRep1(syminfo.tickerid, "5" , emaBull)
TF15Bull = securityNoRep1(syminfo.tickerid, "15" , emaBull)
TF30Bull = securityNoRep1(syminfo.tickerid, "30" , emaBull)
TF60Bull = securityNoRep1(syminfo.tickerid, "60" , emaBull)
TF120Bull = securityNoRep1(syminfo.tickerid, "120" , emaBull)
TF240Bull = securityNoRep1(syminfo.tickerid, "240" , emaBull)
TF480Bull = securityNoRep1(syminfo.tickerid, "480" , emaBull)
TFDBull = securityNoRep1(syminfo.tickerid, "1440", emaBull)
= f_kc(close, lenRevBands, 3)
= f_kc(close, lenRevBands, 4)
= f_kc(close, lenRevBands, 5)
= f_kc(close, lenRevBands, 6)
= wavetrend(hlc3, 9, 12)
= f_findDivs(wt2, 15, -40)
= f_findDivs(wt2, 45, -65)
wtDivBull = wtDivBull1 or wtDivBull2
wtDivBear = wtDivBear1 or wtDivBear2
// Renkler
cyan = #00DBFF, cyan30 = color.new(cyan, 70)
pink = #E91E63, pink30 = color.new(pink, 70)
red = #FF5252, red30 = color.new(red , 70)
// Plotlar
off = percWidth(300, offsetSignal)
plotshape(showBuySell and bull ? low - off : na, "Buy Label" , shape.labelup , location.absolute, cyan, 0, "Buy" , color.white, size=size.normal)
plotshape(showBuySell and bear ? high + off : na, "Sell Label", shape.labeldown, location.absolute, pink, 0, "Sell", color.white, size=size.normal)
plotshape(ta.crossover(wt1, wt2) and wt2 <= -53, "Mild Buy" , shape.xcross, location.belowbar, cyan, size=size.tiny)
plotshape(ta.crossunder(wt1, wt2) and wt2 >= 53, "Mild Sell", shape.xcross, location.abovebar, pink, size=size.tiny)
plotshape(wtDivBull, "Divergence Buy ", shape.triangleup , location.belowbar, cyan, size=size.tiny)
plotshape(wtDivBear, "Divergence Sell", shape.triangledown, location.abovebar, pink, size=size.tiny)
barcolor(up > dn ? cyan : pink)
plotshape(showreversal and rsiOs, "Reversal Buy" , shape.diamond, location.belowbar, cyan30, size=size.tiny)
plotshape(showreversal and rsiOb, "Reversal Sell", shape.diamond, location.abovebar, pink30, size=size.tiny)
lStyle = lineStyle == "Solid" ? line.style_solid : lineStyle == "Dotted" ? line.style_dotted : line.style_dashed
lSize = labelSize == "small" ? size.small : labelSize == "normal" ? size.normal : size.large
dHighLine = showPdHlc ? line.new(bar_index, dHigh, bar_index + 1, dHigh , xloc.bar_index, extend.both, lineColor, lStyle, lineWidth) : na, line.delete(dHighLine )
dLowLine = showPdHlc ? line.new(bar_index, dLow , bar_index + 1, dLow , xloc.bar_index, extend.both, lineColor, lStyle, lineWidth) : na, line.delete(dLowLine )
dCloseLine = showPdHlc ? line.new(bar_index, dClose, bar_index + 1, dClose, xloc.bar_index, extend.both, lineColor, lStyle, lineWidth) : na, line.delete(dCloseLine )
dHighLabel = showPdHlc ? label.new(bar_index + 100, dHigh , "P.D.H", xloc.bar_index, yloc.price, #000000, label.style_none, labelColor, lSize) : na, label.delete(dHighLabel )
dLowLabel = showPdHlc ? label.new(bar_index + 100, dLow , "P.D.L", xloc.bar_index, yloc.price, #000000, label.style_none, labelColor, lSize) : na, label.delete(dLowLabel )
dCloseLabel = showPdHlc ? label.new(bar_index + 100, dClose, "P.D.C", xloc.bar_index, yloc.price, #000000, label.style_none, labelColor, lSize) : na, label.delete(dCloseLabel )
plot(showEmas ? ema1 : na, "EMA 1", color.green , 2)
plot(showEmas ? ema2 : na, "EMA 2", color.purple, 2)
plot(showEmas ? ema3 : na, "EMA 3", color.yellow, 2)
plotshape(showSwing ? hh : na, "", shape.triangledown, location.abovebar, color.new(color.green, 50), -prdSwing, "HH", colorPos, false)
plotshape(showSwing ? hl : na, "", shape.triangleup , location.belowbar, color.new(color.green, 50), -prdSwing, "HL", colorPos, false)
plotshape(showSwing ? lh : na, "", shape.triangledown, location.abovebar, color.new(color.red , 50), -prdSwing, "LH", colorNeg, false)
plotshape(showSwing ? ll : na, "", shape.triangleup , location.belowbar, color.new(color.red , 50), -prdSwing, "LL", colorNeg, false)
srcStop = close
atrBand = srcStop * (percentStop / 100)
atrStop = trigger ? srcStop - atrBand : srcStop + atrBand
lastTrade(src) => ta.valuewhen(bull or bear, src, 0)
entry_y = lastTrade(srcStop)
stop_y = lastTrade(atrStop)
tp1_y = (entry_y - lastTrade(atrStop)) * 1 + entry_y
tp2_y = (entry_y - lastTrade(atrStop)) * 2 + entry_y
tp3_y = (entry_y - lastTrade(atrStop)) * 3 + entry_y
labelTpSl(y, txt, color) =>
label labelTpSl = percentStop != 0 ? label.new(bar_index + 1, y, txt, xloc.bar_index, yloc.price, color, label.style_label_left, color.white, size.normal) : na
label.delete(labelTpSl )
labelTpSl(entry_y, "Entry: " + str.tostring(math.round_to_mintick(entry_y)), color.gray)
labelTpSl(stop_y , "Stop Loss: " + str.tostring(math.round_to_mintick(stop_y)), color.red)
labelTpSl(tp1_y, "Take Profit 1: " + str.tostring(math.round_to_mintick(tp1_y)), color.green)
labelTpSl(tp2_y, "Take Profit 2: " + str.tostring(math.round_to_mintick(tp2_y)), color.green)
labelTpSl(tp3_y, "Take Profit 3: " + str.tostring(math.round_to_mintick(tp3_y)), color.green)
lineTpSl(y, color) =>
line lineTpSl = percentStop != 0 ? line.new(bar_index - (trigger ? countBull : countBear) + 4, y, bar_index + 1, y, xloc.bar_index, extend.none, color, line.style_solid) : na
line.delete(lineTpSl )
lineTpSl(entry_y, color.gray)
lineTpSl(stop_y, color.red)
lineTpSl(tp1_y, color.green)
lineTpSl(tp2_y, color.green)
lineTpSl(tp3_y, color.green)
var dashboard_loc = locationDashboard == "Top Right" ? position.top_right : locationDashboard == "Middle Right" ? position.middle_right : locationDashboard == "Bottom Right" ? position.bottom_right : locationDashboard == "Top Center" ? position.top_center : locationDashboard == "Middle Center" ? position.middle_center : locationDashboard == "Bottom Center" ? position.bottom_center : locationDashboard == "Top Left" ? position.top_left : locationDashboard == "Middle Left" ? position.middle_left : position.bottom_left
var dashboard_size = sizeDashboard == "Large" ? size.large : sizeDashboard == "Normal" ? size.normal : sizeDashboard == "Small" ? size.small : size.tiny
var dashboard = showDashboard ? table.new(dashboard_loc, 2, 15, tableBgColor, #000000, 2, tableBgColor, 1) : na
dashboard_cell(column, row, txt, signal=false) => table.cell(dashboard, column, row, txt, 0, 0, signal ? #000000 : tableTextColor, text_size=dashboard_size)
dashboard_cell_bg(column, row, col) => table.cell_set_bgcolor(dashboard, column, row, col)
if barstate.islast and showDashboard
dashboard_cell(0, 0 , "EzAlgo")
dashboard_cell(0, 1 , "Current Position")
dashboard_cell(0, 2 , "Current Trend")
dashboard_cell(0, 3 , "Volume")
dashboard_cell(0, 4 , "Timeframe")
dashboard_cell(0, 5 , "1 min:")
dashboard_cell(0, 6 , "3 min:")
dashboard_cell(0, 7 , "5 min:")
dashboard_cell(0, 8 , "15 min:")
dashboard_cell(0, 9 , "30 min:")
dashboard_cell(0, 10, "1 H:")
dashboard_cell(0, 11, "2 H:")
dashboard_cell(0, 12, "4 H:")
dashboard_cell(0, 13, "8 H:")
dashboard_cell(0, 14, "Daily:")
dashboard_cell(1, 0 , "V.8.1")
dashboard_cell(1, 1 , trigger ? "Buy" : "Sell", true), dashboard_cell_bg(1, 1, trigger ? color.green : color.red)
dashboard_cell(1, 2 , emaBull ? "Bullish" : "Bearish", true), dashboard_cell_bg(1, 2, emaBull ? color.green : color.red)
dashboard_cell(1, 3 , str.tostring(volume))
dashboard_cell(1, 4 , "Trends")
dashboard_cell(1, 5 , TF1Bull ? "Bullish" : "Bearish", true), dashboard_cell_bg(1, 5 , TF1Bull ? color.green : color.red)
dashboard_cell(1, 6 , TF3Bull ? "Bullish" : "Bearish", true), dashboard_cell_bg(1, 6 , TF3Bull ? color.green : color.red)
dashboard_cell(1, 7 , TF5Bull ? "Bullish" : "Bearish", true), dashboard_cell_bg(1, 7 , TF5Bull ? color.green : color.red)
dashboard_cell(1, 8 , TF15Bull ? "Bullish" : "Bearish", true), dashboard_cell_bg(1, 8 , TF15Bull ? color.green : color.red)
dashboard_cell(1, 9 , TF30Bull ? "Bullish" : "Bearish", true), dashboard_cell_bg(1, 9 , TF30Bull ? color.green : color.red)
dashboard_cell(1, 10, TF60Bull ? "Bullish" : "Bearish", true), dashboard_cell_bg(1, 10, TF60Bull ? color.green : color.red)
dashboard_cell(1, 11, TF120Bull ? "Bullish" : "Bearish", true), dashboard_cell_bg(1, 11, TF120Bull ? color.green : color.red)
dashboard_cell(1, 12, TF240Bull ? "Bullish" : "Bearish", true), dashboard_cell_bg(1, 12, TF240Bull ? color.green : color.red)
dashboard_cell(1, 13, TF480Bull ? "Bullish" : "Bearish", true), dashboard_cell_bg(1, 13, TF480Bull ? color.green : color.red)
dashboard_cell(1, 14, TFDBull ? "Bullish" : "Bearish", true), dashboard_cell_bg(1, 14, TFDBull ? color.green : color.red)
plot(showRevBands ? upperKC1 : na, "Rev.Zone Upper 1", red30)
plot(showRevBands ? upperKC2 : na, "Rev.Zone Upper 2", red30)
plot(showRevBands ? upperKC3 : na, "Rev.Zone Upper 3", red30)
plot(showRevBands ? upperKC4 : na, "Rev.Zone Upper 4", red30)
plot(showRevBands ? lowerKC4 : na, "Rev.Zone Lower 4", cyan30)
plot(showRevBands ? lowerKC3 : na, "Rev.Zone Lower 3", cyan30)
plot(showRevBands ? lowerKC2 : na, "Rev.Zone Lower 2", cyan30)
plot(showRevBands ? lowerKC1 : na, "Rev.Zone Lower 1", cyan30)
fill(plot(showRibbon ? ribbon1 : na, "", na, editable=false), plot(showRibbon ? ribbon2 : na, "", na, editable=false), ribbon1 > ribbon2 ? cyan30 : pink30, "Ribbon Fill Color")
// Alarmlar
alert01 = ta.crossover(ribbon1, ribbon2)
alert02 = bull
alert03 = wtDivBull
alert04 = wtDivBear
alert05 = bull or bear
alert06 = ta.crossover(wt1, wt2) and wt2 <= -53
alert07 = ta.crossunder(wt1, wt2) and wt2 >= 53
alert08 = ta.crossunder(ribbon1, ribbon2)
alert09 = rsiOb or rsiOs
alert10 = bear
alert11 = ta.cross(ribbon1, ribbon2)
alerts(sym) =>
if alert02 or alert03 or alert04 or alert06 or alert07 or alert10
alert_text = alert02 ? "Buy Signal EzAlgo" : alert03 ? "Strong Buy Signal EzAlgo" : alert04 ? "Strong Sell Signal EzAlgo" : alert06 ? "Mild Buy Signal EzAlgo" : alert07 ? "Mild Sell Signal EzAlgo" : "Sell Signal EzAlgo"
alert(alert_text, alert.freq_once_per_bar_close)
alerts(syminfo.tickerid)
alertcondition(alert01, "Blue Trend Ribbon Alert", "Blue Trend Ribbon, TimeFrame={{interval}}")
alertcondition(alert02, "Buy Signal", "Buy Signal EzAlgo")
alertcondition(alert03, "Divergence Buy Alert", "Strong Buy Signal EzAlgo, TimeFrame={{interval}}")
alertcondition(alert04, "Divergence Sell Alert", "Strong Sell Signal EzAlgo, TimeFrame={{interval}}")
alertcondition(alert05, "Either Buy or Sell Signal", "EzAlgo Signal")
alertcondition(alert06, "Mild Buy Alert", "Mild Buy Signal EzAlgo, TimeFrame={{interval}}")
alertcondition(alert07, "Mild Sell Alert", "Mild Sell Signal EzAlgo, TimeFrame={{interval}}")
alertcondition(alert08, "Red Trend Ribbon Alert", "Red Trend Ribbon, TimeFrame={{interval}}")
alertcondition(alert09, "Reversal Signal", "Reversal Signal")
alertcondition(alert10, "Sell Signal", "Sell Signal EzAlgo")
alertcondition(alert11, "Trend Ribbon Color Change Alert", "Trend Ribbon Color Change, TimeFrame={{interval}}")

Density Zones (GM Crossing Clusters) + QHO Spin FlipsINDICATOR NAME
Density Zones (GM Crossing Clusters) + QHO Spin Flips
OVERVIEW
This indicator combines two complementary ideas into a single overlay: *this combines my earlier Geometric Mean Indicator with the Quantum Harmonic Oscillator (Overlay) with additional enhancements*
1) Density Zones (GM Crossing Clusters)
A “Density Zone” is detected when price repeatedly crosses a Geometric Mean equilibrium line (GM) within a rolling lookback window. Conceptually, this identifies regions where the market is repeatedly “snapping” across an equilibrium boundary—high churn, high decision pressure, and repeated re-selection of direction.
2) QHO Spin Flips (Regression-Residual σ Breaches)
A “Spin Flip” is detected when price deviates beyond a configurable σ-threshold (κ) from a regression-based equilibrium, using normalized residuals. Conceptually, this marks excursions into extreme states (decoherence / expansion), which often precede a reversion toward equilibrium and/or a regime re-scaling.
These two systems are related but not identical:
- Density Zones identify where equilibrium crossings cluster (a “singularity”/anchor behavior around GM).
- Spin Flips identify when price exceeds statistically extreme displacement from the regression equilibrium (LSR), indicating expansion beyond typical variance.
CORE CONCEPTS AND FORMULAS
SECTION A — GEOMETRIC MEAN EQUILIBRIUM (GM)
We define two moving averages:
(1) MA1_t = SMA(close_t, L1)
(2) MA2_t = SMA(close_t, L2)
We define the equilibrium anchor as the geometric mean of MA1 and MA2:
(3) GM_t = sqrt( MA1_t * MA2_t )
This GM line acts as an equilibrium boundary. Repeated crossings are interpreted as high “equilibrium churn.”
SECTION B — CROSS EVENTS (UP/DOWN)
A “cross event” is registered when the sign of (close - GM) changes:
Define a sign function s_t:
(4) s_t =
+1 if close_t > GM_t
-1 if close_t < GM_t
s_{t-1} if close_t == GM_t (tie-breaker to avoid false flips)
Then define the crossing event indicator:
(5) crossEvent_t = 1 if s_t != s_{t-1}
0 otherwise
Additionally, the indicator plots explicit cross markers:
- Cross Above GM: crossover(close, GM)
- Cross Below GM: crossunder(close, GM)
These provide directional visual cues and match the original Geometric Mean Indicator behavior.
SECTION C — DENSITY MEASURE (CROSSING CLUSTER COUNT)
A Density Zone is based on the number of cross events occurring in the last W bars:
(6) D_t = Σ_{i=0..W-1} crossEvent_{t-i}
This is a “crossing density” score: how many times price has toggled across GM recently.
The script implements this efficiently using a cumulative sum identity:
Let x_t = crossEvent_t.
(7) cumX_t = Σ_{j=0..t} x_j
Then:
(8) D_t = cumX_t - cumX_{t-W} (for t >= W)
cumX_t (for t < W)
SECTION D — DENSITY ZONE TRIGGER
We define a Density Zone state:
(9) isDZ_t = ( D_t >= θ )
where:
- θ (theta) is the user-selected crossing threshold.
Zone edges:
(10) dzStart_t = isDZ_t AND NOT isDZ_{t-1}
(11) dzEnd_t = NOT isDZ_t AND isDZ_{t-1}
SECTION E — DENSITY ZONE BOUNDS
While inside a Density Zone, we track the running high/low to display zone bounds:
(12) dzHi_t = max(dzHi_{t-1}, high_t) if isDZ_t
(13) dzLo_t = min(dzLo_{t-1}, low_t) if isDZ_t
On dzStart:
(14) dzHi_t := high_t
(15) dzLo_t := low_t
Outside zones, bounds are reset to NA.
These bounds visually bracket the “singularity span” (the churn envelope) during each density episode.
SECTION F — QHO EQUILIBRIUM (REGRESSION CENTERLINE)
Define the regression equilibrium (LSR):
(16) m_t = linreg(close_t, L, 0)
This is the “centerline” the QHO system uses as equilibrium.
SECTION G — RESIDUAL AND σ (FIELD WIDTH)
Residual:
(17) r_t = close_t - m_t
Rolling standard deviation of residuals:
(18) σ_t = stdev(r_t, L)
This σ_t is the local volatility/width of the residual field around the regression equilibrium.
SECTION H — NORMALIZED DISPLACEMENT AND SPIN FLIP
Define the standardized displacement:
(19) Y_t = (close_t - m_t) / σ_t
(If σ_t = 0, the script safely treats Y_t = 0.)
Spin Flip trigger uses a user threshold κ:
(20) spinFlip_t = ( |Y_t| > κ )
Directional spin flips:
(21) spinUp_t = ( Y_t > +κ )
(22) spinDn_t = ( Y_t < -κ )
The default κ=3.0 corresponds to “3σ excursions,” which are statistically extreme under a normal residual assumption (even though real markets are not perfectly normal).
SECTION I — QHO BANDS (OPTIONAL VISUALIZATION)
The indicator optionally draws the standard σ-bands around the regression equilibrium:
(23) 1σ bands: m_t ± 1·σ_t
(24) 2σ bands: m_t ± 2·σ_t
(25) 3σ bands: m_t ± 3·σ_t
These provide immediate context for the Spin Flip events.
WHAT YOU SEE ON THE CHART
1) MA1 / MA2 / GM lines (optional)
- MA1 (blue), MA2 (red), GM (green).
- GM is the equilibrium anchor for Density Zones and cross markers.
2) GM Cross Markers (optional)
- “GM↑” label markers appear on bars where close crosses above GM.
- “GM↓” label markers appear on bars where close crosses below GM.
3) Density Zone Shading (optional)
- Background shading appears while isDZ_t = true.
- This is the period where the crossing density D_t is above θ.
4) Density Zone High/Low Bounds (optional)
- Two lines (dzHi / dzLo) are drawn only while in-zone.
- These bounds bracket the full churn envelope during the density episode.
5) QHO Bands (optional)
- 1σ, 2σ, 3σ shaded zones around regression equilibrium.
- These visualize the current variance field.
6) Regression Equilibrium (LSR Centerline)
- The white centerline is the regression equilibrium m_t.
7) Spin Flip Markers
- A circle is plotted when |Y_t| > κ (beyond your chosen σ-threshold).
- Marker size is user-controlled (tiny → huge).
HOW TO USE IT
Step 1 — Pick the equilibrium anchor (GM)
- L1 and L2 define MA1 and MA2.
- GM = sqrt(MA1 * MA2) becomes your equilibrium boundary.
Typical choices:
- Faster equilibrium: L1=20, L2=50 (default-like).
- Slower equilibrium: L1=50, L2=200 (macro anchor).
Interpretation:
- GM acts like a “center of mass” between two moving averages.
- Crosses show when price flips from one side of equilibrium to the other.
Step 2 — Tune Density Zones (W and θ)
- W controls the time window measured (how far back you count crossings).
- θ controls how many crossings qualify as a “density/singularity episode.”
Guideline:
- Larger W = slower, broader density detection.
- Higher θ = only the most intense churn is labeled as a Density Zone.
Interpretation:
- A Density Zone is not “bullish” or “bearish” by itself.
- It is a condition: repeated equilibrium toggling (high churn / high compression).
- These often precede expansions, but direction is not implied by the zone alone.
Step 3 — Tune the QHO spin flip sensitivity (L and κ)
- L controls regression memory and σ estimation length.
- κ controls how extreme the displacement must be to trigger a spin flip.
Guideline:
- Smaller L = more reactive centerline and σ.
- Larger L = smoother, slower “field” definition.
- κ=3.0 = strong extreme filter.
- κ=2.0 = more frequent flips.
Interpretation:
- Spin flips mark when price exits the “normal” residual field.
- In your model language: a moment of decoherence/expansion that is statistically extreme relative to recent equilibrium.
Step 4 — Read the combined behavior (your key thesis)
A) Density Zone forms (GM churn clusters):
- Market repeatedly crosses equilibrium (GM), compressing into a bounded churn envelope.
- dzHi/dzLo show the envelope range.
B) Expansion occurs:
- Price can release away from the density envelope (up or down).
- If it expands far enough relative to regression equilibrium, a Spin Flip triggers (|Y| > κ).
C) Re-coherence:
- After a spin flip, price often returns toward equilibrium structures:
- toward the regression centerline m_t
- and/or back toward the density envelope (dzHi/dzLo) depending on regime behavior.
- The indicator does not guarantee return, but it highlights the condition where return-to-field is statistically likely in many regimes.
IMPORTANT NOTES / DISCLAIMERS
- This indicator is an analytical overlay. It does not provide financial advice.
- Density Zones are condition states derived from GM crossing frequency; they do not predict direction.
- Spin Flips are statistical excursions based on regression residuals and rolling σ; markets have fat tails and non-stationarity, so σ-based thresholds are contextual, not absolute.
- All parameters (L1, L2, W, θ, L, κ) should be tuned per asset, timeframe, and volatility regime.
PARAMETER SUMMARY
Geometric Mean / Density Zones:
- L1: MA1 length
- L2: MA2 length
- GM_t = sqrt(SMA(L1)*SMA(L2))
- W: crossing-count lookback window
- θ: crossing density threshold
- D_t = Σ crossEvent_{t-i} over W
- isDZ_t = (D_t >= θ)
- dzHi/dzLo track envelope bounds while isDZ is true
QHO / Spin Flips:
- L: regression + residual σ length
- m_t = linreg(close, L, 0)
- r_t = close_t - m_t
- σ_t = stdev(r_t, L)
- Y_t = r_t / σ_t
- spinFlip_t = (|Y_t| > κ)
Visual Controls:
- toggles for GM lines, cross markers, zone shading, bounds, QHO bands
- marker size options for GM crosses and spin flips
ALERTS INCLUDED
- Density Zone START / END
- Spin Flip UP / DOWN
- Cross Above GM / Cross Below GM
SUMMARY
This indicator treats the Geometric Mean as an equilibrium boundary and identifies “Density Zones” when price repeatedly crosses that equilibrium within a rolling window, forming a bounded churn envelope (dzHi/dzLo). It also models a regression-based equilibrium field and triggers “Spin Flips” when price makes statistically extreme σ-excursions from that field. Used together, Density Zones highlight compression/decision regions (equilibrium churn), while Spin Flips highlight extreme expansion states (σ-breaches), allowing the user to visualize how price compresses around equilibrium, releases outward, and often re-stabilizes around equilibrium structures over time.