BTC Risk Metric DCA Adapter (3Commas Webhook Strategy)Risk Metric DCA Adapter (3Commas Webhook Strategy) - WORK IN PROGRESS
This Pine Script strategy, originally inspired by the Risk Metric Indicator, is fundamentally engineered as an Adapter to interface with external trading bots like 3Commas via Webhooks. It calculates a dynamic market risk score and translates that score into specific dollar-cost averaging (DCA) entry levels and tiered profit-taking exits.
Key Features & Logic
Risk Metric Calculation (Credit to The Trading Parrot):
The strategy incorporates a complex, multi-timeframe Risk Metric calculation based on daily and weekly moving averages (SMA) and standard deviation (StDev). This metric aims to quantify the current market overextension or compression relative to long-term historical data. The resulting score dictates the level of conviction for a new trade.
Tiered DCA Entry Sizing:
The strategy defines three distinct Buy Levels (L1, L2, L3) corresponding to increasingly favorable (lower) Risk Metric scores.
L1 (Base): Risk is moderate, initiating the minimum defined trade amount.
L2 (Scaled): Risk is low, initiating L1 amount + L2 amount.
L3 (Aggressive): Risk is very low, initiating L1 + L2 + L3 amounts.
Tiered Profit-Taking Exits:
The strategy implements a staggered, partial profit-taking approach based on the Risk Metric rising:
Sell L1 & L2: Closes a percentage of the current position when the Risk Metric reaches defined high thresholds, locking in partial profits.
Sell L3 (Full Exit): Closes the remaining position when the Risk Metric reaches the highest defined threshold.
The Adapter Function (Webhook Integration)
This script is unique because it uses the Pine Script strategy() function to trigger Order Fills, which are necessary to access powerful placeholders in the TradingView alert system.
Trigger Type: The alert must be set to trigger on Any order fill.
Dynamic Webhook Data: Instead of using fixed alert() commands, the strategy generates dynamic labels (e.g., BUY_ENTRY_L3_USD_1000 or SELL_L1_PCT_25) using the strategy.entry and strategy.close commands.
Data Transfer: The alert message then uses the placeholder {{strategy.order.comment}} to pass these dynamic labels to the 3Commas bot, allowing the bot to execute the precise action (e.g., start_deal_with_volume_in_quote_currency or close_deal_at_market_percentage).
Full Strategy Webhook payload
{
"secret": "YOUR_3COMMAS_SECRET_KEY",
"max_lag": "300",
"timestamp": "{{timenow}}",
"trigger_price": "{{close}}",
"tv_exchange": "{{exchange}}",
"tv_instrument": "{{ticker}}",
"action": "{{strategy.order.action}}",
"bot_uuid": "YOUR_BOT_UUID",
"strategy_info": {
"market_position": "{{strategy.market_position}}",
"market_position_size": "{{strategy.market_position_size}}",
"prev_market_position": "{{strategy.prev_market_position}}",
"prev_market_position_size": "{{strategy.prev_market_position_size}}"
},
"order": {
"amount": "{{strategy.order.contracts}}",
"currency_type": "base",
"comment": "{{strategy.order.comment}}"
}
}
Disclaimer: This script is an adapter tool and does not guarantee profit. Trading requires manual configuration of risk settings, bot parameters, and adherence to platform-specific setup instructions.
Overbought

Tristan's Tri-band StrategyTristan's Tri-band Strategy - Confluence Trading System
Strategy Overview:
This strategy combines three powerful technical indicators - RSI, Williams %R, and Bollinger Bands - into a single visual trading system. Instead of cluttering your chart with separate indicator panels, all signals are displayed directly on the price chart using color-coded gradient overlays, making it easy to spot high-probability trade setups at a glance.
How It Works:
The strategy identifies trading opportunities when multiple indicators align (confluence), suggesting strong momentum shifts:
📈 Long Entry Signals:
RSI drops to 30 or below (oversold)
Williams %R reaches -80 to -100 range (oversold)
Price touches or breaks below the lower Bollinger Band
All three conditions must align during your selected trading session
📉 Short Entry Signals:
RSI rises to 70 or above (overbought)
Williams %R reaches 0 to -20 range (overbought)
Price touches or breaks above the upper Bollinger Band
All three conditions must align during your selected trading session
Visual Indicators:
(faint) Green gradients below candles = Bullish oversold conditions (buying opportunity)
(faint) Red/Orange gradients above candles = Bearish overbought conditions (selling opportunity)
Stacked/brighter gradients = Multiple indicators confirming the same signal (higher probability) will stack and show brighter / less faint
Blue Bollinger Bands = Volatility boundaries and mean reversion zones
Exit Strategy:
Long trades exit when price reaches the upper Bollinger Band OR RSI becomes overbought (≥70)
Short trades exit when price reaches the lower Bollinger Band OR RSI becomes oversold (≤30)
Key Features:
✅ Session Filters - Trade only during NY (9:30 AM-4 PM), London (3 AM-11:30 AM), or Asia (7 PM-1 AM EST) sessions
✅ No Repainting - Signals are confirmed on candle close for realistic backtesting and live trading
✅ Customizable Parameters - Adjust RSI levels, BB standard deviations, Williams %R periods, and gradient visibility
✅ Visual Clarity - See all three indicators at once without switching between panels
✅ Built-in Alerts - Get notified when entry and exit conditions are met
How to Use Effectively:
Choose Your Trading Session - For day trading US stocks, enable only the NY session. For forex or 24-hour markets, select the sessions that match your schedule.
Look for Gradient Stacking - The brightest, most visible gradients occur when both RSI and Williams %R signal together. These are your highest-probability setups.
Confirm with Price Action - Wait for the candle to close before entering. The strategy enters on the next bar's open to prevent repainting.
Respect the Bollinger Bands - Entries occur at the outer bands (price extremes), and exits occur at the opposite band or when momentum reverses.
Backtest First - Test the strategy on your preferred instruments and timeframes. Works best on liquid assets with clear trends and mean reversion patterns (stocks, major forex pairs, indices).
Adjust Gradient Visibility - Use the "Gradient Strength" slider (lower = more visible) to make signals stand out on your chart style.
Best Timeframes: 5-minute to 1-hour charts for intraday trading; 4-hour to daily for swing trading (I have also found the 3 hour timeframe to work really well for some stocks / ETFs.)
Best Markets: Liquid instruments with volatility - SPY, QQQ, major stocks, EUR/USD, GBP/USD, major indices
Risk Management: This is a mean reversion strategy that works best in ranging or choppy markets. In strong trends, signals may appear less frequently. Always use proper position sizing and stop losses based on your risk tolerance.
----------------------------------------------
Note: Past performance does not guarantee future results. This strategy is provided for educational purposes. Always backtest thoroughly and practice proper risk management before live trading.RetryClaude can make mistakes. Please double-check responses. Sonnet 4.5

[SHORT ONLY] ATR Sell the Rip Mean Reversion Strategy█ STRATEGY DESCRIPTION
The "ATR Sell the Rip Mean Reversion Strategy" is a contrarian system that targets overextended price moves on stocks and ETFs. It calculates an ATR‐based trigger level to identify shorting opportunities. When the current close exceeds this smoothed ATR trigger, and if the close is below a 200-period EMA (if enabled), the strategy initiates a short entry, aiming to profit from an anticipated corrective pullback.
█ HOW IS THE ATR SIGNAL BAND CALCULATED?
This strategy computes an ATR-based signal trigger as follows:
Calculate the ATR
The strategy computes the Average True Range (ATR) using a configurable period provided by the user:
atrValue = ta.atr(atrPeriod)
Determine the Threshold
Multiply the ATR by a predefined multiplier and add it to the current close:
atrThreshold = close + atrValue * atrMultInput
Smooth the Threshold
Apply a Simple Moving Average over a specified period to smooth out the threshold, reducing noise:
signalTrigger = ta.sma(atrThreshold, smoothPeriodInput)
█ SIGNAL GENERATION
1. SHORT ENTRY
A Short Signal is triggered when:
The current close is above the smoothed ATR signal trigger.
The trade occurs within the specified trading window (between Start Time and End Time).
If the EMA filter is enabled, the close must also be below the 200-period EMA.
2. EXIT CONDITION
An exit Signal is generated when the current close falls below the previous bar’s low (close < low ), indicating a potential bearish reversal and prompting the strategy to close its short position.
█ ADDITIONAL SETTINGS
ATR Period: The period used to calculate the ATR, allowing for adaptability to different volatility conditions (default is 20).
ATR Multiplier: The multiplier applied to the ATR to determine the raw threshold (default is 1.0).
Smoothing Period: The period over which the raw ATR threshold is smoothed using an SMA (default is 10).
Start Time and End Time: Defines the time window during which trades are allowed.
EMA Filter (Optional): When enabled, short entries are only executed if the current close is below the 200-period EMA, confirming a bearish trend.
█ PERFORMANCE OVERVIEW
This strategy is designed for use on the Daily timeframe, targeting stocks and ETFs by capitalizing on overextended price moves.
It utilizes a dynamic, ATR-based trigger to identify when prices have potentially peaked, setting the stage for a mean reversion short entry.
The optional EMA filter helps align trades with broader market trends, potentially reducing false signals.
Backtesting is recommended to fine-tune the ATR multiplier, smoothing period, and EMA settings to match the volatility and behavior of specific markets.

Chande Momentum Oscillator (CMO) Buy Sell Strategy [TradeDots]The "Chande Momentum Oscillator (CMO) Buy Sell Strategy" leverages the CMO indicator to identify short-term buy and sell opportunities.
HOW DOES IT WORK
The standard CMO indicator measures the difference between recent gains and losses, divided by the total price movement over the same period. However, this version of the CMO has some limitations.
The primary disadvantage of the original CMO is its responsiveness to short-term volatility, making the signals less smooth and more erratic, especially in fluctuating markets. This instability can lead to misleading buy or sell signals.
To address this, we integrated the concept from the Moving Average Convergence Divergence (MACD) indicator. By applying a 9-period exponential moving average (EMA) to the CMO line, we obtained a smoothed signal line. This line acts as a filter, identifying confirmed overbought or oversold states, thereby reducing the number of false signals.
Similar to the MACD histogram, we generate columns representing the difference between the CMO and its signal line, reflecting market momentum. We use this momentum indicator as a criterion for entry and exit points. Trades are executed when there's a convergence of CMO and signal lines during an oversold state, and they are closed when the CMO line diverges from the signal line, indicating increased selling pressure.
APPLICATION
Since the 9-period EMA smooths the CMO line, it's less susceptible to extreme price fluctuations. However, this smoothing also makes it more challenging to breach the original +50 and -50 benchmarks.
To increase trading opportunities, we've tightened the boundary ranges. Users can customize the target benchmark lines in the settings to adjust for the volatility of the underlying asset.
The 'cool down period' is essentially the number of bars that await before the next signal generation. This feature is employed to dodge the occurrence of multiple signals in a short period.
DEFAULT SETUP
Commission: 0.01%
Initial Capital: $10,000
Equity per Trade: 80%
Signal Cool Down Period: 5
RISK DISCLAIMER
Trading entails substantial risk, and most day traders incur losses. All content, tools, scripts, articles, and education provided by TradeDots serve purely informational and educational purposes. Past performances are not definitive predictors of future results.

VWAP Breakout Strategy (Momentum, Vol, VWAP, RSI, TrSL)General Description and Unique Features of this Script
Introducing the VWAP Breakout Trading Algorithm for TradingView – the timeless strategy designed to identify the highest probability entries and trades for all financial securities and timeframes.
Unlike other strategies, the VWAP Breakout Strategy considers the buying/selling pressure in the market and supply/demand balance to generate real-time trading signals. The Relative Strength Index (RSI) is used as a technical measure to capture typical breakouts from consolidation periods and pullback entries.
With flexible backtesting options, traders can improve parameter settings depending on their time horizon and the type of financial securities being used. Plus, this pro-version of the VWAP Breakout Strategy offers stop-loss, take-profit, and trailing stop-loss exit strategies for better risk management.
The VWAP Breakout Strategy combines a number of technical indicators, the Moving Average (MA), the Volume Weighted Average Price (VWAP) and the RSI-qualifier to identify potential trend reversals and entry/exit points in the market. The VWAP Breakout Strategy can be used in conjunction with other technical indicators and fundamental analysis to make more informed trading decisions.
To further optimize trading results, this strategy generates trading signals based on real-time price action, rather than relying on the close / open of candles.
The VWAP Breakout Strategy
One important qualifier for generating buy signals is that the stock or other financial security is not in a short-term overbought status (for long-positions), or in a short-term oversold status (for short-positions), respectively.
Additionally, the stock or other financial security needs to go through a consolidation period before buy signals are being generated.
The RSI-indicator is being used as a technical measure in this strategy for that.
• Using moderate parameters for the RSI-qualifier (oversold-level 40 or higher, overbought level 60 or lower) will capture more typical breakouts from consolidation periods.
• Using more extreme parameters for the RSI-qualifier (oversold-level 35 or lower, overbought level 65 or higher) will capture the so-called pullback entries.
Long Entries
When the selling pressure is over and the continuation of the uptrend can be confirmed by the MA / VWAP crossover after reaching a price low, a buy signal is issued by this strategy.
Short Entries
When the byuing pressure is over and the continuation of the downtrend can be confirmed by the MA / VWAP crossover after reaching a price high, a sell signal is issued by this strategy.
Timeless Strategy
The underlying principles of this strategy are based on the buying- / selling pressure in the market as well as the supply and demand balance. The buying / selling volumes are being considered for the generation of trading signals. These sophisticated market principles make this strategy timeless which means it can be applied to 1min-charts, weekly charts as well as anything between those.
Generation of Trading Signals
Real-time process are considered for this pro-version of the VWAP Breakout Strategy. This is another benefit versus many other strategies which only consider the close or open of the canldes for trading signals:
Exit Strategies
This pro-version offers the following exit strategies:
• Stop-Loss
• Take-Profit
• Trailing Stop-Loss
The trailing SL functionality provides another benefit versus most other trading strategies resulting in significantly backtesting- and real-time trading results.
Trades will also be closed when an opposite trading signal is being generated (only applicable for combined long/short strategies).
Flexible Backtesting Option
The strategy offers fully flexible backtesting options to improve the parameter setting strategy, depending on time horizon and type of financial securities being used.
Relative Strength Index (RSI)
The Relative Strength Index (RSI) is a technical indicator developed by Welles Wilder in 1978. The RSI is used to perform a market value analysis and identify the strength of a trend as well as overbought and oversold conditions. The indicator is calculated on a scale from 0 to 100 and shows how much an asset has risen or fallen relative to its own price in recent periods.
The RSI is calculated as the ratio of average profits to average losses over a certain period of time. A high value of the RSI indicates an overbought situation, while a low value indicates an oversold situation. Typically, a value > 70 is considered an overbought threshold and a value < 30 is considered an oversold threshold. A value above 70 signals that a single value may be overvalued and a decrease in price is likely , while a value below 30 signals that a single value may be undervalued and an increase in price is likely.
For example, let's say you're watching a stock XYZ. After a prolonged falling movement, the RSI value of this stock has fallen to 26. This means that the stock is oversold and that it is time for a potential recovery. Therefore, a trader might decide to buy this stock in the hope that it will rise again soon.
The MA / VWAP Crossover Trading Strategy
This strategy combines two popular technical indicators: the Moving Average (MA) and the Volume Weighted Average Price (VWAP). The MA VWAP crossover strategy is used to identify potential trend reversals and entry/exit points in the market.
The VWAP is calculated by taking the average price of an asset for a given period, weighted by the volume traded at each price level. The MA, on the other hand, is calculated by taking the average price of an asset over a specified number of periods. When the MA crosses above the VWAP, it suggests that buying pressure is increasing, and it may be a good time to enter a long position. When the MA crosses below the VWAP, it suggests that selling pressure is increasing, and it may be a good time to exit a long position or enter a short position.
Traders typically use the MA VWAP crossover strategy in conjunction with other technical indicators and fundamental analysis to make more informed trading decisions. As with any trading strategy, it is important to carefully consider the risks and potential rewards before making any trades.
This strategy is applicable to all timeframes and the relevant parameters for the underlying indicators (RSI and MA/VWAP) can be adjusted and optimized as needed.
Backtesting Results
Backtesting gives outstanding results on all timeframes and drawdowns can be reduced to a minimum level. In this example, the hourly chart for MCFT has been used.
Settings for backtesting are:
- Period from April 2020 until April 2021 (1 yr)
- Starting capital 100k USD
- Position size = 25% of equity
- 0.01% commission = USD 2.50.- per Trade
- Slippage = 2 ticks
Other comments
• This strategy has been designed to identify the most promising, highest probability entries and trades for each stock or other financial security.
• The RSI qualifier is highly selective and filters out the most promising swing-trading entries. As a result, you will normally only find a low number of trades for each stock or other financial security per year in case you apply this strategy for the daily charts. Shorter timeframes will result in a higher number of trades / year.
• As a result, traders need to apply this strategy for a full watchlist rather than just one financial security.

Exponential Stochastic Strategywhat is Exponential Stochastic?
it is a modified version of the stochastic indicator. This strategy does not include pyramiding, repaint, trailing stop or take profit.
what it does?
It contains an extra input in addition to the stochastic indicator. Thanks to this input, different exponential weights can be given to the outputs and the indicator can be made more sensitive or insensitive. The strategy buys when the indicator leaves the overbought zone, sells when it leaves the oversold zone and always stays in the trade.
how it does it?
it uses this formula: i.hizliresim.com
Thanks to this formula, even if the weights given to the outputs change, the indicator always continues to take a value between 0 and 100.
how to use it ?
With the input named "exp", you can change the sensitivity of the indicator and develop different strategies. other inputs are the same as the stochastic indicator. Increasing the exp value causes the indicator to signal less, decreasing it makes it much more sensitive.

ALMA/EMA/SRSI Strategy + IndicatorBack with another great high hit rate strategy!!
Disclaimer* This strategy was sampled using source code written by @ClassicScott , as referred to in the script, there is a clear line where the source code was scripted by myself.
This Strategy consists of three key factors, the ALMA, EMA crossover, and a Stochastic Rsi
ALMA: The Alma is the step line shown, turning green and red at select times. This average value gives general oversight of the macro movement of price action. and this particular one was coded by Mr.ClassicScott.
EMA crossover: At the input screen you are given an option of the fast and slow ema's. The default is solely for the hit rate and correlation to the Alma of this strategy. The arrows you see depicted on the chart are the crossover events happening.
Stochastic Rsi: The Stochastic Rsi is a stochastic value, using data sampled from the rsi. The use of this indicator in my strategy is to prevent entries when too overbought and oversold, as well as closures and vice versa, to prevent holding bags either way.
Fixed % TP: In the input screen you are given a take profit and stop loss percentage, for good R/R the hit rate will take a notch down, but with no R/R it will be near perfect.
How to use this:
Add it to your chart to get the strategy inputs. (The strategy is really only useful on a 15min TF. However the indicator within it can be used on anything at anytime!)
Watch the yellow and aqua moving averages, these are your ema's and crossover's will trigger signals based on your integer inputs.
Find Correlation between other leading indicators, as well as crossover's down/up and a red/green alma.
DO NOT use the arrows as buy/sell signals. These are simply to show ema's are crossing under or over. Momentum indicator's paired with this can be useful to determine if it could be a buy signal or sell signal.
Cheat Code's Notes:
Almost at 1000 boosts!!! I appreciate the support from everyone and I will keep trying my best to deliver quality strategies for the people.
-Cheat Code
BYBIT:BTCUSDT

Triple RSI strategyThis strategy is commonly used both in forex and stock markets for reversal trading. when the rsi line reaches and crosses simultaneously at 3 rsi setups i.e at 7, 14, and 21, a signal is generated.
This strategy works best in 1-hour timeframe. It provides over 60 to 80 percent accuracy in 1-hour timeframe.
In the stock market, this strategy provides an excellent entry point, if one is seeking small profits.
One can expect to make around 10 to 50 pips in the forex market easily. However, I advise seeking support from price action from the lower timeframe in the forex market.
I hope you like it.
Follow for more strategies and scripts like this.

Strategy Rsi-Long Short by SebasVentuIt is the popular RSI indicator with VWAP as the source instead of the close.
What is Volume Weighted Average Price (VWAP)?
The VWAP is calculated by adding the dollars traded for each trade (price multiplied by the number of shares traded) and then dividing it by the total shares traded. That is, volume.
Es el popular indicador RSI con VWAP como fuente en lugar de cierre.
¿Qué es el Precio Promedio Ponderado por Volumen (VWAP)?
El VWAP se calcula sumando los dólares negociados por cada transacción (precio multiplicado por el número de acciones negociadas) y luego dividiéndolo por el total de acciones negociadas. Es decir, volumen.

STR:EMA Oscilator [Azzrael]Strategy based on EMA and EMA Oscilator
(EMA - close) + Std Dev + Factor = detecting oversell/overbuy
Long only!
Pyramiding - sometimes, depends on ...
There're 2 enter strategies in one script:
1 - Classic, buy on entering to OverSell zone (more profitable ~> 70%)
2 - Crazy, buy on entering to OverBuy zone (catching trend and pyramiding, more net profit)
Exit - crossing zero of (EMA - close)

RSI Overbought Oversold Divergence Strategy w/ Buy/Sell SignalsThis indicator is a copy of my RSI Overbought/Oversold Divergence Indicator with-Alerts
Only difference is that the alerts are disabled, instead it uses tradingviews strategy tester signals
If you want alerts just use the other indicator

Combo Backtest 123 Overbought/Oversold This is combo strategies for get a cumulative signal.
First strategy
This System was created from the Book "How I Tripled My Money In The
Futures Market" by Ulf Jensen, Page 183. This is reverse type of strategies.
The strategy buys at market, if close price is higher than the previous close
during 2 days and the meaning of 9-days Stochastic Slow Oscillator is lower than 50.
The strategy sells at market, if close price is lower than the previous close price
during 2 days and the meaning of 9-days Stochastic Fast Oscillator is higher than 50.
Second strategy
Simple Overbought/Oversold indicator
WARNING:
- For purpose educate only
- This script to change bars colors.

Scalping using RSI 2 indicator with TSLThis strategy implements a simply scalping using the RSI (calculated on two periods), the slopes of two MAs ( EMA or SMA ) having different lengths (by default, I use 50 and 200).
A trailing stop loss (%) is used.
Entry conditions:
.) Fast MA > Slow MA and Price > Slow MA and RSI < Oversold Threshold ------> go Long
.) Fast MA < Slow MA and Price < Slow MA and RSI > Overbought Threshold ------> go Short
Exit conditions:
.) Long entry condition is true and (close >= TP or close <= TSL ) ----> close short position
.) Short entry condition is true and (close <= TP or close >= TSL ) ----> close long position
The strategy performed best on Bitcoin and the most liquid and capitalized Altcoins but works excellent on volatile assets, mainly if they often go trending.
Works best on 3h - 4h time frame.
There's also an optional Volatility filter, which opens the position only if the difference between the two slopes is more than a specific value, which can be set in the study inputs. The purpose is not opening positions if the price goes sideways and the noise is way > than the signal.
Note:
.) the RSI length is 2;
.) the oversold Threshold is 90%;
.) the overbought Threshold is 10%;
.) by default, the trailing stop loss per cent is 1%;
.) by default, the fast MA length is 50;
.) by default, the slow MA length is 200;
.) by default, the MA used is EMA.
Cheers.

Momentum Strategy for cryptos (V7.B.4)Here's a strategy for low time frames (30min suggested) for BTC, based on momentum Analysis using Stochastic RSI
By default the strategy will use the 50% of the specified capital for each trade; if "Gamble Sizing" is enabled, it will add the specified amount of capital (25% by default, until reaching the 100% limit or lower) for the next trade after having detected a loss in the previous trade; if the next trade is successful, the size for the next trade comes back to 50%
• Trend Filter LONG: If the fast exponential moving average is UNDER the slow exponential moving average, it won't open LONG positions
• Trend Filter SHORT: If the fast exponential moving average is ABOVE the slow exponential moving average, it won't open SHORT positions
• Bars delay: the strategy will wait the specified amount of bars before closing the current position; the counter is triggered as soon as the closing trade condition is verified
BY MAKING USE OF THIS STRATEGY, YOU ACKNOWLEDGE AND AGREE THAT: (1) YOU ARE AWARE OF THE RISKS ASSOCIATED WITH TRANSACTIONS OF DIGITAL CURRENCIES AND THEIR DERIVATIVES; (2) YOU SHALL ASSUME ALL RISKS RELATED TO THE USE OF THIS STRATEGY AND TRANSACTIONS OF DIGITAL CURRENCIES AND THEIR DERIVATIVES; AND (3) I SHALL NOT BE LIABLE FOR ANY SUCH RISKS OR ADVERSE OUTCOMES.

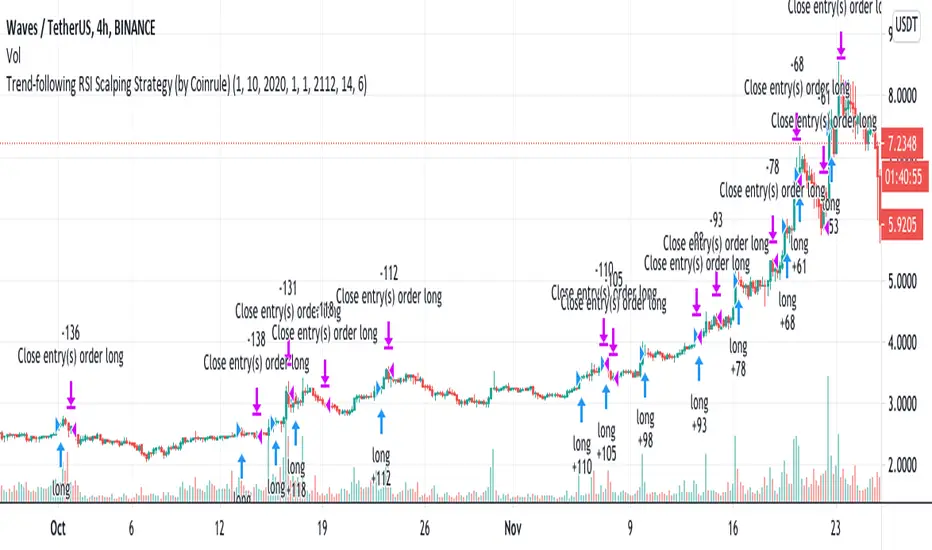
Trend-following RSI Strategy According to classical technical analysis, an RSI above 70 should signal overbought conditions and, thus, a sell-signal. Cryptocurrencies represent a whole new asset class, and they reshape the classical concepts of technical analysis. FOMO-buying can be very powerful, and coins can remain in overbought conditions enough to provide excellent opportunities for scalping trades on the upside.
Building a trend-following trading strategy based on the RSI, which is generally considered a contrarian indicator, may sound counter-intuitive. Over 200 backtests prove that this is a very interesting long-term setup.
The setup is optimized on a 4-hours time frame and trading cryptocurrencies versus USD or stable coins.
The strategy tries to catch coins on sustained uptrends to take advantage of further upside.
The strategy's buy-signal triggers when a coin has an RSI above 70 on a 4-hours time frame.
The strategy sells the coin if a profit of 6% is achieved. Alternatively, it closes the position if the RSI drops below 55, indicating a possible weakening of the trend.
The strategy assumes each order to trade 30% of the available capital. A trading fee of 0.1% is taken into account. The fee is aligned to the base fee applied on Binance, which is the largest cryptocurrency exchange.
dirt cheap yet elegant RSI StrategyFor Educational Purposes. Results can differ on different markets and can fail at any time. Profit is not guaranteed.
This only works in a few markets and in certain situations. Changing the settings can give better or worse results for other markets. This is a good way to show off a good looking strategy, atleast in paper, with minimal effort involved in the making and usage. It can be made with the most minimal lines of code if needed to bring shame unto others. It only works in a few markets and who knows if it will actually rebound from the overbought or oversold levels but in case it doesn't I put in a time-based stop to exit in case of that worst case scenario. There's not much to it, good for trolling others, or serious business, you decide.
[astropark] Super Stochastic RSI [strategy]Dear Followers,
today a new Scalper Tool , which works great on 3 minutes and 5 minutes timeframes !
I called it " Super Stochastic RSI ", as it is based on StochRSI and inherits some basic functionality from it.
If you check its settings, you will see that you can have 3 different buy-sell sources (first two are active by default):
STRONG BUY/SELL : buy when green area deeply falls into oversold zone and sell when red area gets into overbought zone (you can set and edit at which level oversold and overbought zones start);
K/D CROSSES : buy when k-line cross above d-line and sell viceversa (you can set and edit specific cross ranges for both buy and sell);
WEAK BUY/SELL : buy when green area at least go below 50 level and sell when red area at least goes above 50 level (you can edit both levels); these conditions are highlighted as background color and are very useful for taking (at least partial) profits in trades.
By default the script will be placed as oscillator on a specific pane below the chart, but
> you can disable the oscillator plot by enabling the "hide all plot" option
> and place it as overlay on chart by clicking on the black arrow at then end on the indicator name in chart and selecting "move to -> existing pane above"
This strategy can trigger till 10 buy or 10 sell signals in a row before reverting, so use a proper money management .
Strategy results are calculated on 20 trading days using 1000$ as initial capital and working at 10x leverage.
The user who wants to use this strategy, especially via an automated bot, must always set a stoploss at 3-5% from entry point or use a proper risk management strategy .
This is not the "Holy Grail", so use it with caution.
This script will let you backtest the strategy and find best settings for your preferred market.
The alarms script version of this indicator, which will let you set all notifications you may need in order to be alerted on each triggered signals, can be found here below:
This is a premium indicator , so send me a private message in order to get access to this script .

Abacus (CMF + Stoch. + Chop.) StrategyThis strategy combines uses Chaikin Money Flow, Stochastic Oscillator, and the Choppiness Index to determine trend strength and direction and generate entry and exit signals. This is a strategy adaptation of our earlier CMF + Stoch + Choppiness Index indicator.


Julian's RSI 30/70A simple strategy that only enters long positions. The position will enter the long when the RSI is below 30 and will exit the long when the RSi is above 70.

Overbought/Oversold Simple Overbought/Oversold indicator
You can change long to short in the Input Settings
WARNING:
- For purpose educate only
- This script to change bars colors.
MACD + RSI TSA simple strategy that use EMAs convergence/divergence and RSI peeks to take position. Fractals are really useful to positioning your stop loss.
It works well on commodities and forex markets.
