Wave Trend w/ VWMA overlayThis is a trend-following strategy and indicator which combines the Wave Trend Strategy (Lazy Bear) by thomas.gigure with the cRSI + Waves Strategy with VWMA overlay by Dr_Roboto .
You may update the parameters of the Wave Trend oscillator or the VWMA indicator to match your own preferences. You may also adjust the Base Quantity used for determining trade size (as described below) to suit your account size and risk tolerance.
The strategy identifies potential signals based on the on the Wave Trend oscillator, originally ported to TradingView by LazyBear. When a signal is produced by the Wave Trend oscillator, trade size is determined by the VWMA.
When the VWMA is trending against the direction of the Wave Trend signal, Base Quantity x 1 is used
When the VWMA is trending neutral, Base Quantity x 2 is used
When the VWMA is trending with the direction of the Wave Trend signal, Base Quantity x 4 is used
The strategy includes the ability to limit trade signals to certain defined periods of time ("Sessions") during the trading day and, optionally, to close any open position at the end of either or both "Sessions." This may be enabled/disabled via the Limit Signals to Trading Sessions? option on the "Inputs" tab of the strategy's "Settings" window.
If you are trading on a daily chart (or longer) you must disable the Limit Signals to Trading Sessions? in order for the strategy to produce signals.
Oscillators

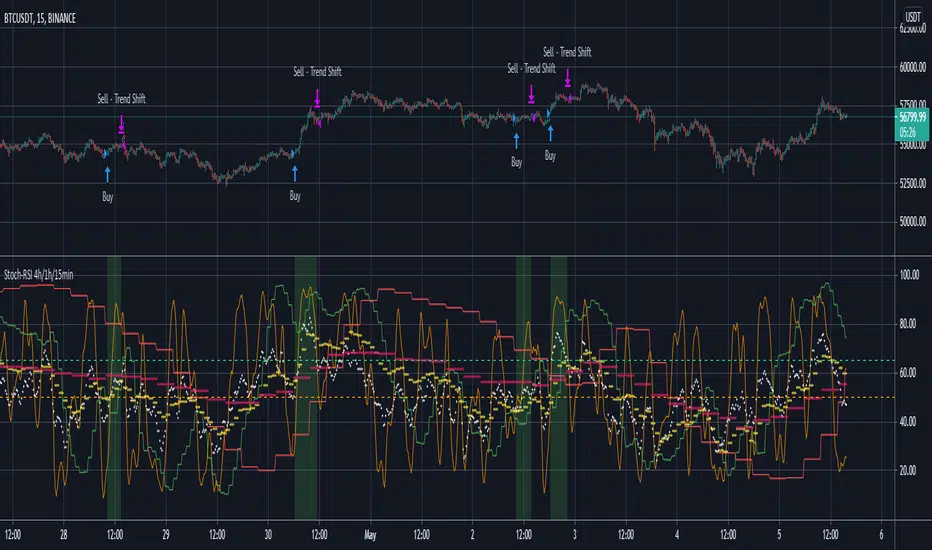
Stoch-RSI 4h/1h/15min!!!! Note: Run this on the 15min timeframe (Important) !!!!
Note the default settings on this indicator are best for BTC/USDT. For other pairs it might take some fiddling with variables to get a useful result (if a useful result is obtainable with the selected pair)
Generally, select between the options (RSI/Stoch) and (15min/1hour) and (1hour/4hours) - to find a strategy backtest result that is worth considering.
Only long positions are considered here (I tried shorts but could not get a credible backtest result with this approach).
This is an indicator which looks at RSI and StochRSI on the 15min, 1hour and 4hour timeframe.
The user can select a 15min/1hour option (RSI/Stoch) and then also a 1hour/4hour option (RSI/Stoch).
So there is one selection from a lower (15min/1hour) timeframe and another selection from a longer (1hour/4hour) timeframe.
The general idea is to, consider buying when, the lower timeframe (RSI/Stoch) is going upwards and also the longer timeframe (RSI/Stoch) is going upwards.
A good backtest result would suggest that the confluence in RSI/Stoch over the shorter and longer timeframes can estimate a good time to buy.
(Careful with a 1hour Stoch for the shorter timeframe variable as its possible to also select a 1hour Stoch for the longer timeframe variable.)
There are user set variables that can be set to avoid a buy signal, if either the lower or high timeframe variables are greater than.
For example, buying when a rsi/stoch is >65% might not be advisable as the rsi/stoch is most probably due for a downswing when above this value.
The strategy closes a position when either the shorter or longer timeframe variables no longer are going up.
There is also a take profit % which can be set to exit trades at a given %.
The default values on this indicator tool are for bitcoin, which shows a reasonable backtest result. - worth sharing on tradingview.
Please do get in touch for any additional information/suggestions.
Sincerely,
MoonFlag
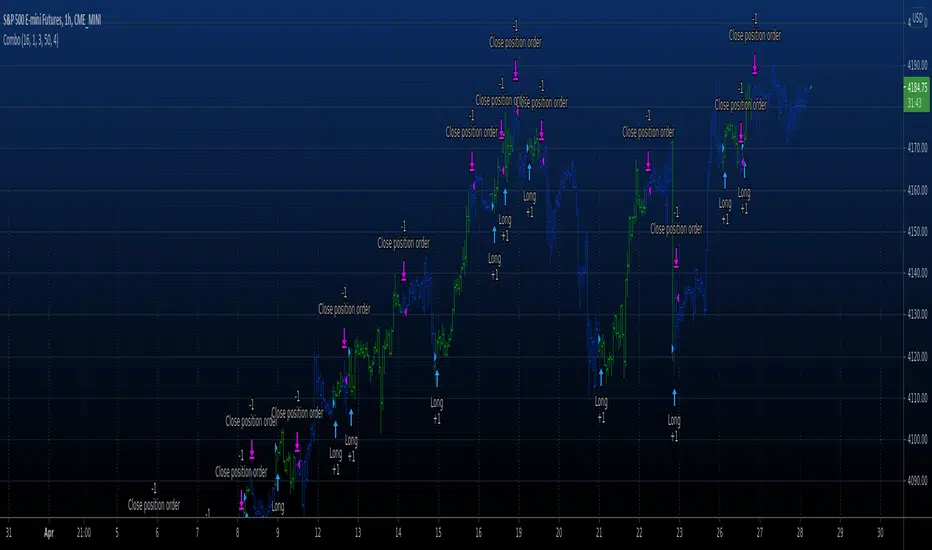
3 EMA Stochastik RSI ATR SL TP only LONGHey there!
Here i will show you the 3 EMA RSI Stochastic Crossover strategy with an ATR SL and TP.
The strategy works as follows:
For long positions, the EMA's must be in the following order:
The 8 E M A must be above the 14 E M A and the 14 E M A must be above the 50 E M A.
The buy signal is given to us by the Stochastic RSI indicators.
The K line must cross the D line above. The following candle must then close above all E M A's.
The stop loss is determined by three times the value of the ATR.
The take profit is determined by two times the value of the ATR.
In this strategy only long positions are traded.

3x SuperTrend Strategy (Mel0nTek) V1This is a triple SuperTrend based strategy for lower time frame trades such as day trades and scalping. I have not seen many strategies that combine multiple SuperTrends so I thought I would publish this one since I put it together and have been quite happy with the results. I have found through testing that the best results are on currency exchange markets such as Crypto or Forex on 1-15 min time frames.
The core idea was inspired by a youtube video put out by Trade Pro:
"Trade Pro - HIGHEST PROFIT Triple Supertrend Trading Strategy Proven 100 Trade Results"
I went ahead and set the defaults to the ones he uses in his video for anyone who wants to try a configuration similar to his. They work pretty well in general, however the EMA, SuperTrend ATR multipliers, and P/L ratio can be tuned/optimized to fit the timeframe/market desired. The video is quite good but not a required watch as I will explain below.
The 200EMA is used as a medium-term trend direction indicator.
- Price closing consistently above the 200EMA means that only long positions should be entered.
- Price closing consistently below 200EMA means that only short positions should be entered.
The 3 SuperTrend indicators should be used as direction confirmation for entries. Typically, price above SuperTrend indicates bullish movement, while price below SuperTrend indicates Bearish movement. However by itself, it is not a great indication to enter/exit positions in my experience. By combining 3 of them with slightly longer periods and increased ATR multipliers, we can get much stronger confirmation of trend direction/strength.
The way they are used in this strategy is such that:
- We only want to enter a position if at least 2 out of 3 SuperTrends are on our side.
- 3/3 SuperTrends on our side is the best case, since we are taking trades WITH momentum/price strength.
- The second farthest SuperTrend from entry price is used as a Stop Loss
SuperTrend being on our side is not the only requirement for an entry however. The probability of success is increased with SuperTrend, and a longer EMA on our side, but we want to be sure that we aren't getting in too late/after the movement has already happened.
So we use Stoch RSI to pick our entries where price is oversold/overbought and reversing. That means the Stoch RSI is above 80, or below 20, and our indication to enter the trade is when the 2 lines cross/begin reversing direction.
So with trend direction on our side, we can get really good entries at these oversold/overbought extremes, especially as it's reversing (Stoch RSI K and D are crossing). This allows us to use the SuperTrend as a support/stop loss on our entry since price should be above it.
Then we just target 1.5x our max loss so that even if we only win 50% of the time, we still make a profit.
The explicit rules of this strategy are as follows:
=== Rules ===
long only
- price above EMA200
short only
- price below EMA200
Stop Loss = 2nd SuperTrend line above (short) or below(long) entry candle
Profit = 1.5x SL/risk (Profit Ratio x Max Loss)
=== Entry Setup ===
LONG
- Stoch RSI below 20, cross up
- at least 2 SuperTrend lines below close
SHORT
- Stoch RSI above 80, cross down
- at least 2 SuperTrend lines above close
P.S. Special thanks to Trade Pro for producing so many quality videos, putting strategy claims to the test, and providing me with so many good ideas I apply to my own strategies.

Sentiment OscillatorPrice moves when there are more market takers than there are market makers at a certain price (i.e. price moves up when there are more market buys than limit sells and vice versa). The idea of this indicator is to show the ratio between market takers and market makers in a way that is intuitive to technical analysis methods, and hopefully revealing the overall sentiment of the market in doing so. You can use it in the same way you would other oscillators (histogram crossing zero, divergences, etc). The main difference between this and most volume-weighted indicators is that the price is divided by volume instead of multiplied by it, thus giving you a rough idea of how much "effort" it took to move the price. My hypothesis is that when more volume is needed to move the price, that means bulls and bears are not in agreement of what the "fair price" should be for an asset (e.g. if the candle closes only a bit higher than its open but there's a huge spike in volume, that tells you that a majority of the market are starting to think the price is too high and they've started selling).
Methods of Calculation
1. Price Change Per Volume
The main method this indicator uses to reveal market sentiment is by comparing price change to the volume of trades in a bar.
You will see this calculation plotted in its most basic form by ticking the "Show Bar per Bar Change/Volume" box in the inputs dialog. I personally found that the plots were too noisy and cannot be used in real time reliably due to the fact that there is not much volume at the open of a new bar. I decided to leave in the option to use this method, in case you'd like to experiment with it or get a better grasp of how the indicator works.
2. Exponential Moving Averages
In my quest to smooth out the plotted data, I experimented with exponential moving averages. Applying an EMA on the change per volume data did smooth it out a bit, but still left in a lot of noise. So I worked around it by applying the EMA to the price change first, and then dividing it by the EMA of the volume. The term I use for the result of this calculation is "Market Sentiment" (do let me know if you have a better-fitting term for it ;-)), and I have kept it as an option that you can use in the way you would use other oscillators like CMF, OBV, etc. This option is unticked by default.
3. MACD
I left "Market Sentiment" unchecked as the default option because I thought an easier way to use this indicator would be as a momentum indicator like the MACD . So that's what I turned it into! I applied another EMA on the Market Sentiment, added a slower EMA to subtract from the first, and now we have a MACD line. I added a signal line to subtract from the MACD , and the result is plotted as a histogram... ish . I used area instead of columns for plot style so you don't get confused when comparing with a regular MACD indicator, but you can always change it if an actual histogram is more your taste.
The "histogram" is the main gauge of sentiment change momentum and it is easiest to use, that is why it is the only calculation plotted by default.
Methods of Use
As I have mentioned before, you can use this as you would other oscillators.
-The easiest way to use this indicator is with the Momentum histogram, where crosses over 0 indicate increasing bullish sentiment, and crosses below 0 indicate increasing bearish sentiment. You may also spot occasional divergences with the histogram.
-For the Market Sentiment option, the easiest way to use it is to look for divergences.
-And if you use the "Price Change per Volume of Each Bar", well... I honestly don't know. I guess divergences would be apparent towards the close of a bar, but in realtime, I don't recommend you use this. Maybe if you'd like to study the market movement, looking at historical data and comparing price, volume , and Change per Volume of each bar would come in handy in a pseudo-tape-reading kind of way.
Anyway, that's my explanation of this indicator. The default values were tested on BTC/USDT (Binance) 4h with decent results. You'll have to adjust the parameters for different markets and timeframes.
I have published this as a strategy so you can test out how the indicator performs as you're tweaking the parameters.
I'm aware that the code might not be the cleanest as I have only started learning pine (and code in general) for about a month, so any suggestions to improve the script would be appreciated!
Good luck and happy trading :-)

Simple way to BEAT the market [STRATEGY]This script has been created to demonstrate the effectiveness of using market regime filters in your trading strategy, and how they can improve your returns and lower your drawdowns
This strategy adds a simple filter (A historical volatility percentile filter, an implementation of which can be found on my trading profile) to a traditional buy and hold strategy of the index SPY.
Note, There are other filters that could also be added including a long-term moving average/percentile rank filter/ADX filter etc, to improve the returns further.
The filter closes our long position during periods of volatility that exceed the 95th percentile (or in the top 5% of volatile days) and buys back when the volatility is below 95% rank of the past 100 days
Have included the backtest results since 1993 which is 28 years of data at the time of writing. Comparison of traditional buy and hold with this modified strategy can be found below:
Traditional buy and hold:
Return per year: 7.95 % (ex Dividends)
Total return: 851.1 %
Max drawdown: 50.79 %
'Modified' buy and hold (this script):
Return per year: 9.92 % (ex Dividends)
Total return: 1412.2 %
Max drawdown: 31.57 %
Feel free to use some of the market filters in my trading profile to improve and refine your strategies further, or make a copy and play around with the code yourself. This is just a simple example for demo purposes.

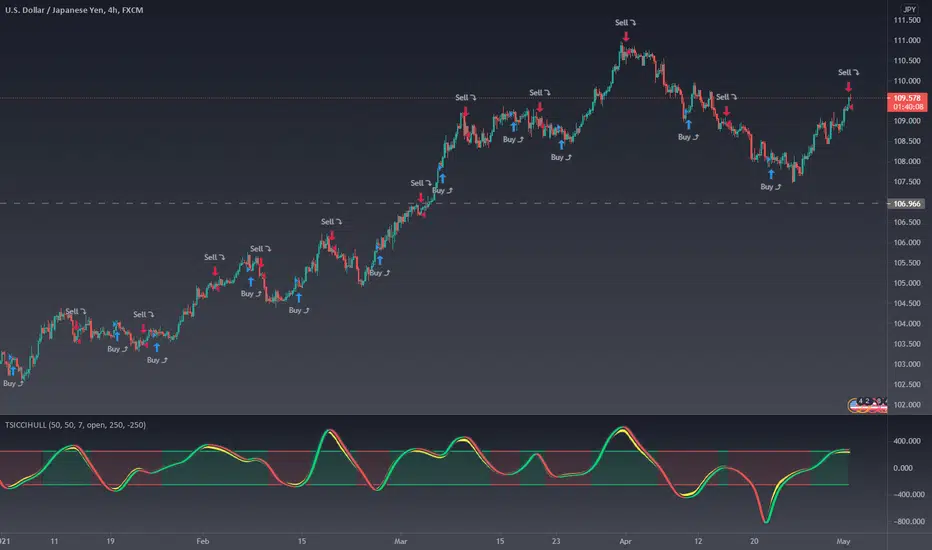
HULLTSIBOTDo you like TSI indicator?
Do you like HMA indicator?
The all new, HULLTSIBOT indicator!
About:
TSI indicator was on a space mission to mine other planets and then the crew stumbled upon a bunch of HMA indicator eggs. In the darkness of the slime room they found, There was a suddenly a bunch of failing and swearing and machinegun fire muzzle flashes, then all fell silent.
from the back shadow mist stepped forward a TSI indicator, but its eyes were bloodshot and it did not look the same...
The rescue ship found the TSI indicator motionless but still with a heartbeat....
a few days went past, the TSI indicator layed in the medic bay,
A medic noticed a bulge in the abdomen, that started to move!
The alien lifeform burst through the stomach of the TSI indicator and flew at the medic, covering the face and overpowering the new victim with ease...
Quickly it spread throughout the entire rescue ships crew, with many new alien lifeforms searching every corner for a new host.
The rescue ship flew on, able to land with autopilot as programmed for in emergencies, Thus the HULLTSIBOT was introduced to the humans world...
planet earth
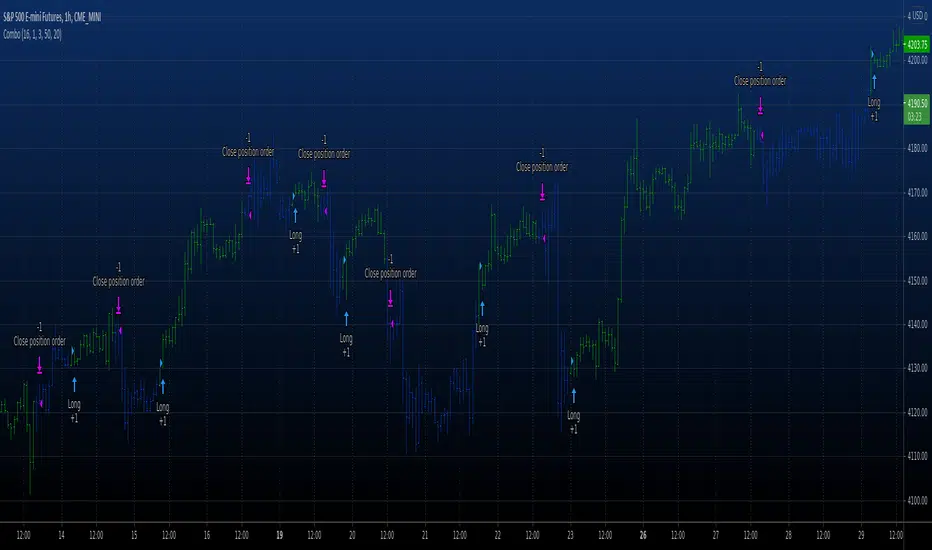
All in One StrategyTrue improvement over my previous script. This script adds in all of the complementary indicators, makes it truly easy to adjust the inputs, and has produced a real world net gain using the TradingView bots paired with any broker's API that is supported.
It has a selection for which strategy you'd like to use and due to limitations in Pine I cannot program in logic to make sure you only pick one, so you need to make sure you are only picking one.
To tweak the Connors option - it only depends on the RSI length variable, everything else is hard coded and tweaked for Crypto.
To tweak the MACD - play around with the min and max values of the RSI for lookback and the amount of candles to lookback. Then tweak the fast and slow MA lengths. I have found that a fast length of 3 or 4 and a slow length between 6 and 10 will yield the highest gains.
Also, when I was a young Noob I thought using a chart timeframe of 5 minutes was the best...no...no it wasn't. I lost my ass. Don't lose yours. I highly suggest sticking with a 30 minute timeframe, you will minimize losses caused by false triggers, have less trades and higher profits. More is not always better, trades that may sell one day and then buy six days later are normal. Leave it do its magic and you'll be very happy in the end.

Strategy - DMI Indicator with DPO Indicator as a GuardThe Directional Movement Index Indicator is one of my favorite indicators in tradingview's built-in library. It is free to use for all
For more information on what the DMI is, please visit: www.tradingview.com
The only problem I've come across with the DMI is that when it hits a 'trade range zone' it triggers false new trends (this is the case with almost every indicator I've ever tested).
This script modifies the DMI by removing the need for the ADX logic. It only focuses on the +DI and the -DI.
In order to remove the 'noise' generated during a trade range zone I have added another powerful indicator called the Detrended Price Oscillator.
The DPO is also a 'built-in' indicator on tradingview. www.tradingview.com
The DPO is used in conjunction with the DMI to stop trade ranges from wrecking your profits.
This strategy logic simply checks for the DMI indicator to cross itself. If the +DI crosses over the -DI this is a bullish cross and visa versa, if the -DI crosses over the +DI then it could mean bearish sentiment is building.
But then strategy logic uses the DPO to check if the DPO is above 0 or below 0 value
If the +DI crosses over the -DI and the DPO is above 0 value, then it's a Long entry point.
However, if the +DI crosses over the -DI and the DPO is below 0 value, then the Long signal is void.
And visa versa, if the -DI crosses over the +DI and the DPO is below 0 value, then it's a Short entry point (unless the DPO is greater than 0)
With this DPO 'guard' in place, it helps us keep the total trades executed to a minimum.
This is vital to push through trade ranges that can wreck your profit potential.
I wish I could create a better plotting mechanism for this indicator so you can better see the visuals. But combining the DMI to scale with the DPO is not possible.
The best solution is to simply add another DMI indicator to your chart so you can compare the DMI to this script that is dominated by the DPO (yellow line).
Enjoy! Likes are much appreciated!

DRSI DMA Scalping Strategy No RepaintThis strategy compares the slope of a Moving Average (of your choosing) to the slope of a Momentum Indicator (of your choosing). Zero is the center line because 0 slope means sideways movement. When both lines cross your buy threshold, it buys. When both lines cross your Sell threshold, it sells. The lines may look choppy, but that is probably because it is referencing a different timeframe than what the chart is set to. I left as many settings adjustable by the user as possible so you can tune this strategy to the relative behavior of whatever you are trading.
This also includes a No Repaint function so the backtest should be as close to live trading as possible.

[KL] Bollinger bands + RSI StrategyThis strategy is based on two of my previous scripts, one called “RSI14 + 10”; the other one called “Bollinger Bands Consolidation”. At its core, it combines the main setups from each of those two scripts but excludes the auxiliary features that were considered as experimental. This strategy will identify periods of squeeze, and then enter long during consolidation with a trailing stop loss set.
Primary indicator will be the Bollinger Bands. By comparing the width of the BBs with the ATR of the same lookback period (i.e. 2 standard deviations of the 20 recent closing prices vs ATR(20) x2), we begin to look for confirmation for entry whenever the standard deviation of prices is less than the ATR. This can be seen visually in the plots (i.e. default gray lines representing ATRx2 relative to BB center line).
Confirmation for entry will be the RSIs (slow-14, and fast-10). If both are upward sloping, then we assume prices are in an uptrend and may eventually break above upper band. RSIs are typically in mid-range when prices are consolidating, therefore no need to measure it.
Exits will happen in two cases, (1) when trailing stop loss hits, or (2) when RSIs signal that the instrument is overbought. No. 1 is self-explanatory. No. 2 happens, when RSI14 reaches above 70 (can be changed), followed by RSI10 catching up and surpassing RSI14.

MACD, RSI, & RVOL Strategy
This strategy combines the use of MACD (12, 26, 9), RSI (14, 30, 70), and RVOL (14) to create Long Buy and Sell signals. This works well with many different time intervals but was developed with 15-minute intervals in mind.
Using MACD as a reference, the strategy identifies when the MACD line crosses over (a factor in a buy signal) and under (a factor in a Sell signal) the Signal line. This shows a shift in positive (cross over) and negative (cross under) of a security.
Using the Relative Strength Index ( RSI ) as an indicator, the strategy notices when the velocity and magnitude of the directional price movements cross over the Oversold signal (30) and crosses under the Overbought signal (70) as a factor in creating a Buy and Sell signal.
Using Relative Volume (RVOL) as an indicator, the strategy calculates when the current volume has crossed over the 2x average volume indicator over a given period and is then used as a factor in creating a Buy signal. RVOL is also used when the change in volume crosses under a set RVOL number (in this strategy, it is set to a RVOL of 5).
RVOL = Current Volume / Average Volume over a certain period
This strategy indicates a Buy signal when 2/3 conditions are met:
- RSI Cross Over the Over Sold signal (default 30)
- MACD Cross Over of Signal ( MACD > Signal)
- RVOL Cross Over of 2 (RVOL > 2)
This strategy indicates a Sell signal when 2/3 conditions are met:
- RSI Cross Under the Over Bought signal (default 70)
- MACD Cross Under of Signal ( MACD < Signal)
- RVOL Cross Under 5 (RVOL < 5)
Enjoy and leave feedback!

Combo Backtest 123 Reversal & Psychological line This is combo strategies for get a cumulative signal.
First strategy
This System was created from the Book "How I Tripled My Money In The
Futures Market" by Ulf Jensen, Page 183. This is reverse type of strategies.
The strategy buys at market, if close price is higher than the previous close
during 2 days and the meaning of 9-days Stochastic Slow Oscillator is lower than 50.
The strategy sells at market, if close price is lower than the previous close price
during 2 days and the meaning of 9-days Stochastic Fast Oscillator is higher than 50.
Second strategy
Psychological line (PSY), as an indicator, is the ratio of the number of
rising periods over the total number of periods. It reflects the buying
power in relation to the selling power.
If PSY is above 50%, it indicates that buyers are in control. Likewise,
if it is below 50%, it indicates the sellers are in control. If the PSY
moves along the 50% area, it indicates balance between the buyers and
sellers and therefore there is no direction movement for the market.
WARNING:
- For purpose educate only
Jigga - Heatmap ComparisionHi All,
I always have a question on how to know which sector is performing. I have created this Heatmap comparison to know strength of sector.
I have used RSI and MACD calculation and put it across 5 different index. Color shows bullishness and Gray shows weakness.
You can select RSI or MACD or Both to have calculation. And you can also compare stocks if you want.
Note: Use it for Medium / Long term investment. Can not be use for Intraday.
Happy investing !!

Multiband - Market TimerThis strategy is made for market timing in the bull markets. Hence, more ideal to use it with index ETFs or high conviction large caps.
This makes use of different custom indicators:
Multi Band Channel - Overbought/Oversold Oscillator
VixFix Linear regression
Regular Linear Regression.
Multi Band Oscillator is used for identifying overbought/oversold state of the instrument. This is used in conjunction with VIXFix Linear Regression to to find market bottoms for entry conditions.
Few parameters are explained below:
CheckBandDistance - If checked checks for narrow bands and ignore signals when crossover happens in narrow bands.
ConsiderOversoldDaysCounter/ConsiderOverboughtDaysCounter - If checked, considers oversold and overbought crossovers only if instrument stays in oversold/overbought state for that many bars.
UseLinearRegressionToOpen/UseLinearRegressionToClose - If checked, combines linear regression along with overbought/oversold condition for entry and exits.
UseVixFixToOpen - Uses VixFixLinear regression to identify market bottom and this condition will be combined with oversold/overbought state. When using VixFixLinearRegression signal, we can allow generating entry signals during non crossover bars. Vix Fix Entry Range sets the max bar for multi band state to be for generating signal. For example, if Vix Fix Entry Range is set to oversold, signal is generated based on VixFix if price is below oversold.
ExitStrategy - This can be trailing/reversal or combined. If set to reversal, exit will happen on state moving out of oversold region. If set to Trailing, stop will be based on trailing stops. Indicator shows what is the present stop value. If set to combined, exit will happen on stages. 30% of the remaining position gets closed upon reversals. State may go into oversold and return back many times before having full exit. If this happens, each time, 30% of the position will be closed. Full position closure happens on hitting training stop.
Candles are colored based on linear regression.
Green -> positive and moving up
Lime -> Positive moving down
Orange -> Negative moving up
Red -> Negative moving down
Purple -> Possible VixFix peak - aka Market bottom
Another snapshot of the script along with Linear regression and VIXFix-LinReg indicators:
Related scripts are found here:
I have not put additional indicators to identify trend. But, can be combined with higher timeframe trend filters to generate better signals. Making this as invite only script as I find it very lucrative to time index ETFs. Please PM me if you want to try this script.

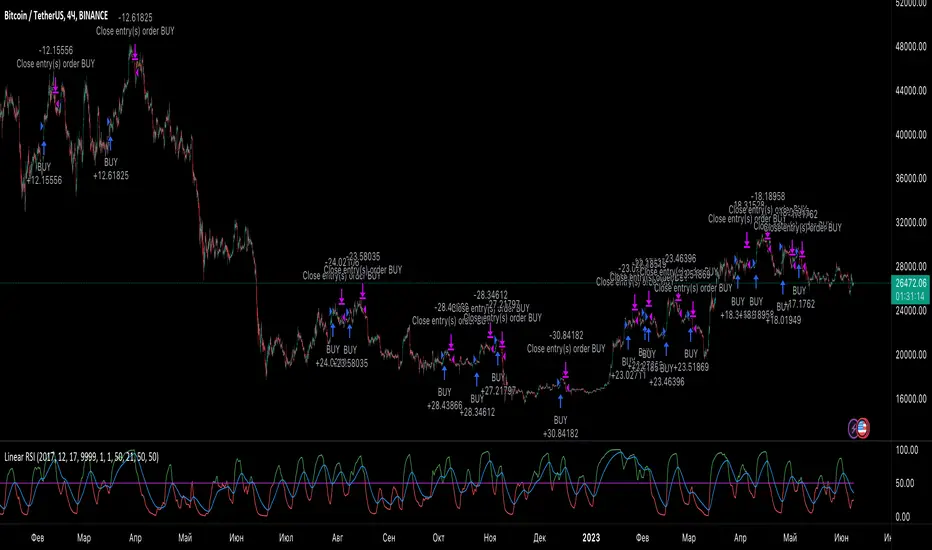
Linear RSIThis is an attempt to create a strategy based on the previous post. The strategy, as before, is based on the RSI, which is calculated using linear regression, but with the addition of EMA. The crossing of EMA and RSI is a buy and sell signal. There are also two functions to buy (because I haven't decided which is really better), so please use checkbox to order which one you would like to use.
High Low Reversal This bot makes use of an algorithm which detects new highs and lows. When doing long trades, the bot will trigger a buy order on a newly made low. When making shorts, the bot will trigger a short trade on new highs.
Currently, the bot is optimized for cryptocurrencies on the M15 time frame. With the right amount of leverage and portfolio optimization this bot can obtain very strong results.
Feel free to optimize it to your own liking on different assets and/or time frames.
This bot performs exceptionally well in trending markets. Currently, it's only making long trades, but you can make it do short trades in the control panel.
The settings of the back test as follows:
starting capital = 100k
leverage = 1
commission = 0.2%
Equity per trade = 50%. Since the bot only makes one trade at a time you can allow it to use a bigger portion of your balance per trade.
I've also made a study-script for easy implementation on the exchange. You get that script once you get access to this bot.

Combo Backtest 123 Reversal & Prime Number Oscillator This is combo strategies for get a cumulative signal.
First strategy
This System was created from the Book "How I Tripled My Money In The
Futures Market" by Ulf Jensen, Page 183. This is reverse type of strategies.
The strategy buys at market, if close price is higher than the previous close
during 2 days and the meaning of 9-days Stochastic Slow Oscillator is lower than 50.
The strategy sells at market, if close price is lower than the previous close price
during 2 days and the meaning of 9-days Stochastic Fast Oscillator is higher than 50.
Second strategy
Determining market trends has become a science even though a high number or people
still believe it’s a gambling game. Mathematicians, technicians, brokers and investors
have worked together in developing quite several indicators to help them better understand
and forecast market movements.
Developed by Modulus Financial Engineering Inc., the prime number oscillator indicates the
nearest prime number, be it at the top or the bottom of the series, and outlines the
difference between that prime number and the respective series.
WARNING:
- For purpose educate only
- This script to change bars colors.
[CADCHF] DinhChienFX's Predict signaltrend: crossing 2 times upper 2/lower 2 - stop/profit: 1/1 - Entry: Upper/lower 1, Entry 2: 0.66 (66%)
HH-HL/LL-LH: 15:15; ADX: 38, smooth: 9, DI: 9.
Order 1: 92 trades - 65.22% - R/R: 1/1
Order 2: 64 trades - 54.02% - R/R - 1/1.94 (fibonacci 66%)
Total 2 order: 156 trades - 59.62% - Net Profit: 201.46% - Max drawdown: 9.02%.
Commission: 4usd/trade
slippage: 2
1. Identify the trend
* On the chart:
a. Part of Dow theory: multi-trades active at the impulse waves.
Uptrend trend:
- HH / Higher High: The following peak is higher than the previous one .
- HL / Higher Low: The back bottom is higher than the previous one .
Downtrend:
- LL / Lower Low: The back bottom is lower than the previous one .
- LH / Lower High: The posterior peak is lower than the previous one
Pivot left: 15
Pivot right: 15
b. Keltner price channel:
- Uptrend: Go above Upper 2 two times
- Downtrend: Down to Lower 2 two times
* Under Chart:
ADX indicator: Used to identify a strong trend
- ADX smooth: 9
- DI: 9
- ADX = 38
2. Entry point:
- Buy: Buy limit at the Upper Keltner channel.
- Sell: Sell limit at the Lower Keltner channel.
3. Take profit, stoploss
ATR indicator (20) ( Average true range ) * 2

Bot go_up strategyHello. This strategy is based on go_up alerts.
Our task is to find the local minimum. The trade is entered on the basis of RSI and SMA according to a specific formula, which is embedded in the code. When the RSI crosses the SMA upside down, a long position is entered. You can change the length of the RSI . The longer the length, the less frequent, but more accurate the entrance, and vice versa. You can use a different time frame.
The settings have:
1) RSI length, the lower the length, the more often the entry.
2) Testing results for any period of time
3) Take profit for any percentage
4) Stop order for any percentage
5) If there is a check mark ✅, then purchases will always be made, and if not, then purchases will be made, BUT, if the next payback is lower than the previous one, it does not matter by what percentage.
6) If there is a check mark ✅, then each trace of the purchase will be made provided that it is lower by the percentage specified, even if the conditions of the purchase are triggered.
7) The filled area is made for visual display of consolidation zones
Default settings:
RSI length 15, step 1.5, take profit 15, stop order 30.
Also in the settings there is a pyramid of the order, keep this in mind. Enter a deal for a small part of the deposit, and not for all the money at once! You can remove pyramiding and see the results with one entry.
For a more visual understanding, overlay the go_up script.
You can choose a strategy for yourself based on history! If you need examples of strategies, then write to me, my contacts are in the column: instructions from the author.
Successful trades, dear friends, I am glad that you trust me!

Wolfpack ID Strategy with Multi TimeFrame by KrisWatersThis strategy based on wolfpack id (M) indicator authored by darrellfischer1.
Long Conditions:
Primary trend is bullish (color is green)
Secondary trend is bullish (color is green)
Minor trend (chart interval) crossover the green (bullish)
Short Conditions:
Primary trend is bearish (color is green)
Secondary trend is bearish (color is green)
Minor trend (chart interval) crossover the red (bullish)
I used primary trend interval as a 1 Week, secondary trend interval is 1 Day and chart interval is in 24 Minute.

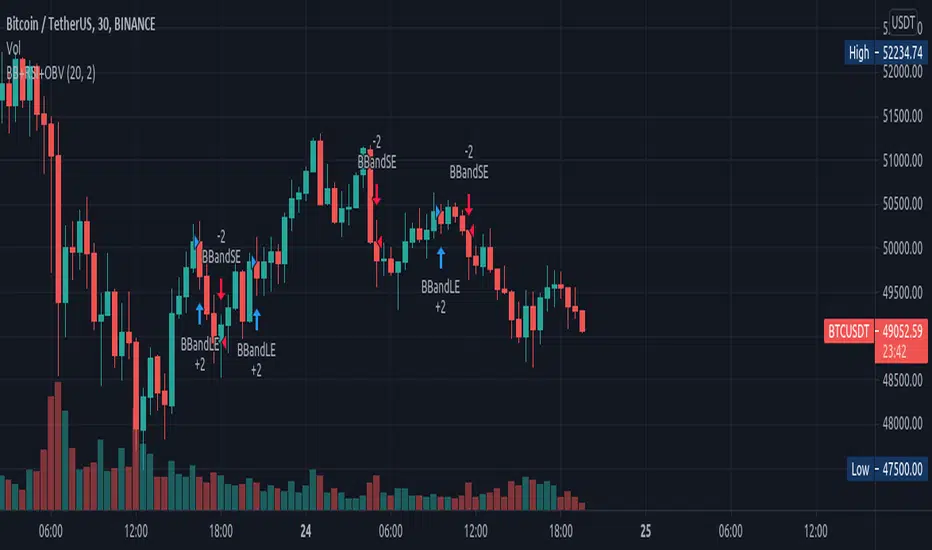
BB+RSI+OBVI use Bolinger Band and RSI and OBV
when Bolinger band midline cross and rsi is bigger than 50 and obv is going up i wrote this strategy to test this strategy
Combo Backtest 123 Reversal & Prime Number Bands This is combo strategies for get a cumulative signal.
First strategy
This System was created from the Book "How I Tripled My Money In The
Futures Market" by Ulf Jensen, Page 183. This is reverse type of strategies.
The strategy buys at market, if close price is higher than the previous close
during 2 days and the meaning of 9-days Stochastic Slow Oscillator is lower than 50.
The strategy sells at market, if close price is lower than the previous close price
during 2 days and the meaning of 9-days Stochastic Fast Oscillator is higher than 50.
Second strategy
Determining market trends has become a science even though a high number
or people still believe it’s a gambling game. Mathematicians, technicians,
brokers and investors have worked together in developing quite several
indicators to help them better understand and forecast market movements.
The Prime Number Bands indicator was developed by Modulus Financial Engineering
Inc. This indicator is charted by indentifying the highest and lowest prime number
in the neighborhood and plotting the two series as a band.
WARNING:
- For purpose educate only
- This script to change bars colors.
