MTF Ichimoku Analysis[tanayroy]Ichimoku can state market conditions better than any indicator or group of indicators(My own perspective). Ichimoku works seamlessly in different timeframes. Analysis of Ichimoku in different timeframes can give you the bigger picture of the market.
This indicator analyzes six different timeframes with Ichimoku in depth. Default timeframes are 5M, 30M, 60M, D, W, and M. You can change the default timeframes from the setting.
As we are dealing with many relations, we can define the relationship with a simple score to get the trend strength.
Ichimoku Analysis:
Relationship of Price(P) with Ichimoku indicators: Here we are analyzing the current price and Ichimoku indicators. The position of price with respect to Ichimoku indicators states the market condition clearly.
Price(P) and Kumo(C): P > C = Bullish (↑). P < C = Bearish (↓). P <> C = consolidation or no trend(↔). Score: ±2
Price(P) and Tenkan Sen(T): P >= T = Bullish (↑). P < T = Bearish (↓). Score: ±0.5
Price(P) and Kijun Sen(K): P >= K = Bullish (↑). P < T = Bearish (↓). Score: ±0.5
Price(26 bars ago) and Chiku(L): L >= P(26) = Bullish (↑). L < P(26) = Bearish (↓). Score: ±0.5
Tenkan Sen and Kijun Sen Relation. Tenkan Sen depicts short-term trends and Kijun depicts mid-term trends. So this relationship is important for analyzing the current trend of the market.
Tenkan Sen(T) and Kijun Sen(K): T >= K = Bullish (↑). T < K = Bearish (↓). Score: ±2
Direction of Ichimoku indicators.
The direction of Ichimoku indicators helps us to understand the trend strength.
Tenkan Sen's(T) direction: Upward slope = Bullish (↑). Downward slope = Bearish (↓). Flat=consolidation or no trend(↔). Score: ±0.5
Kijun Sen's(K) direction: Upward slope = Bullish (↑). Downward slope = Bearish (↓). Flat=consolidation or no trend(↔). Score: ±0.5
Senkou A(A) direction: Upward slope = Bullish (↑). Downward slope = Bearish (↓). Flat=consolidation or no trend(↔). Score: ±0.5
Senkou B(A) direction: Upward slope = Bullish (↑). Downward slope = Bearish (↓). Flat=consolidation or no trend(↔). Score: ±0.5
Cloud and other Ichimoku indicators:
Kumo or Cloud is very important in the Ichimoku system. Analyzing its relation with other indicators is important to detect the overall market condition.
Kumo(C) and Tenkan Sen(T): T >= C = Bullish (↑). T < C = Bearish (↓). T <> C = consolidation or no trend(↔). Score: ±0.5
Kumo(C) and Kijun Sen(K): K >= C = Bullish (↑). K < C = Bearish (↓). K <> C = consolidation or no trend(↔). Score: ±0.5
Kumo(C) and Chiku(L): L >= C = Bullish (↑). L < C = Bearish (↓). L <> C = consolidation or no trend(↔). Score: ±0.5
Kumo(C) Shadow: By analyzing the last 252 bars(you can change this option) we are analyzing the Kumo shadow behind the current price. If Kumo shadow is present behind the price, trend strength will be weakened. Score: ±0.5
Kumo(C) Future (Senkou A(A) and Senkou B(B)): A >= B = Bullish (↑). A < B = Bearish (↓). Score: ±0.5
Chiku(L) Analysis:
Vertical and Horizontal Chiku analysis will tell us about the possible consolidation of the price.
Chiku Vertical: if the price consolidates for the next 5 bars(You can change this option) will it run into the price. Please remember we are placing the current price 26 bars ago and we are interested to see the current price in open space for a clear trend. Score: ±0.5
Chikou Horizontal: If Chiku is in open space (Not running into the price), we want to review Chiku vertically i.e how much percentage of fall or rise of the current price can cause Chiku to run into the price.
So, the maximum trend score is ±10.5.
Ichimoku signals:
We know, that the crossover of Ichimoku indicators provides important signals. In this section, you can see all the crossover i.e when they happened (Bars ago)
Distance between price and Tenkan Sen and Kijun Sen: We know, the price come back to Tenkan/Kijun if it goes far away from Tenkan/Kijun. So it is important to note the distance between Tenkan and Price.
Please note that this indicator is not a strategy or buy/sell signal. It just shows you the picture of Ichimoku in multiple timeframes. I am working on some strategies of Ichimoku and will publish the same when my research is complete.
If you want to analyze Ichimoku in a single timeframe, please review the following indicator.
To maintain the table size you can use the shorthand notation from the setting.
Table with detailed analysis:
Table with shorthand notation:
Please comment if you want any clarification or found any bugs to report.
Mtf

SuperJump QQE MOD MTFThis is a QQE MOD MTF version.
Mihkel00 modified Glaz's script, I modified Mihkel00 's script again.
This is a QQE Mod original version by Mihkel00 :
I simply changed the above script to update pine script 5.0 and extracted two functions.
Thank you to the two authors for sharing such a great script.

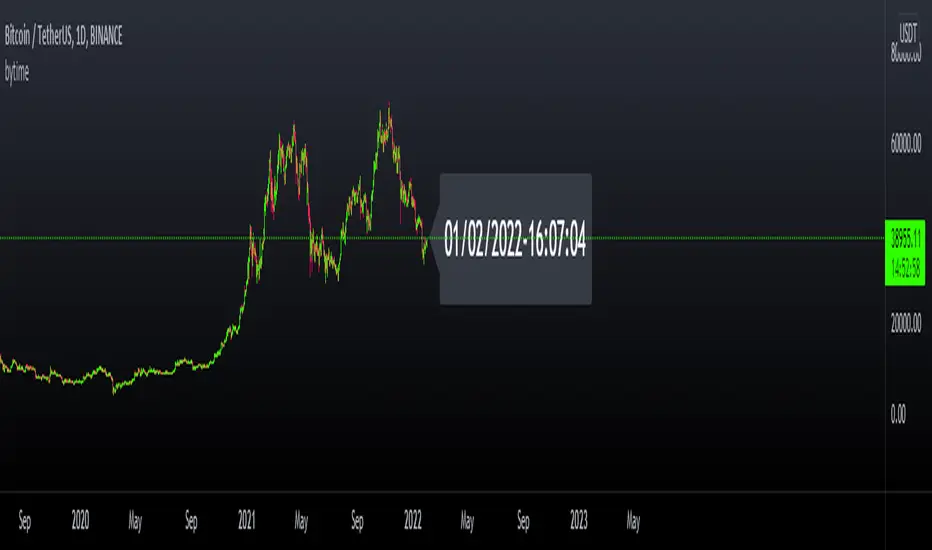
bytimeLibrary "bytime"
TODO: to do something at the specified time.
////Return =>> ht = hour , mt = minute , st = second ,Dt = Day, Mt = month, Yt = year , dateTime = full time format./////////////
Note : Remember to always add import when you call our library and change Gtime() to Timeset.Gtime() is used to access internal data.
import hapharmonic/bytime/1 as Timeset
=Timeset.Gtime()
/////////////Set a time to trigger an alert./////////////
ck = false
///hour : minute : second
if ht == TH and mt == TM and st == TS
//some action
//...
//.
ck := true
Gtime()
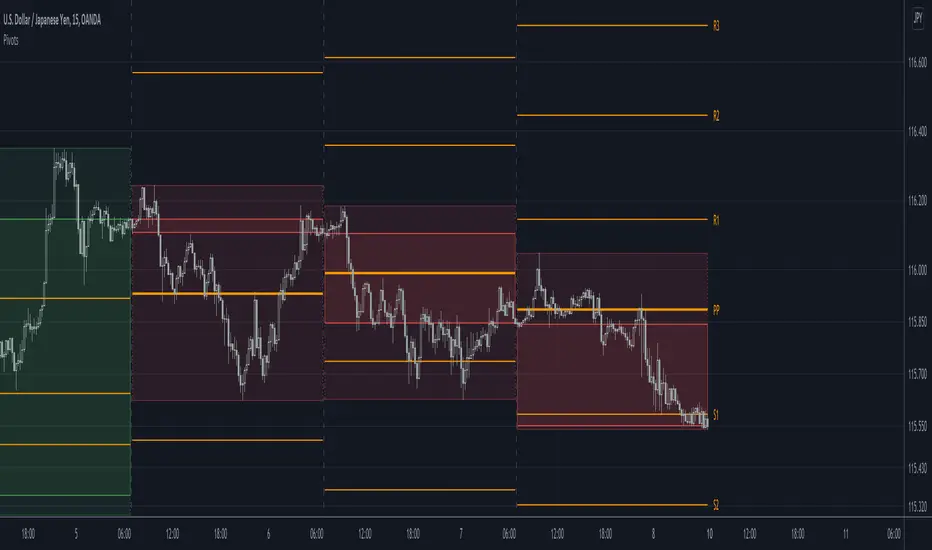
Pivots libraryLibrary "Pivots"
TODO: add library description here
pivots(_type, _open, _high, _low, _clsoe) Calculates the pivot point and returns its value.
Parameters:
_type : Specifies the type of pivot point.
_open : The open price
_high : The high price
_low : The low price
_clsoe : The close price
Returns: Returns the value of the calculated pivot point as a tuple.
cpr(_high, _low, _clsoe) Calculate the Central Pivot Range
Parameters:
_high : The high price
_low : The low price
_clsoe : The close price
Returns: Returns the values as a tuple.
htf_ohlc(_htf) Calculate the HTF values
Parameters:
_htf : Resolution
Returns: Returns the values as a tuple.
MTF RSI + Average (Multi-Timeframe) [TH]Multi-Timeframe Relative Strength Index --- MTF RSI
Eliminates having to change time intervals to view a different Time Interval's RSI value (up to 5 time intervals possible through the settings).
The RSI values from Multiple Time Frames can be averaged together to show one single RSI.
A table overlay (info box) makes it easy to quickly identify RSI values on the multiple different time frames.

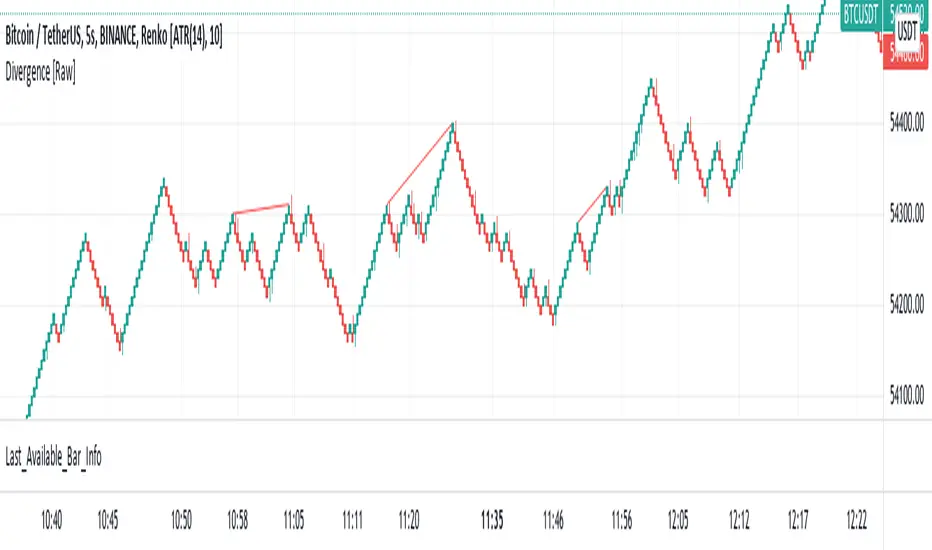
Last Available Bar InfoLibrary "Last_Available_Bar_Info"
getLastBarTimeStamp()
getAvailableBars()
This simple library is built with an aim of getting the last available bar information for the chart. This returns a constant value that doesn't change on bar change.
For backtesting with accurate results on non standard charts, it will be helpful. (Especially if you are using non standard charts like Renko Chart).
Methods
getLastBarTimeStamp()
: Returns Timestamp of the last available bar (Constant)
getAvailableBars()
:Returns Number of Available Bars on the chart (Constant)
Example
import paragjyoti2012/Last_Available_Bar_Info/v1 as LastBarInfo
last_bar_timestamp=LastBarInfo.getLastBarTimeStamp()
no_of_bars=LastBarInfo.getAvailableBars()
If you are using Renko Charts, for backtesting, it's necesary to filter out the historical bars that are not of this timeframe.
In Renko charts, once the available bars of the current timeframe (based on your Tradingview active plan) are exhausted,
previous bars are filled in with historical bars of higher timeframe. Which is detrimental for backtesting, and it leads to unrealistic results.
To get the actual number of bars available of that timeframe, you should use this security function to get the timestamp for the last (real) bar available.
tf=timeframe.period
real_available_bars = request.security(syminfo.ticker, tf , LastBarInfo.getAvailableBars() , lookahead = barmerge.lookahead_off)
last_available_bar_timestamp = request.security(syminfo.ticker, tf , LastBarInfo.getLastBarTimeStamp() , lookahead = barmerge.lookahead_off)
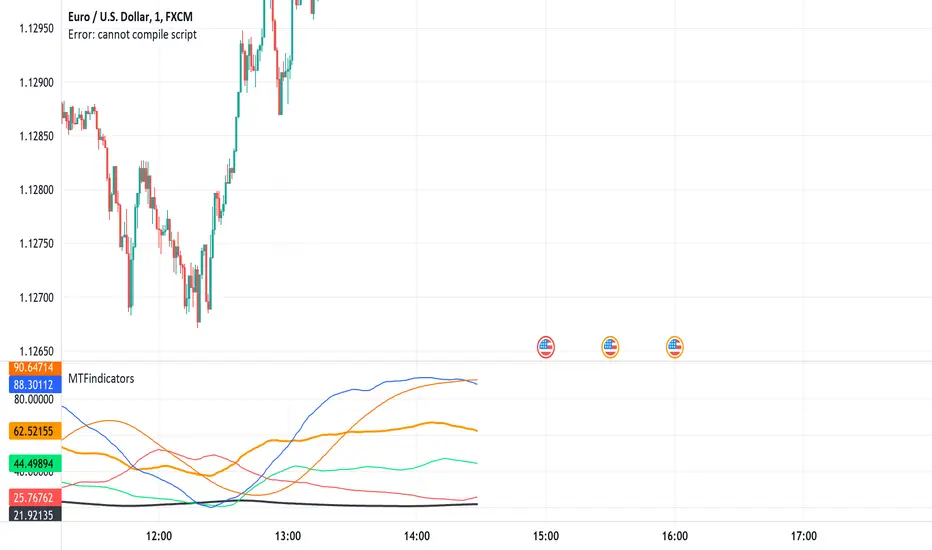
MTFindicatorsQuite recently TradingView added the possibility to create and use Libraries in PineScript. With this feature PineScript became higher quality of coding language overnight. Libraries enable splitting your code into multiple files, providing easier access to code reusability.
I was working on a script which included 3000 lines of code, which was recompiling 1:30 min, and recalculating over 1 minute as well. So I split it into 2 parts: main part + library containing "main logic", which I reuse in variety of scripts, but don't change too often. Result? Now recompilation of my main script takes 10 and recalculation 8 seconds!!!. I instantly fell in love with libraries.
Having said that, and being dedicated hater of security() calls, I have decided to publish a library of MTF indicators created with my own approach: "dig into formula". I have explained reasons for such approach in desription to this script:
So this library script will be a set of indicators reaching to higher timeframes. Just include one line at the beginning of the script you are creating:
import Peter_O/MTFindicators/1 as LIB
and then somewhere is the code add this line:
rsimtf=LIB.rsi_mtf(close,5,14)
All of a sudden you have access to rsimtf from 5x higher timeframe without any hassle :)
I start with RSI MTF, next ones will be ADX, Stochastic and some more. I will update this library with them here as well. Feel free to request particular indicators in comments. Maybe PSAR? Maybe Bollinger Bands?
GenericTALibrary "GenericTA"
What is it?
The real generic library. Which means it is just covering most built-in indicators / functions, but with more parameters, so the user don't have to write more few lines to achieve something simple and replicative.
Development process?
Will tidy it up, and setting up in later stage.
Welcome to inbox me to improve the library ------
If you are finding a similar thing. That's a good news. Because I am making it.
LibraryCheckNthBarLibrary "LibraryCheckNthBar"
TODO: add library description here
canwestart(UTC, prd) this function can be used if current bar is in last Nth bar
Parameters:
UTC : is UTC of the chart
prd : is the length of last Nth bar
Returns: true if the current bar is in N bar
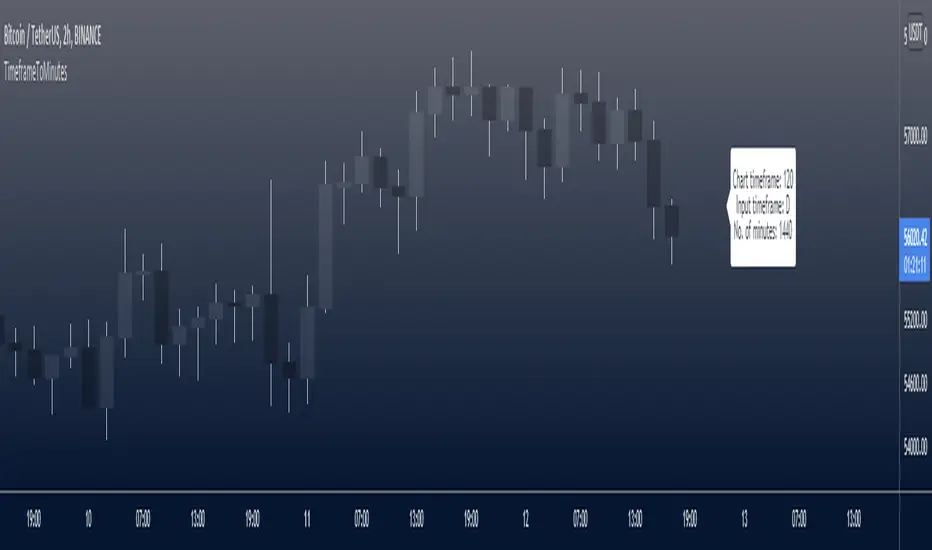
TimeframeToMinutesLibrary "TimeframeToMinutes"
The timeframeToMinutes() function returns the number of minutes in an arbitrary timeframe string.
timeframeToMinutes()
Returns the number of minutes in the supplied timeframe string, which is arbitrary, i.e. it doesn't have to be the timeframe of the current chart but can be taken from an input.
The sole advantage over the short and neat Pinecoders f_resInMinutes function from their excellent MTF Selection Framework (at ) is that this one doesn't use up a security() call.
To convert the other way, from minutes to timeframe.period format, I would use the f_resFromMinutes function from the Pinecoders' MTF Selection Framework, which does not use security().
ERROR-CHECKING: It has light error-checking to try to make sure the string is in the format timeframe.period, e.g. 15S, 1 (minute), 60 (1H), 1D, 1W, 1M.
It will throw an error for some non-standard timeframes such as 30 hours (1800 minutes). Above 1440 minutes, only whole numbers of days are allowed. This is to be consistent with the security() function.
But it will allow some non-standard timeframes such as 7 hours (420 minutes). Such timeframes must still be supplied in the standard timeframe.period format.
param _tf
The timeframe to convert to minutes. Must be in timeframe.period format.
returns
An integer representing the number of minutes that the timeframe period is equivalent to.
Multi timeframes RSI Screener & indicator by noop42Since my previous x4 multi timeframes Stochastic RSI script seems to have been appreciated, I decided to make a 2nd version of this tool which focuses on the RSI indicator only.
Default parameters
RSI length : 14
Timeframes: 5, 15, 60, 240
OB/OS zones : 70 & 30
Repaint mode: enabled
Display lines: enabled
Display screener: enabled
Convergence warnings: timeframes 1, 2 & 3
Details
Repaint mode : Disabling it makes the indicator wait for the current candle to close before to change its value
Display lines: Allows you to disable RSI lines drawings, in order to move the screener on your main chart for example.
Display screener: Allows you to disable the screener, in order to use RSI lines only
OB/OS convergences warnings : Allows you to select which timeframe(s) must be taken into consideration for convergence signals (Selected timeframes can be distinguished in the screener, followed by a * char in the timeframes column)
Note The Stochastic RSI version of this tool is available here

MTF StochRSI indicator by noop42Here is a custom x3 timeframes Stochastic RSI indicator.
Main Features (can be disabled)
Average mode : for each timeframe, a single line corresponding to the average value between K and D is printed
Repaint mode : if enabled: values are updated in live, if disabled: values are updated once the concerned candle is closed
Default parameters
Timeframes: 1, 5, 15
Mode : Average value
Repaint mode: enabled

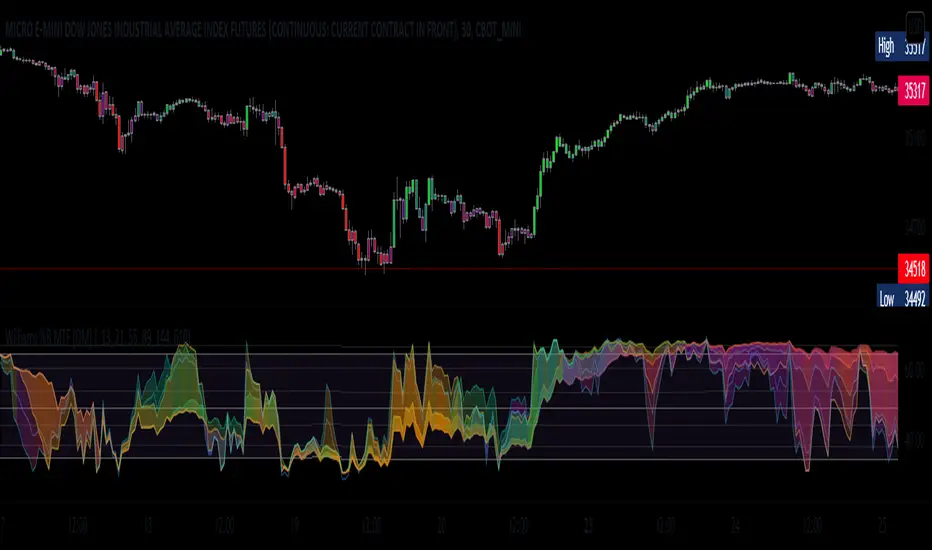
William %R MTF [DM]Greeting Colleagues
Today I share The Wlliams %R
Extras=
- 5 diferent length
- 1 extra signal with the technique used in the ultimate oscillator
- Fibo Leves based on ob os leves "width it's automatic"
- Colored bars bassed en average strength
- The indicator that is modified now has the same range as the ultimate oscillator.
Enjoy
Hx MTF Sorted MAs Panel with Freeze WarningThis script displays the close price and 4 sorted moving averages of your choice in a small repositionable panel and, when used on a higher timeframe, warns you when values may be different from actual values in the higher timeframe, inciting you to double check the actual values of the moving averages in the higher timeframe the panel is supposed to reflect.
The 4 moving averages and close are sorted together, providing you with a bird’s-eye view of their relative positions, the same way moving averages and last price values are displayed on the right scale.
The black header reminds of:
(1) the timeframe (resolution) used in the panel
(2) the remaining time before a new bar is created in the panel timeframe. Note that this remaining time is different from the one on the right scale, since it is only updated when a new transaction occurs.
Below, price and moving averages are sorted, color coded and followed by:
(1) a trend indicator ↗ or ↘ meaning that last change is up or down
(2) the number of bars since the moving average is above or below close (0 means current bar). This is obviously not displayed after the close price line (white background color).
Use
This panel was basically developed to display higher timeframe data but it can also be used with the same timeframe as chart for example if you do not want to plot moving averages on your chart but are still interested in their trends and relative positions vs price.
If you see something strange (like header is not black and displays NaN), it just means you requested moving averages that are not available in the panel timeframe. This may happen with newly introduced cryptos and “long” MA timeframes.
Different Timeframe
If you choose to use the panel on a different timeframe than the current one, be aware that you should only use timeframes higher than the current one, as per Tradingview recommendations.
If you select a lower timeframe than the current one, the panel timeframe header cell will turn to the alert color you set (fuchsia by default).
After tinkering for a while with the security function, I noticed that sometimes indicator values “freeze” (i.e. stop udating) and I have found no workaround.
What I mean is that when you look at a sma on a 5 minutes timeframe (the reference) and look at this same sma on a 5 minutes timeframe but from a lower timeframe through the security function set with a timeframe of 5 minutes, values returned by the security function are not always up to date and “freeze”. That’s the bad news.
Freeze warning
The better news is that this unexpected behaviour seems to be predictable, at least on minutes timeframes and I implemented an indicator that endeavors to detecting such situations. When the panel believes data may be frozen, the ‘Remaining Time’ header cell will turn to the alert color.
This feature is only implemented on minutes timeframes and can be switched on or off.
Other points of interest in this script
If you code, this function may also interest you:
sortWithIndexes (arrayToSort) returns a tuple (sortedArray, sortedIndexes) and therefore allows multi-dimensional arrays sorting without actually implementing a sorting algorithm 😉.
Default Settings
The default settings provide an example of commonly used moving averages with associated colors ranked from Hot (more nervous) to Cold (less nervous).
These settings are just an example and are NOT meant to be used as a trading system! DYOR!
Hope it will be useful.
Does the Freeze warning work for you? What do you think of my pseudo sorting algorithm?
Enjoy and please let me know what you think in the comments.

MTF WatchList Charts [Anan]█ OVERVIEW
I am happy to present this script with a nice idea!
You can now customize a watchlist with your preferred time frame and any symbol from any market.
The main purpose is to be aware of any moves and watch a brief overview of the chart.
█ FEATURES
- 8 customizable symbols with the option to show/hide anyone
- Multi time frame support
- 3 Types of charts (Candles / Heikin Ashi / Line)
- Displaying up to 10 candles for every chart
- Customizable chart colors
- Option to Show/hide Price
- Option to Show/hide Price Line
- Option to change Labels and Text Size
- Show Symbol name and used time frame
- Option to change gaps between charts
- Hover over on the top of any candle to see (Open/High/Low/Close) Prices
█ SCREENSHOTS
-----------------------------------------------
Special thanks to @dgtrd for inspiration and for the amazing framework used here ( HTF Candles by DGT )
Special thanks to Pine Chat @fareidzulkifli @Bjorgum @JohnBaron @fpainchaud

MTF Key Levels - Support and ResistanceThis indicator shows how to Multi Time Frame (MTF) interpret levels:
Watch how price acts around these levels and how they can act as support/resistance and can be used as great confluence levels for your technical analysis.
This indicator displays:
VWAP Levels
Daily / Weekly / Monthly / Yearly
Within the chart above I have marked out how displaying these VWAP levels can provide support and resistance levels to be aware of.
Daily – Weekly - Monthly – Yearly Levels
O = Open / H = High / L = Low
pO = Previous Open / pH = Previous High / pL = Previous Low / pEQ = Previous Equlibrium
Having previous Low/High levels makes you aware of Swing Failure Patterns (SFP). Also the daily/weekly/monthly opening and previous opening can assist with the trend.
Daily Open: Gives you an idea who is in control for the day. This level very often acts as strong support or resistance.
Weekly Open: Indicates where the price is within the higher timeframe.
Monthly Open & Yearly Levels: Overview of direction for the whole month without looking at a monthly chart and Yearly chart
Line Options
Within the line options you can choose to have a clean chart and display a “short line”. These line length can be adjusted by the user.
Line just to the right.
Line across the screen.
Disclaimer: The Monthly and Yealy VWAP will only show on higher timeframes this is due to restriction of how many candles can be shown on the chart. The candles displayed need to go back to either the start of the month of year to be able to calculate their VWAPs.

Multi TimeFrame (MTF) Trend StrengthCalculate and display simple multi timeframe (3 timeframe) trend strength using heikin ashi.

Papercuts Dual PSAR v01Dual PSAR is a trend following script that uses auto-higher timeframe calculation of the current timeframe to create a dual Parabolic Stop And Release.
This is useful because it can determine periods of transition or indecision and can flag those periods with which way it is learning even though it is undecided, what i call "Wait Zones".
When both PSARS are not in alignment, it uses the lower timeframe one to determine which way the wait zone is learning.
You can see below in the chart shows some good trends and some wait zones.
A wait zone can have bullish indication, but then still have a bearish continuation.
A wait zone can have bullish indication, and then enter a bull trend.
Typically I won't make trades in wait zones, and I will exit trades when entering one.
Just wanted to try this out and see how it did. Figured I'd share.

Tocorin_MTF_MA7 MAs (SMA or EMA) can be displayed in each period.
MTF display is performed only at 5m, 1h, and 4h.
The upper MAs to be displayed are as follows
5m: 1h, 4h, and 1D
1h: 4h and 1D
4h: 1D
The MA line style is stepline and circles to make it easier to see.
You can change it in the settings as you wish.
--
各時間足で 7本の MA(SMA or EMA) 表示が可能です。
5m, 1h, 4h の時だけ MTF 表示を行います。
表示する上位 MA は下記の通り
5m: 1h と 4h と 1D
1h: 4h と 1D
4h: 1D
見やすくするためにMA の線のスタイルを stepline と circles にしています。
設定で任意に変更してください。

Multi Time Frame (MTF) RSIThis script can display Multi time frame (MTF) Relative Strength Index (RSI) values. It works on any chart and appears at the top left of the screen.
1. It can plot values from 4 different time frames which can be customized.
2. Higher time frame indicates the main trend
3. Overbought and oversold levels are highlighted with different colours.

Papercuts Super Trend MTF v02All my scripts are part of a suite called Papercuts .
This one uses one current timeframe supertrend and adds Four Automatic Higher Timeframe Supertrends based on those same parameters to help you determine larger trends while only needing a single chart. This works quite well on 5 and 15 minute charts and will look up in time. Confident trends can be identified by having two or more lines in the same direction.
When unified, the intensity of the glow should increase a trends confidence. Unify collapses the 3 highest timeframe supertrends into the first higher timeframe supertrend. Without Unify on, the overall trends are usually easier to see at just a glance. Higher timeframe supertrends can show support or resistance and act as stop loss limit ranges if you choose. Unify keeps things a bit cleaner and more compact.
V02 updated to fsecurity for no repainting and added a 3MA trend option as well.
Thanks to @Pinecoders for helping me better understand the security function!
Here is a view with Unify on....
Here is a view with Unify off...

MTF VWAPA simple wavetrend oscillator based off WaveTrend Oscillator by @LazyBear to visualise 4 different timeframe vwap under 1 chart.
Timeframe can be changed in indicator settings in minutes. Unnecessary waves can be removed by unchecking said TF wave in Style settings.

RSI MTF TableRSI MTF covers the timeframes 1m, 5m, 15m, 1H, 4H and Daily
Works on any intraday chart and appears in bottom left of screen
Can customise colors and transparency
