Donchian with QQW MOD AND EMA strategythe 1st indicator is E M A , and the 2nd indicator is donchian trend , and the final one is Q Q E MODe , and we have to change some settings , change this E M A length from 9 to 200 ,
and change some settings on donchian indicator , so lets change Donchian channel period from 20 to 30 , and Q Q E MOD on default sittings
for a long signal to be valid , the price must be above 200 E M A ,with NEW blue histogram appeared on our q q e mode , if , donchian trend is red
for a short signal to be valid , the price must be below 200 E M A ,with NEW red histogram appeared on our q q e mode ,if ,donchian trend is green
Moving Averages

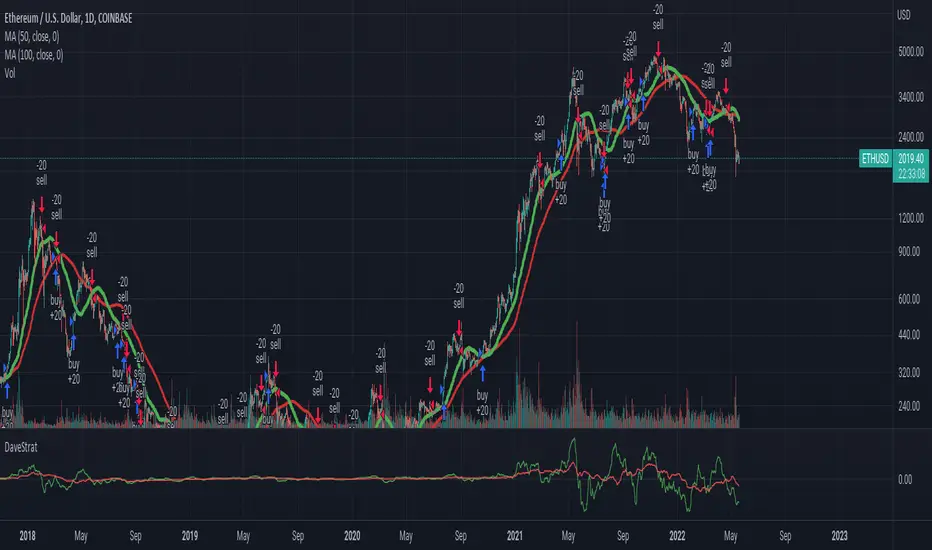
DaveStratThis script attempts to guess inflection points in cryptocurrency asset prices using change in two simple moving averages on the daily timescale.
parabolic sar with ema and rsi, this strategy includes 3 free trading view indicators, with HIGH ken ashee candles , now lets go ahead and add them to our chart ,
the 1st indicator is parabolic saarr and the 2nd indicator is E M A , and the final one is R S I , and we have to change some settings , change this E M A length from 9 to 200 ,
and change some settings on R S I indicator , so lets remove all options except for , the R S I , and the R S I middle band , and parabolic saarr on default sittings , now our strategy is ready , lets go into trading rules .
for a long signal to be valid , the price must be above 200 E M A ,with NEW buy signal from parabolic saarr, if , R S I above the middle 50 line
for a short signal to be valid , the price must be below 200 E M A , with NEW SELL signal from parabolic saarr ,if ,R S I BELOW 50 line
now we can go ahead and take a SHORT position
our stoploss must be above the recent higher high
and the risk to reward ratio will be 2

Three EMAs Trend-following Strategy (by Coinrule)Trend-following strategies are great because they give you the peace of mind that you're trading in line with the market.
However, by definition, you're always following. That means you're always a bit later than your want to be. The main challenges such strategies face are:
Confirming that there is a trend
Following the trend, hopefully, early enough to catch the majority of the move
Hopping off the trade when it seems to have run its course
This EMA Trend-following strategy attempts to address such challenges while allowing for a dynamic stop loss.
ENTRY
The trading system requires three crossovers on the same candle to confirm that a new trend is beginning:
Price crossing over EMA 7
Price crossing over EMA 14
Price crossing over EMA 21
The first benefit of using all three crossovers is to reduce false signals. The second benefit is that you know that a strong trend is likely to develop relatively soon, with the help of the fast setup of the three EMAs.
EXIT
The strategy comes with a fixed take profit and a volatility stop, which acts as a trailing stop to adapt to the trend's strength. That helps you get out of the way as soon as market conditions change. Depending on your long-term confidence in the asset, you can edit the fixed take profit to be more conservative or aggressive.
The position is closed when:
The price increases by 4%
The price crosses below the volatility stop.
The best time frame for this strategy based on our backtest is the 4-hr. Shorter timeframes can also work well, although they exhibit larger volatility in their returns. In general, this approach suits medium timeframes. A trading fee of 0.1% is taken into account. The fee is aligned to the base fee applied on Binance, which is the largest cryptocurrency exchange.

Optimised RSI strategy for Reversals (by Coinrule)The most common way to use the RSI to spot a good buy opportunity is to check for values lower than 30. Unfortunately, the RSI can remain in oversold territory for long periods, and that could leave you trapped in a trade in loss. It would be appropriate to wait for a confirmation of the trend reversal.
In the example above I use a short-term Moving Average (in this case, the MA9) coupled with an RSI lower than 40. This combination of events is relatively rare as reversal confirmations usually come when RSI values are already higher. As unusual as this setup is, it provides buy-opportunities with much higher chances of success.
The parameters of this strategy would be:
ENTRY: RSI lower than 40 and MA9 lower than the price
TAKE PROFIT and STOP-LOSS with a ratio of at least 2. That means that if you set up a take profit of 3%, your stop-loss shouldn’t be larger than 1.5%.
The advantage of this approach is that it has a high rate of success and allows you the flexibility of setting up the percentages of the take profit and stop-loss according to your preferences and risk appetite.

HULL SUIT ,VORTEX,VOLUME OSC this strategy includes 3 free tradingview indicators
the 1st indicator is hull suit and the 2nd indicator is vortex and the final one is volume oscillator
for a long signal to be valid
the price must be above green hull suit line
, with new bullish cross on vortex , the blue line has to crossover the red line this would be anew signal to entr long position if volume oscillator above zero line , our stoploss must be under the recent lower low
and the risk to reward ratio will be 1.5
for a short signal to be valid , the price must be below red hull suit line
, with new cross on vortex , the red line has to crossover the blue line this would be anew signal to entr short position if volume oscillator above zero line ,
and lets see what happened to our trade

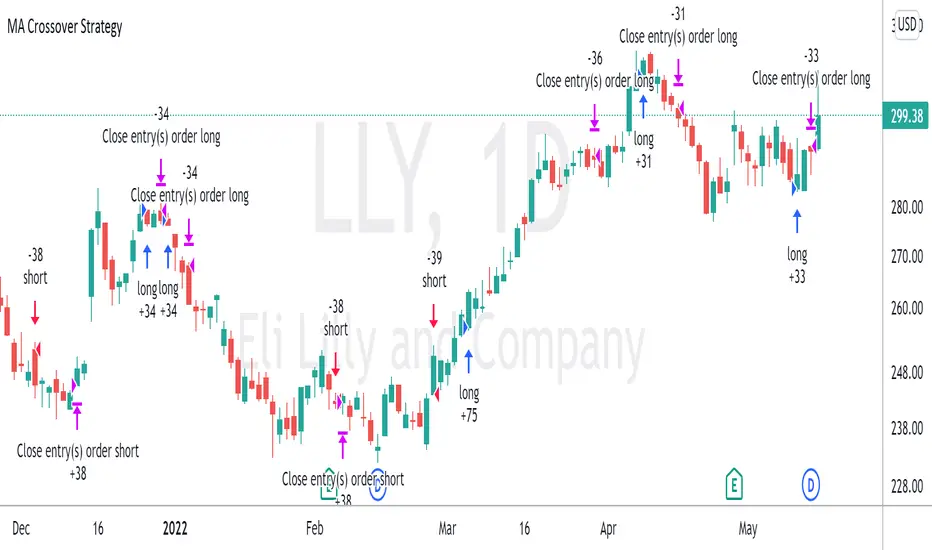
Moving Average Crossover StrategyThe Moving Average Crossover indicator uses 3 moving averages (2 simple moving averages and 1 exponential moving average ) to signal long and short opportunities based on moving average crossovers. This strategy serves as a backtest to that indicator. By taking entry and exit positions based on moving average crossovers, we are able to project profit with this script. You are given the option to select which moving average crossings trigger entry and exit signals. Fast refers to an EMA which should be your shortest MA. Slow refers to the first SMA which will serve as a signal line. Trend refers to a long SMA which will help determine if you should take long positions or short. You can also filter by extra conditions such as minimum volume or RSI. For example, you may have the script trigger a buy signal if the 5ema crosses the 20 sma while RSI reads 60 and sell if it crosses again.
This strategy starts with $100,000 and uses 10% of the account per trade.
Infiten Slope StrategyThis model is an index fund trading model, which uses moving averages and price percentage oscillators to minimize downside exposure.


Bitcoin trend RVI and Emastrategy with two emas and rvi.
Only long positions when fast ema above slow ema when rvi gives entry.
Only short positions when slow ema above fast ema when rvi gives entry.

Dillon's Double VWAP StrategyThis is based on Dillon's double VWAP strategy.
I enters when the ADX is low (aka not a trending market) and it's not close to the VWAP reset. Check it out.

AltAlgoHello Traders ,
the AltAlgo is here! – our brand new trading multitool. It is an all-in-one backtesting and alert script based on our proprietary strategy and algorithms. Including many useful customizable features.
About one year ago we published our AltTrader Scalp & Swing indicator. We made a backtester for it named AltTrader BackTester Swing&Scalp. This pair of indicator and strategy turned out to be a great success. After one year of constant development and updates, we are proud to present to you our latest AltAlgo – our newest strategy script with the ability to send alerts! No more copying inputs from strategy to indicator to set alerts. Now you will prepare a strategy and create alerts in one script. We also added some new features.
AltAlgo is a great tool that helps you find the best possible entries for your trades. It's not a limited strategy for only some timeframe periods or assets. You can use it on Crypto, Forex, Stocks, Indices, and basically any chart that is available on TradingView. It is suitable for short-term scalping, mid-term and long-term swing trading, both spot and futures.
AltAlgo combines many algorithms to provide the best possible entry for you. It uses ATR, Supertrend, many different moving averages, and our proprietary system of rules and calculations to plot an ideal BUY or SELL signal for you, across all markets.
The main features/settings of the AltAlgo include :
Specific testing period - you can specify the start and end date to backtest, also the time
Power - the main variable responsible for the AltAlgo sensitivity and the amount of signals
AltFilters - these filters aim to detect the trend and prevent sending signals when the price consolidates
Supertrend - Multi time frame implementation of the famous Supertrend filter to follow the trend direction even more
Only long / only short mode - could be useful for spot trading or to create separate strategies for longs and shorts
COOS (close on opposite signal) - you can choose for the strategy to close open trades when an opposite signal comes in or not
Breakeven - if you want the AltAlgo to move stop loss to BE on chosen take profit level
Trailing stop-loss - it uses the moving target method for trailing from a chosen take profit level
Four levels for taking a profit - separate take profit levels for long and short direction, all calculations can be set in %, pips or ATR
DCA entry - function to improve your entry price and create an entry ZONE in case the price goes in the opposite direction
MultiMA - you can choose one of the 27 moving averages added to filter signals (above MA only BUY, below MA only SELL)
Sessions - we have predefined main trading sessions (America, Europe, Asia) or you can use custom settings based on any day of the week, any hours and time zones
External filter - you can use your own script to filter signals given by the AltAlgo
Miscellaneous - long/short trade background coloring, showing peak profit, etc.
Notice alerts – AltAlgo can send you additional alerts informing you about running trade like take profit or stop loss hits, flips, etc.
External output - you can use the AltAlgo as a signal provider for your other script
Alerts - fully customizable alerts for BUY/SELL signals, supporting entry zone (DCA), automatic ticker renaming (for example BTCUSDTPERP to BTCUSDT), and the option to add top and bottom lines of free text
As you can read, the AltAlgo is packed with lots of useful features, which make it irreplaceable in your trading journey. We put all our knowledge and experience to make this tool and we hope it would be useful for you and you make a lot of profits with it.
We also have a kind, amazing and helpful community of AltAlgo users, which help each other every day and share their knowledge and setups in their trading journey.
Strategy properties used:
Initial capital - 10000
Order size - 10%
Commission - 0.04%

Crypto Correlation Strategy based on Technical Ratings This is a swing trading crypto correlation strategy, based initially on technical ratings but adapted to the entire crypto market environment , by using as a source of calculations the candle values from CRYPTOCAP:TOTAL.
So since TOTAL, is the sum of all the crypto currencies, its going to be our leader. We will get the entries and exits , internally from it and input them into the crypto coins(more than 80-90% of the usdt perpetual pairs are following the same direction but with a higher volatility), and with this in general is going to give us as much better risk/reward than just by trading 1 coin alone.
So this means that all coins will enter and exit at the same time forom a trade. With this, since sometimes we have sudden big changes in the price form one side to another, is going to break a little this effect and since the initial movements were bigger, it would make us lose less. At the same time it can also make us lose more if the changes happen to soon.
One of the things of this particular idea is we dont have to worry about particular optimizations for each asset/coin.
This scenario has been adapted for 30min timeframe, using 0.1% comission per entry and 0.1% comission for exit from the trade.
I have tested so far with most USDT Perpetual Pairs from binance, and it seems to give good results with most of the pairs.
If you have any question please let me know !

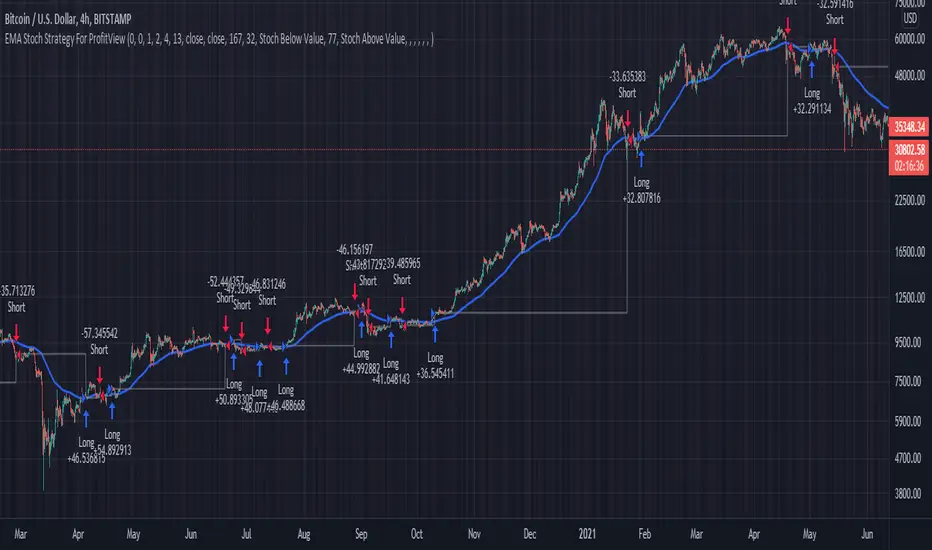
EMA Stoch Strategy For ProfitViewThis strategy will enter positions when the set stochastic conditions are met, and uses the moving average to filter the direction of the trades (long/short). The background is used to illustrate the strength of the stochastic values.
The following is a step by step guide in order to automate the trading of the strategy with ProfitView:
In the indicator settings, set the desired stochastic and ema values, and the stochastic condition you want to use to enter a trade.
In the indicator, set which exchange, symbol, and account to execute trades on.
In the indicator, set the PV Alert names you intend to use. If you want to use the same names as provided in the pastebin below, you may set the three names to Market Long, Market Short, TP SL Hit.
In PV, create two new PV Alerts in the PV Alert tab in accordance to these specifics pastebin.com .
On the Tradingview chart you want the indicator run on, create a new TV alert with this script as its condition, and specify the alert to "alert() function calls only".
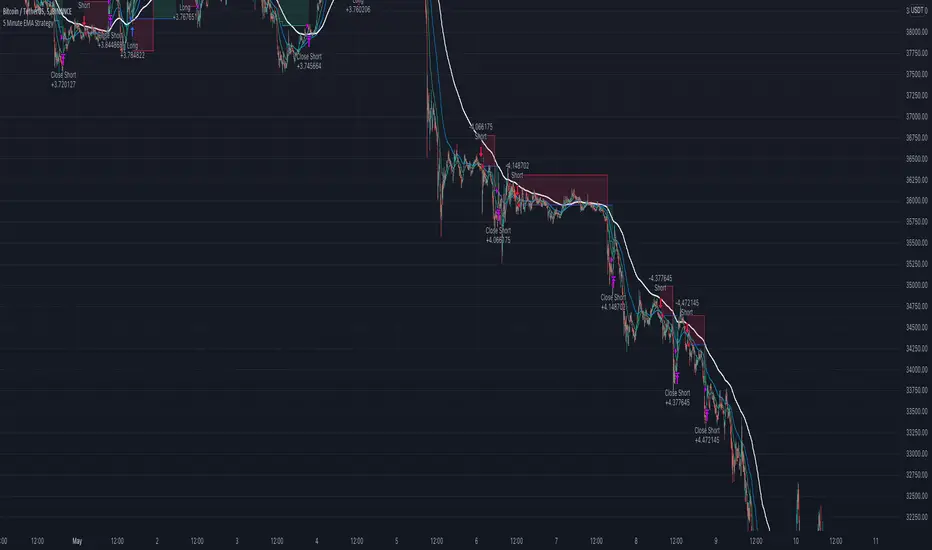
5 Minute EMA Cross StrategyThis simple Fast/Slow EMA cross strategy is designed to be used with Alertatron to place limit orders and use a trailing stop/take profit.
Features:
Indicators when the fast EMA crosses the slow EMA
Trailing Stop/Take Profit
Bar look back for placing limit order
Macro EMA filter to only trade with the macro trend
Big Snapper Alerts R3.0 + Chaiking Volatility condition + TP RSI//@version=5
//
// Bannos
// #NotTradingAdvice #DYOR
// Disclaimer.
// I AM NOT A FINANCIAL ADVISOR.
// THESE IDEAS ARE NOT ADVICE AND ARE FOR EDUCATION PURPOSES ONLY.
// ALWAYS DO YOUR OWN RESEARCH
//
// Author: Adaptation from JustUncleL Big Snapper by Bannos
// Date: May-2022
// Version: R1.0
//Description of this addon - Script using several new conditions to give Long/short and SL levels which was not proposed in the Big Snapper strategy "Big Snapper Alerts R3.0"
//"
//This strategy is based on the use of the Big Snapper outputs from the JustUncleL script and the addition of several conditions to define filtered conditions selecting signal synchrones with a trend and a rise of the volatility.
//Also the strategy proposes to define proportional stop losses and dynamic Take profit using an RSI strategy.
// After delivering the temporary ong/short signal and ploting a green or purple signal, several conditions are defined to consider a Signal is Long or short.
//Let s take the long signal as example(this is the same process with the opposite values for a short).
//step 1 - Long Definition:
// Snapper long signal stored in the buffer variable Longbuffer to say that in a close future, we could have all conditions for a long
// Now we need some conditions to combine with it:
//the second one is to be over the Ma_medium(55)
//and because this is not selective enough, the third one is a Volatility indicator "Chaikin Volatility" indicator giving an indication about the volatility of the price compared to the 10 last values
// -> Using the volatility indicator gives the possibility to increase the potential rise if the volatility is higher compared to the last periods.
//With these 3 signals, we get a robust indication about a potential long signal which is then stored in the variable "Longe"
//Now we have a long signal and can give a long signal with its Stop Loss
// The Long Signal is automatically given as the 3 conditions above are satisfied.
// The Stop loss is a function of the last Candle sizes giving a stop below the 70% of the overall candle which can be assimilated to a Fibonacci level. Below this level it makes sense to stop the trade as the chance to recover the complete Candle is more than 60%
//Now we are in an open Long and can use all the mentioned Stop loss condition but still need a Take Profit condition
//The take profit condition is based on a RSI strategy consisting in taking profit as soon as the RSI come back from the overbought area (which is here defined as a rsi over 70) and reaching the 63.5 level to trigger the Take Profit
//This TP condition is only active when Long is active and when an entry value as been defined.
//Entry and SL level appreas as soon as a Long or short arrow signal does appears. The Take profit will be conidtioned to the RSI.
//The final step in the cycle is a reinitialization of all the values giving the possibility to detect and treat any long new signal coming from the Big Snapper signal.

Solution Zigma - Fibonacci Impulse'Solution Zigma' is strategy for any securities because this strategy use EMA of Fibonacci Level and Plot Like candle easy for analysis trend impulse. This strategy used DMI(ADX) for filter sideway but not greatest indicator, Please use this strategy with Risk Management.
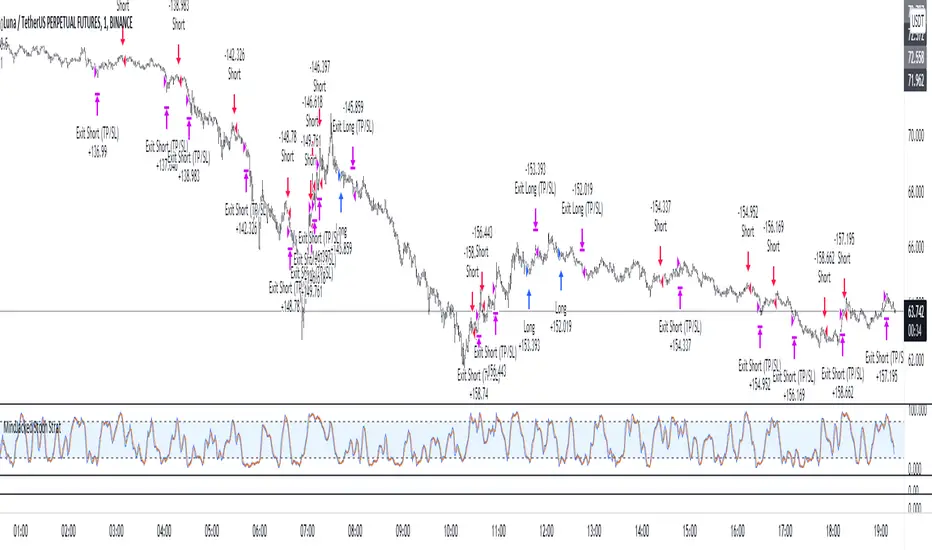
MindJacked Stoch StratAs part of the How To Trade Crypto With a Full Time Job Series, this strategy has been developed to help you with the Stoch180 method.
With this strategy, you can:
> Change up Stochastic parameters;
> Select what EMA you'd like to use, as well as open, close etc;
> Change the signal options as you wish on the oscillator;
> Choose your long or short signal types in the form of:
-----> Stoch Below or Above Value
-----> K&D Cross Above or Below Value
-----> Stoch Cross Up or Below the Value
> You can choose your Backtesting timeframe / limits
> You can change the % of your TP and SL (use this to then work out R:R values)
> You can also (as per typical) change up your base currency, units, order size, pyramiding, commissions etc
> Per typical with strategies, you can also change up the style etc as you see fit
Thanks for using it! Mindset_BTC
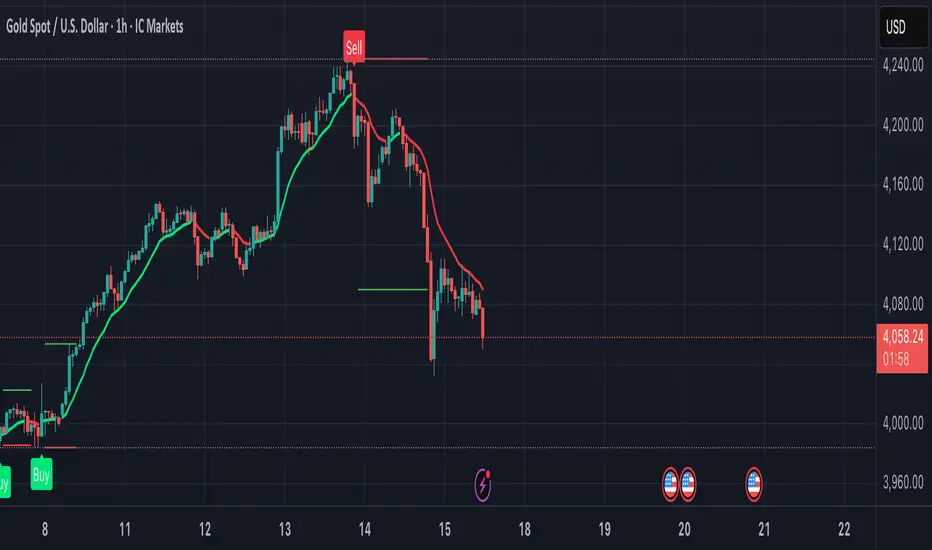
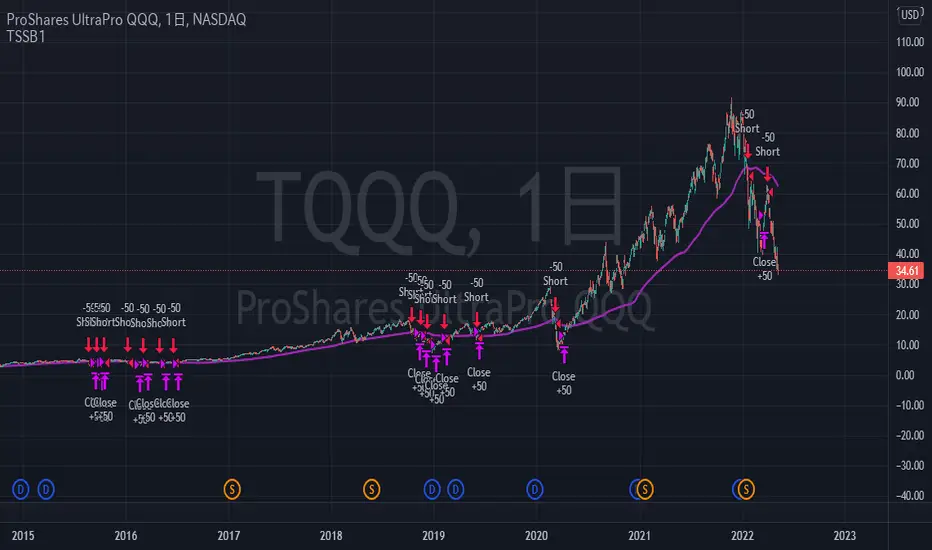
TriautoETF(TQQQ) Short Strategy B1○ Objective.
This is a strategy for the TQQQ NASDAQ:TQQQ short strategy in the TriAuto ETF .
It is used as a hedging short rather than for profit-making purposes.
Entry and close points are indicated.
○ Strategy
The strategy is to hold a short position when the price falls below the moving average line, which is a market-conscious line that is rarely broken.
The close (settlement) is determined by using the moving average.
The moving average is based on the market-conscious QQQ NASDAQ:QQQ .
This script is used on the daily chart of the TQQQ.
It works as a hedge for long positions because open interest is held even at the major bottoms of the China and Corona shocks.
The system is set up to quickly cut its losses even if the moving average is "tricked" into falling below the moving average.
Hull Suite + Stoch RSI Strategy v1.1 This strategy uses Hull Suite with Stoch RSI
Uses Hull Suite as trend and only trades with the direction of the trend.
Entry conditions:
Hull Suite as a trend
Stoch RSI overbought for short entries & oversold for long entries
Current parameters works best on BINANCE:BNBBUSDPERP pair.

Best TradingView Strategy - For NASDAQ and DOW30 and other IndexThe script is totally based on momentum , volume and price. We have used :
1: Bollinger Band Squeezes to know when a breakout might happen.
2: Used Moving Averages(SMA and EMA) to know the direction.
3: The success Rate of this strategy is above 75% and if little price action is added it can easily surpass 90% success mark.
4: Do not worry about drawdowns , we have implemented trailing SL ,so you might see a little extra drawdown but in reality its pretty less.
5: I myself have tested this strategy for 41 days with a 250$ account and right now I have 2700$.

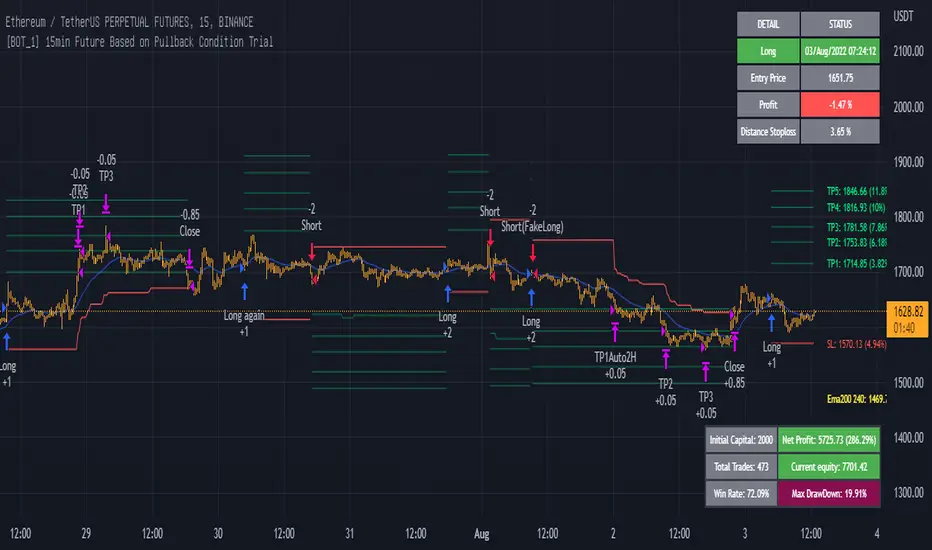
15min ETH Binance Future Full for auto tradingThe strategy is optimized for ETHBUSDPERP or ETHUSDTPERP pairs on Binance Future. With other altcoins, you need change set up of indicators.
This is a swing strategy to follow the trend on the 15m frame, use the pullback condition in the smaller timeframe to enter the trade.
Entry long: price close above ema10 and ema30, macd(12,26,9) (tf1m) < macd(12,26,9) (tf1m) and rsi < 80 (not overbought) and parabol sar is below price
Exit long: price hit TP1, TP2, ... or touch stoploss or have entry short signal
Entry short: price close below ema10 and ema30, macd(12,26,9) (tf1m) > macd(12,26,9) (tf1m) and rsi > 20 (not oversold) and parabol sar is aboce price
Exit short: price hit TP1, TP2, ... or touch stoploss or have entry long signal
In addition, the strategy also has profit risk management feature: move stoploss to entry and take multiprofit, plot resistant in higher timeframe 1D, 4H for activing take profit.
If you find any helpful for your trading and need scripts, please inbox to me.
You are welcom!
EHMA Range StrategyThis script is a modified version of @borserman's script for the Exponential Hull Moving Average
All credit for the EHMA goes to him :)
In addition to the EHMA, this script works with a range around the EHMA (which can be modified), in an attempt to be robust against fake signals. Many times a bar will close below a moving average, only to reverse again the next bar, which eats away at your profits. Especially on shorter timeframes, but also on choppy longer timeframes this can make a strategy unattractive to use.
With the range around the EHMA, the strategy only enters a long/exit-short position if a bar crosses above the upper range. Vice versa, it only enters a short/exit-long position if a bar crosses below the lower range. This avoids positions if bars behave choppy within the EHMA range & only enters a position if the market is confident in it's direction. Having said that, fakeouts are still possible, but a lot less frequent. Having backtested this strategy vs the regular EHMA strategy (and having experimented with various settings), this version seems to be a lot more robust & profitable!
Disclaimer
Please remember that past performance may not be indicative of future results.
Due to various factors, including changing market conditions, the strategy may no longer perform as good as in historical backtesting.
This post and the script don’t provide any financial advice.
