Rail Line Levels [s3]Plots support/resistance lines based on a neutral signal (white portion) of the Rail Line (variable moving average) for a period of time designated by the user (defaults to 9 bars). Support/Resistance lines will be removed after a period of tests and can be determined by the user (defaults to 26). Support/Resistance is deemed not as important or strong after several touches or tests. The trailer uses a combination of the calculation for the Rail Line (variable moving average) and an ATR to show the overall trend direction.
The indicator is centered around a Variable Moving Average. The Variable Moving Average (VMA) is a study that uses an Exponential Moving Average being able to automatically adjust its smoothing factor according to the market volatility.
In addition to the VMA, the indicator makes use of the ATR which measures market volatility by decomposing the entire range of an asset price for that period. The true range is taken as the greatest of the following: current high less the current low; the absolute value of the current high less the previous close; and the absolute value of the current low less the previous close.
Movingavarage

EMA Power Ranking [wbburgin]This is one of my favorite indicators I've developed. It measures the strength of an uptrend or a downtrend and produces signals for when that trend is weakening.
From my time trading I have learned that moving averages are not good signals to determine trend changes, because they are lagging indicators. However, we can use a moving average system - and the rates of change of the moving averages and the widths between them - to determine when the trend is changing faster than we can using the moving averages themselves. This makes moving averages super useful because we are essentially predicting mean reversal. Then, if we do the same for multiple moving averages of multiple lengths, we can have a pretty accurate perspective of when the price trend is about to reverse.
You can choose which type of MA works best for you, despite the script name. I've found that inverse volatility is the most accurate, but all of my ELMA (elastic MA) signals are also less frequent.
Calculations
The script calculates whether the differences between five moving averages of different lengths are increasing or decreasing, and if the moving averages are positioned properly compared to each other.
When looking at two moving averages, if the width between the moving averages is increasing, and the faster moving average is above the slower moving average the trend is bullish , because the price is outpacing both MA's upwards.
Vice versa, if the width between the moving averages is increasing, and the faster moving average is below the slower moving average the trend is bearish , because the price is outpacing both MA's downwards.
It's deceptively simple. The indicator flags a reversal to the downside immediately after a bullish trend loses momentum, and a reversal to the upside immediately after a bearish trend loses momentum.
Quick note: This isn't a trade setup - I strongly advise that if you are to use this indicator with any strategy, you make sure that there is a stop loss and possibly stop sell as well. The indicator is great at predicting trend reversions, but also falls prey to continuations of both downtrends and uptrends. Best for use in oscillating markets.
Quick note 2: Forgot to mention the precision factor, which goes from 0 (default) to 2. Each step up uses an additional moving average for greater accuracy (i.e. when they are coordinated in a bullish trend, bearish trend, etc.).

Ratio Smoothed, Volume Weighted Moving AverageThis is experimental moving average doesn't use a period/length but instead buffers the price per share and transfers that price per share at a given ratio per bar while also releasing the previous values at a decay ratio.
The idea is that volume is the engine by which the price moves but spikes in volume can cause noise. By having a buffer of price per share units, this VWMA style indicator can behave more like a WMA combined with volume (VAWMA) but smooths out the noise of recent volume. The end result is a price movement that is smooth but also still based strongly up on the average price per share and will always eventually catch up to the true price per share value.
A metaphor to understand this could be a bucket with a hole in it where water is flowing sporadically into the bucket. The level of water in the bucket may change drastically but instead of all the water emptying out immediately, it is throttled by the hole in the bottom. As the level rises, the water pressure increases and the flow increases so that the virtual bucket never has a chance to fill up but also never really empties either.

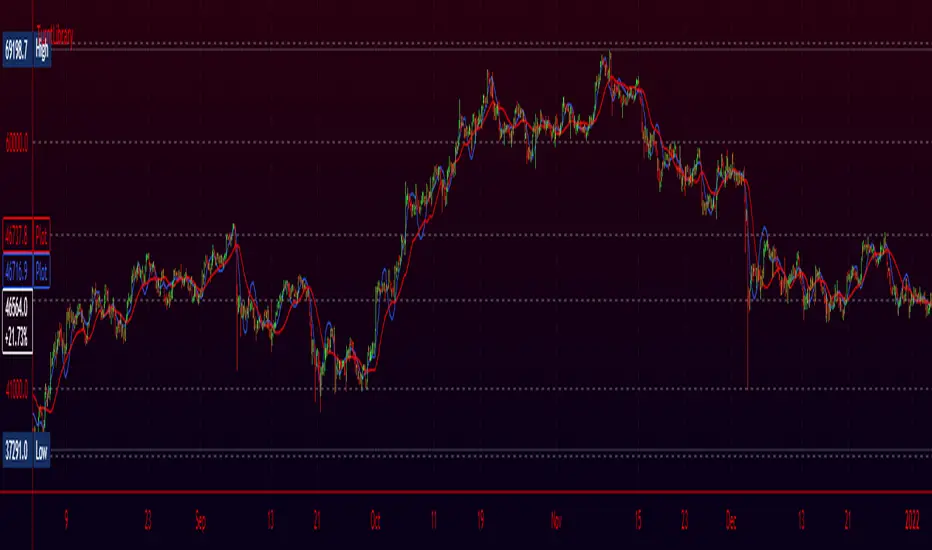
TurntLibraryLibrary "TurntLibrary"
Collection of functions created for simplification/easy referencing. Includes variations of moving averages, length value oscillators, and a few other simple functions based upon HH/LL values.
ma(source, length, type)
Apply a moving average to a float value
Parameters:
source : Value to be used
length : Number of bars to include in calculation
type : Moving average type to use ("SMA","EMA","RMA","WMA","VWAP","SWMA","LRC")
Returns: Smoothed value of initial float value
curve(src, len, lb1, lb2)
Exaggerates curves of a float value designed for use as an exit signal.
Parameters:
src : Initial value to curve
len : Number of bars to include in calculation
lb1 : (Default = 1) First lookback length
lb2 : (Default = 2) Second lookback length
Returns: Curved Average
fragma(src, len, space, str)
Average of a moving average and the previous value of the moving average
Parameters:
src : Initial float value to use
len : Number of bars to include in calculation
space : Lookback integer for second half of average
str : Moving average type to use ("SMA","EMA","RMA","WMA","VWAP","SWMA","LRC")
Returns: Fragmented Average
maxmin(x, y)
Difference of 2 float values, subtracting the lowest from the highest
Parameters:
x : Value 1
y : Value 2
Returns: The +Difference between 2 float values
oscLen(val, type)
Variable Length using a oscillator value and a corresponding slope shape ("Incline",Decline","Peak","Trough")
Parameters:
val : Oscillator Value to use
type : Slope of length curve ("Incline",Decline","Peak","Trough")
Returns: Variable Length Integer
hlAverage(val, smooth, max, min, type, include)
Average of HH,LL with variable lengths based on the slope shape ("Incline","Decline","Trough") value relative to highest and lowest
Parameters:
val : Source Value to use
smooth
max
min
type
include : Add "val" to the averaging process, instead of more weight to highest or lowest value
Returns: Variable Length Average of Highest Lowest "val"
pct(val)
Convert a positive float / price to a percentage of it's highest value on record
Parameters:
val : Value To convert to a percentage of it's highest value ever
Returns: Percentage
hlrange(x, len)
Difference between Highest High and Lowest Low of float value
Parameters:
x : Value to use in calculation
len : Number of bars to include in calculation
Returns: Difference
midpoint(x, len, smooth)
The average value of the float's Highest High and Lowest Low in a number of bars
Parameters:
x : Value to use in calculation
len
smooth : (Default=na) Optional smoothing type to use ("SMA","EMA","RMA","WMA","VWAP","SWMA","LRC")
Returns: Midpoint
Ghost Ninja Moving Average by HassonyaThe Ghost Ninja Moving Average indicator contains three ema averages. These are ema 21, ema 55 and ema 233.
The values of the averages appearing on the screen are adjusted according to their own lengths. If you want, you can change the settings from the "Numbers of bars back" setting.
The 1st moving average (EMA-21) will follow the price and will disappear if the price is above it. It will only appear where needed.
The 2nd moving average (EMA-55) will be red if not orange when EMA-21 is greater than EMA-55.
The 3rd moving average (EMA-233) will appear if EMA-55 is greater than it, otherwise it will not.
The system will also display Golden and Death crosses.
I hope you will be satisfied using it. Yours sincerely. Happy Trading
TÜRKÇE AÇIKLAMA
Ghost Ninja Hareketli Ortalama indikatörü, üç adet ema ortalaması barındırıyor. Bunlar ema 21, ema 55 ve ema 233 tür.
Ortalamaların ekranda gözükme değerleri, kendi uzunluklarına göre ayarlanmıştır. İsterseniz ayarları "Numbers of bars back" ayarından değiştirebilirsiniz.
1nci hareketli ortalama olan (EMA-21), fiyatı izleyerek eğer fiyat onun üzerindeyse gözükecek değilse yok olacak. Sadece gerektiği yerlerde gözükecek.
2nci hareketli ortalama(EMA-55), EMA-21 EMA-55'ten büyük olduğunda turuncu değilse kırmızı olacak.
3ncü hareketli ortalama(EMA-233), Eğer EMA-55 ondan büyükse gözükecek yoksa gözükmeyecek.
Sistem aynı zamanda Golden ve Death crossları da gösterecek.
Güle güle kullanın. Bereket bulun. Sevgiler

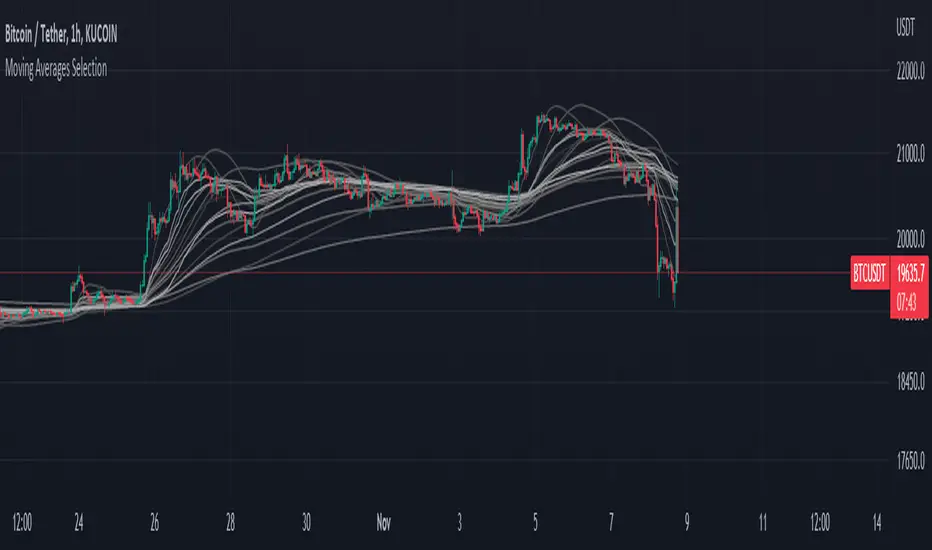
Moving Averages SelectionHello everyone, I present my first script. In it I collect a group of fully configurable moving averages, both in color, value and selection of the ones we want to observe.
The moving averages I collect are 3 of each of the following types:
EMA: An exponential moving average ( EMA ) is a type of moving average (MA) that places a greater weight and significance on the most recent data points.
SMA: It is simply the average price over the specified period. The average is called "moving" because it is plotted on the chart bar by bar, forming a line that moves along the chart as the average value changes.
HMA: The Hull Moving Average ( HMA ) attempts to minimize the lag of a traditional moving average while retaining the smoothness of the moving average line. Developed by Alan Hull in 2005, this indicator makes use of weighted moving averages to prioritize more recent values and greatly reduce lag.
RMA: The Rolling Moving Average, sometimes referred to as "Smoothed Moving Average", gives the recent prices most weighting, though the historic prices are also weighted, each given less weighting further back in time.
WMA: The weighted moving average ( WMA ) is a technical indicator that traders use to generate trade direction and make a buy or sell decision. It assigns greater weighting to recent data points and less weighting on past data points.
I am open to any opinion and advice for improvement, greetings, I hope you find it useful :)
Rolling MACDThis indicator displays a Rolling Moving Average Convergence Divergence . Contrary to MACD indicators which use a fix time segment, RMACD calculates using a moving window defined by a time period (not a simple number of bars), so it shows better results.
This indicator is inspired by and use the Close & Inventory Bar Retracement Price Line to create an MACD in different timeframes.
█ CONCEPTS
If you are not already familiar with MACD, so look at Help Center will get you started www.tradingview.com
The typical MACD, short for moving average convergence/divergence, is a trading indicator used in technical analysis of stock prices, created by Gerald Appel in the late 1970s. It is designed to reveal changes in the strength, direction, momentum, and duration of a trend in a stock's price.
The MACD indicator(or "oscillator") is a collection of three time series calculated from historical price data, most often the closing price. These three series are: the MACD series proper, the "signal" or "average" series, and the "divergence" series which is the difference between the two. The MACD series is the difference between a "fast" (short period) exponential moving average (EMA), and a "slow" (longer period) EMA of the price series. The average series is an EMA of the MACD series itself.
Because RMACD uses a moving window, it does not exhibit the jumpiness of MACD plots. You can see the more jagged MACD on the chart above. I think both can be useful to traders; up to you to decide which flavor works for you.
█ HOW TO USE IT
Load the indicator on an active chart (see the Help Center if you don't know how).
Time period
By default, the script uses an auto-stepping mechanism to adjust the time period of its moving window to the chart's timeframe. The following table shows chart timeframes and the corresponding time period used by the script. When the chart's timeframe is less than or equal to the timeframe in the first column, the second column's time period is used to calculate RMACD:
Chart Time
timeframe period
1min 🠆 1H
5min 🠆 4H
1H 🠆 1D
4H 🠆 3D
12H 🠆 1W
1D 🠆 1M
1W 🠆 3M
You can use the script's inputs to specify a fixed time period, which you can express in any combination of days, hours and minutes.
By default, the time period currently used is displayed in the lower-right corner of the chart. The script's inputs allow you to hide the display or change its size and location.
Minimum Window Size
This input field determines the minimum number of values to keep in the moving window, even if these values are outside the prescribed time period. This mitigates situations where a large time gap between two bars would cause the time window to be empty, which can occur in non-24x7 markets where large time gaps may separate contiguous chart bars, namely across holidays or trading sessions. For example, if you were using a 1D time period and there is a two-day gap between two bars, then no chart bars would fit in the moving window after the gap. The default value is 10 bars.
//
This indicator should make trading easier and improve analysis. Nothing is worse than indicators that give confusingly different signals.
I hope you enjoy my new ideas
best regards
Chervolino

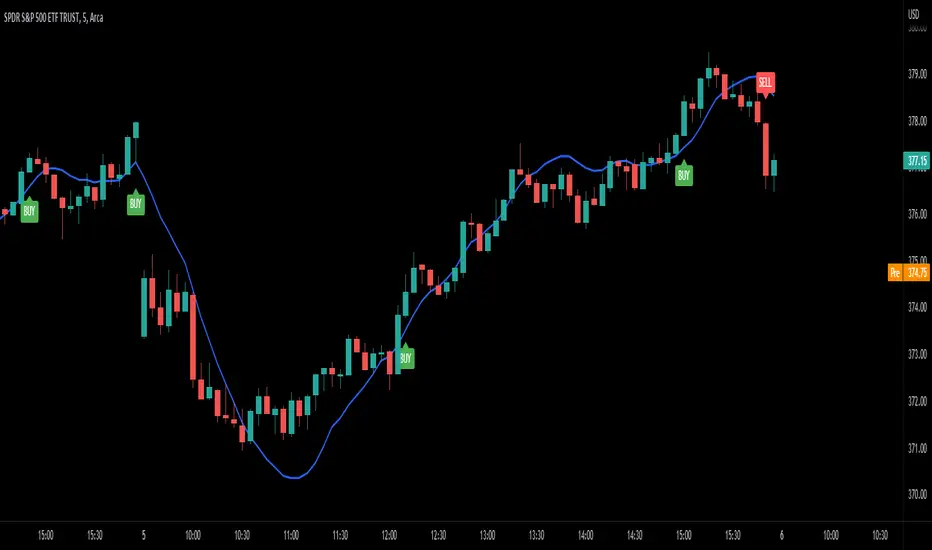
Channel SurfingThis is my Channel Surfing indicator. It fires Buy and Sell signals based on multiple conditions. You can use EMAs or LSMAs. You will have to check the box of which moving averages to use once you add it to the chart. It plots EMAs or LSMAs using the different sources Close, Low, and High as the channel to surf. It fires a Buy signal if price crosses the channel up and if there is a pullback into the channel followed by a breakout to the upside. It fires a Sell signal if price crosses the channel down and if there is a pullback into the channel followed buy a breakdown to the down side. I find it works great on the 5 minute SPY chart and the 1 minute chart of ES with the default settings when scalping. You are able to switch between 2 different channels using LSMAs or EMAs. The EMAs has an optional LSMA slope filter for getting rid of some false signals. Let me know if you guys find any other settings or ways to use this and as always I hope it helps.

Olympus MonsThis is the Olympus Mons indicator. It uses Braid Filter, LSMA, and Hawkeye Volume to fire Buy and Sell signals. I use this on the 5 Min. SPY chart to play 1 point scalp targets with options. I have been able to get a pretty consistent win rate using it like this. The default settings are what I use. Hope it helps any of you guys. Let me know if you see any settings that are better.
Nadaraya-Watson: Rational Quadratic Kernel (Non-Repainting)What is Nadaraya–Watson Regression?
Nadaraya–Watson Regression is a type of Kernel Regression, which is a non-parametric method for estimating the curve of best fit for a dataset. Unlike Linear Regression or Polynomial Regression, Kernel Regression does not assume any underlying distribution of the data. For estimation, it uses a kernel function, which is a weighting function that assigns a weight to each data point based on how close it is to the current point. The computed weights are then used to calculate the weighted average of the data points.
How is this different from using a Moving Average?
A Simple Moving Average is actually a special type of Kernel Regression that uses a Uniform (Retangular) Kernel function. This means that all data points in the specified lookback window are weighted equally. In contrast, the Rational Quadratic Kernel function used in this indicator assigns a higher weight to data points that are closer to the current point. This means that the indicator will react more quickly to changes in the data.
Why use the Rational Quadratic Kernel over the Gaussian Kernel?
The Gaussian Kernel is one of the most commonly used Kernel functions and is used extensively in many Machine Learning algorithms due to its general applicability across a wide variety of datasets. The Rational Quadratic Kernel can be thought of as a Gaussian Kernel on steroids; it is equivalent to adding together many Gaussian Kernels of differing length scales. This allows the user even more freedom to tune the indicator to their specific needs.
The formula for the Rational Quadratic function is:
K(x, x') = (1 + ||x - x'||^2 / (2 * alpha * h^2))^(-alpha)
where x and x' data are points, alpha is a hyperparameter that controls the smoothness (i.e. overall "wiggle") of the curve, and h is the band length of the kernel.
Does this Indicator Repaint?
No, this indicator has been intentionally designed to NOT repaint. This means that once a bar has closed, the indicator will never change the values in its plot. This is useful for backtesting and for trading strategies that require a non-repainting indicator.
Settings:
Bandwidth. This is the number of bars that the indicator will use as a lookback window.
Relative Weighting Parameter. The alpha parameter for the Rational Quadratic Kernel function. This is a hyperparameter that controls the smoothness of the curve. A lower value of alpha will result in a smoother, more stretched-out curve, while a lower value will result in a more wiggly curve with a tighter fit to the data. As this parameter approaches 0, the longer time frames will exert more influence on the estimation, and as it approaches infinity, the curve will become identical to the one produced by the Gaussian Kernel.
Color Smoothing. Toggles the mechanism for coloring the estimation plot between rate of change and cross over modes.

[MAD] Multi-MA MTFThis is a simple
3 times
EMA, SMA, WMA, HMA , Timeframe
selector which can send the above below to the multimit system to daisychain trends in

OHLC Moving AverageThis indicator shows 4 moving averages of Open, High, Low and Close at the same time with an option to select SMA or EMA.
If you implement this indicator twice, you can make it look like the following chart.
One set of MA(red) is for current timeframe and another set(blue) is for higher timeframe, which is to identify potential support and resistance zones.
--------------------------
四本値(始値、高値、安値、終値)それぞれの移動平均線を同時に表示することのできるインジケーターです。
MAタイプはSMAかEMAを選択することができます。
このインジケーターを二つセットすると以下のように上位足の移動平均線とセットで表示することも可能です。
(赤がチャートの時間軸の4本値の移動平均線、青が上位足の4本値の移動平均線)
上位足の移動平均線をサポート・レジスタンスのゾーンとして捉える時などに活用できます。

Percent above or Below Moving Average Candle colourFilter:
If green candle is 'x' % above moving average than colour of candle is turn in blue colour.
If red candle is 'x' % below moving average than colour of candle is turn in orange colour.

Aarika Trade with the Trend (ATT)Hello traders, purpose of creating this indicator is simply trying to analyse the trend of any symbol.
This indicator is a modification-version of three different indicators from different authors, brought together to create a fine-piece of trend-finder.
This is combination of multi MAs to notice price action with different parameters and calculations.
This indicator generate Green/Red/Yellow bars once all the calculations comes to certain point.
This indicator can be used on any script like Indices, Stocks, Future, Currency & Crypto.
How to trade : This indicator is easy to use on any timeframe and on normal candlestick. Bar colour appeared on candle is based on some calculation and when all the condition are matched; so wait for full candle to be formed and once candle close then go for trade.
Rule for Long trade: Let the current candle form completely. If its a Green colour bar then it indicates a bullish momentum whereas Yellow bar may see a reversal of the current trend.
Rule for Short trade: Let the current candle form completely. If its a Red colour bar then it indicates a bearish momentum whereas Yellow bar may see a reversal of the current trend.
This is not a Holy Grail indicator which always gives profit but if you practice this indicator with consistency, your portfolio may give good returns.
Use proper money management before taking any trade. Go for paper trade and observe how this indicator behaves and once satisfied then only take real trade.
Add - on Feature : we have added HAMA in this indicator. Usually if HAMA is forming Green colour candles then it is a strong bullish trend, whereas Red HAMA candles show bearish trend.
Moreover, if our bar colours are Green and price is above HAMA, it usually shows strong Bull trend; and opposite side Red colour bars with price below HAMA may be seen as a strong Bear trend.
Disclaimer: Please make sure you study this indicator on different timeframes because inserted set of data may act differently on different scripts and may vary from timeframe to timeframe.
We advice you to use this indicator for trend-analysis and study purpose only. Author/publisher of this indicator is not responsible for your profit or loss if you use this indicator for trading purpose one way or another.
N.B.: We do not recommend using HeikinAshi charting for this particular indicator as the data inputs may behave differently than expected. If you have any query, you may comment below.

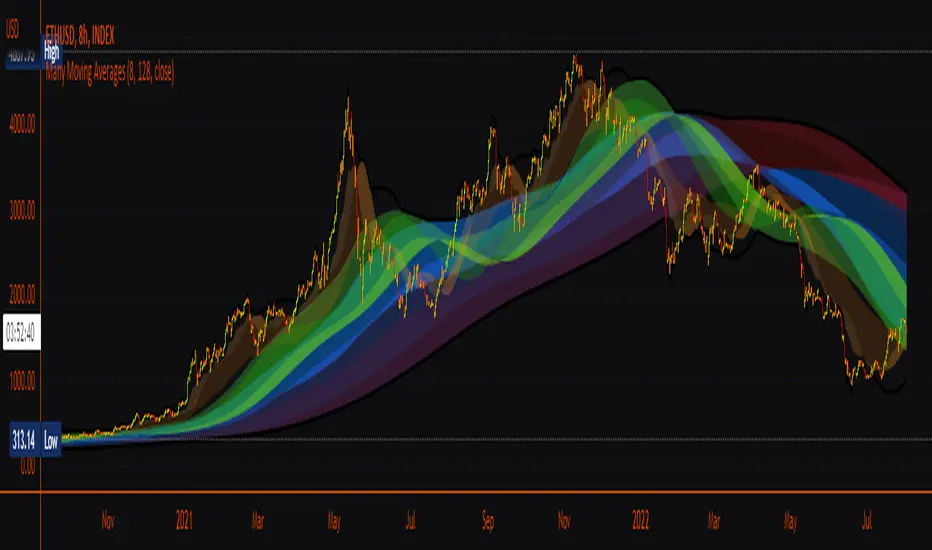
Many Moving AveragesA smooth looking indicator created from a mix of ALMA and LRC curves. Includes alternative calculation for both which I came up with through trial and error so a variety of combinations work to varying degrees. Just something I was playing around with that looked pretty nice in the end.
Candle Strength IndicatorThe candle strength indicator depicts the average strength of the price action by evaluating bullish vs bearish candles.
The scale is relative to price fluctuation and the size of the candles for the particular ticker / market, so there are no significant levels.
A cross on the zero line would generally indicate a change in trend / sentiment.
This indicator may be useful as a filter for entries and use in confluence with other indicators.

LNL Pullback ArrowsBuying the dip has never been easier! LNL Pullback Arrows are here to pinpoint the best possible entries for the trend following setups. With the Pullback Arrows, trader can pick his own approach and risk level thanks to four different types of arrows. The goal of these arrows is to force the traders to scale in & out of trades which is in my opinion crucial when it comes to trend following strategies. These arrows were designed primarily for the daily & weekly time frame (swing trading).
Four Types of Pullback Arrows:
1. Aggro Arrows - Ideal for aggresive approach during parabolic trends. Sometimes trends are so strong that the price barely revisits the daily 8 EMA. This is where the aggro arrows can perfectly pinpoint the aggresive high risk entries. Ideal for halfsize or 1/4 size of the full position. Aiming for quick 1-2 day moves targeting the recent high/low. These arrows could be also named as scalping arrows for the swing traders. A quick In & Out.
2. HalfSize Arrows - Medium risk approach. First arrows to scale in. HalfSize arrows are the first sign that the pullback might be ending, yet there is still some space left for an even deeper pullback. That is the reason why they are called half-size. Ideally taken with half-sized position. When trading the HalfSize Arrows, It is better to have some "spare ammo in the gun" ready to use.
3. FullSize Arrows - Regular risk approach. These arrows represent a zone where the core of the posititon should be taken. The point of validity for the trend is not that far away, meaning the risk can be kept tight. Ideal for scailing the other halfs or quarters of the full position. Also great for more conservative traders or environments with higher volatility.
4. Rare Arrows - Offer the best risk to reward entries during the trend. Rare Arrows should be the "last kick" of the retracement, therefore stops can be positioned really tight. They either trigger the stop immidiately or they provide another juicy leg up or down in the direction of the trend. However, they really do appear rarely.
Simple EMA Cloud:
A simple cloud based on 21 and 55 exponential moving averages. This default length creates a pullback zone that is wide enough for the conservative traders but also give the opportunities to more aggresive traders. Alternatives such as 8 & 21, or 21 & 34 are forming the zone that is too aggresive and usually too thin. Of course, cloud can be fully adjusted or turned off completely. The only role of the cloud is to gauge the trend.
Tips & Tricks:
1.Importance of the Scailing
- As already stated, scailing is crucial to this since there is no way of knowing the exact level at which the price magically bounce every time. It is hard to tell where and which EMA will be respected. How can we know it will be 21 EMA every time? or 34 EMA or 10 EMA or 100 SMA or 50 DMA ... Single MA does not make a trend. This is the reason why scailing is so important. Scailing can make a difference.
2. Nothing is Perfect
- Same as any other study, nothing works 100% perfectly. Sometimes the setup will go right against you and sometimes the price will fade away sideways and breaks off the structure of the trend. This is not a magic certainty tool. This is just another probability tool.
3. Point of Validity & Other Studies
- Even though the pullback arrows can be a stand-alone strategy. It is important to use other indicators that visualize the actual trend. Whether its EMA Cloud or EMAs or DMI Bars or Keltner Channels, there should be something that validates the trend, something that tells the trend is over. (Pullback Arrows are not showing the actual stops!).
Hope it helps.

DATE and ATR20 for practice using kojiro_indicatorsThis is an indicator to display ATR20, EMA100 of ATR20 and date at a glance for trade practices using kojiro_indicaotrs.
This will allow you to easily perform your practices.
Please change the period of EMA and the display interval and size of the indicator as needed.
Please enter small, normal, large, huge, or auto for the size.
The following is in Japanese.
小次郎講師のインジケーターでプラクティスする際に、
ATR、日付を見やすくするためのインジケーターです。
サイズや間隔を変更可能です。サイズはnormal、normal、large、huge、autoを入力してください。

Two MA Signal IndicatorThis Signal Indicator that emits a signal based on two MAs crossover/crossunder. It is designed to be used as an External Input for "Template Trailing Strategy" to verify the correctness of the External Deal Condition Mode of the aforementioned script and the Internal Strategy logic. Also, this script is a simple example on how to create custom signal indicators that can be "pugged" to the "Template Trailing Strategy" and get all the features this strategy script can provide!
Multiple MAs + No Trend Zone + ATR WidgetThis is my first Pine Script attempt. Nothing special, just an "all in one" for the most common things I use, and what I have found to be the most common in a lot of strategies.
Great for free and limited accounts as it combines 7 total indicators into one.
-- First 5 indicators are Independant Moving Averages:
-Each one can be set for length, as well as source and type (SMA, EMA, SMMA, WMA, VWMA) individually
-- Second type (6th) of indicator is one I find extremly useful for staying OUT of consolidation trading. It's called a "No Trend Zone" indicator I swipped from the Hoffman Startegy. Basically, its set for a small deviation (0.5) of a 35 EMA, which creates a "Band" around the 35 line. When you have this "Band" flat or with no discernable incline/decline, with price action OR some or multiple moving averages inside this banded zone, it typically indicates a zone of consolidation. This will help you identify when you may be in one of those zones, that way you don't get trapped "waiting for paint to dry" before the market starts to move again with your position, and keep you from entering should you be considering the market at that time.
The last indicator is my favorite, and one I will refine a little deeper soon.
-- The ATR widget finishes us out. This widget can be customized for colors, turned on or off, and automatically rounds the ATR (ATR period based on the chart timeframe) to a nice readable number for what you're trading. It has settings to show or not, the length, what rounding style to use (forex pip 0.0001, forex/stock/etf/indicies 0.01) where to show it on the pane, a Multiplier Factor (for stop loss calculations automatically) and the colors.
***NOTE ABOUT ATR WIDGET:
I am primarily a forex trader, so the defaults are for Forex 0.0001. If you see some odd numbers (like 55798 on a current chart), check the inputs tab on the settings, and change the "ATR Style" from "Forex 0.0001" to "Forex/Stock/ETF/Indicies 0.01", and you should arrive with the correct number.

LS Volatility Index█ OVERVIEW
This indicator serves to measure the volatility of the price in relation to the average.
It serves four purposes:
1. Identify abnormal prices, extremely stretched in relation to an average;
2. Identify acceptable prices in the context of the main trend;
3. Identify market crashes;
4. Identify divergences.
█ CONCEPTS
The LS Volatility Index was originally described by Brazilian traders Alexandre Wolwacz (Stormer) , Fabrício Lorenz , and Fábio Figueiredo (Vlad)
Basically, this indicator can be used in two ways:
1. In a mean reversion strategy , when there is an unusual distance from it;
2. In a trend following strategy , when the price is in an acceptable region.
Perhaps the version presented here may have some slight differences, but the core is the same.
The original indicator is presented with a 21-period moving average, but here this value is customizable.
I made some fine tuning available, namely:
1. The possibility of smoothing the indicator;
2. Choose the type of moving average;
3. Customizable period;
4. Possibility to show a moving average of the indicator;
5. Color customization.
█ CALCULATION
First, the distance of the price from a given average in percentage terms is measured.
Then, the historical average volatility is obtained.
Finally the indicator is calculated through the ratio between the distance and the historical volatility.
To facilitate visualization, the result is normalized in a range from 0 to 100.
When it reaches 0, it means the price is on average.
When it hits 100, it means the price is way off average (stretched).
█ HOW TO USE IT
Here are some examples:
1. In a return-to-average strategy
2. In a trend following strategy
3. Identification of crashes and divergences
█ THANKS AND CREDITS
- Alexandre Wolwacz (Stormer), Fabrício Lorenz, Fábio Figueiredo (Vlad)
- Feature scaler (for normalization)
- HPotter (for calc of Historical Volatility)

SVA - Simple Volume Analyzer, by BlueJayBird [bjb] ENGLISH & SPANISH
------------------------------------- ENSLIGH
The idea was initially inspired in the concepts shared by @LazyBear on his indicator "Better Volume Indicator" (). But I found it somewhat complicated and dull. So I came up with this.
Concept:
It changes the color of volume bars based on surrounding volume changes.
Volume changes are plotted as volume MAs lines in the volume pane.
Whenever the volume is higher than these MAs, the bar changes color.
For this reason, the bar color change is RELATIVE TO the surroundings, because the color change depends on how far the MA has been extended due to sudden (or not) changes in the volume.
BAR COLORS:
Weak Green and Red: Low volume. The calm before or after the storm.
Normal Green and Red: Mid volume. Still low volume, you may get bored.
Yellow: High volume. Players are playing hard and harder.
White: Ultra-High Volume. The elephants stepped in.
NOTES:
SVA works better at lower timeframes. Though as far as I can tell, it works pretty well as far as 1D timeframe.
------------------------------------- SPANISH
La idea estuvo inicialmente inspirada en los conceptos expuestos por @LazyBear en su indicador "Better Volume Indicator" (). Pero lo encontré un poco complicado y falto de claridad. Así que me inventé este.
Conceptp:
Cambia el color de las barras basándose en los últimos cambios de volumen.
Los cambios de volumen son ploteados como lineas de medias móviles (MAs, es decir "Moving Averages") en la sección del volumen (chart pane).
En cualquier momento que el volumen es mayor que estos MAs, el color de las barras cambia.
Por esta razon, el cambio de color de las barras es RELATIVO a lo que está sucediendo alrededor, ya que el cambio de color depende de qué tan lejos el MA se haya extendido por causa de los últimos cambios (o no) de volumen.
BAR COLORS:
Verde y rojo apagados: Volumen bajo (Low Volume). La calma antes de la tormenta.
Verde y rojo normales: Volumen medio (Mid volume). Volumen todavía bajo. Es posible que te aburras.
Amarillo: Volumen alto (High Volume). Los jugadores están jugando duro.
Blanco: Volumen ultra-alto (Ultra-High Volume). Los elefantes entran a la cancha.
NOTAS:
SVA funciona mejor en temporalidades menores. Pero por lo que he visto, funciona bien hasta la temporalidad de 1D.

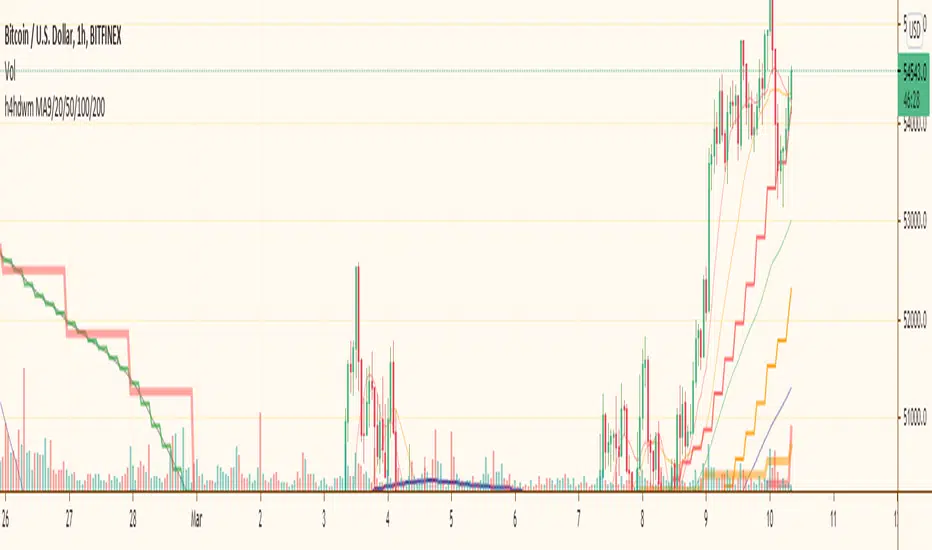
h4hdwm (updated)I put most importand moving avarages for most importand time frames together. When you whatching a graph you are sometimes missing another time frime very importand moving avarage and there is a reaction on price. with this multi time frame multi ma indicator you can see all of them at once. it makes a little mass if you let all of them together. so you might close some of them.
Bigger time frames Moving Avarages has ticker lines and bigger steps.