Daily 12/21 EMA OverlayDaily 12/21 EMA Overlay
This indicator projects the daily 12 and 21 EMAs onto any timeframe as a soft, semi-transparent band. It is designed to give a constant higher-timeframe bias and dynamic support/resistance reference while you execute your systems on lower timeframes (4H, 1H, 15m, etc.).
The script uses request.security() to calculate the 12/21 EMAs on the daily chart only, then overlays those values on your current timeframe without recalculating them locally. This means the band always represents the true daily 12/21 EMAs, regardless of the chart you are viewing.
Key Features:
Fixed daily 12/21 EMA band, visible on all timeframes
Faded lines and fill to keep focus on your active intraday tools
Simple, minimal inputs (fast length, slow length, colors, band visibility)
Ideal as a higher-timeframe “backdrop” for systems built around EMA trend, rejections, or liquidity sweeps
How to Use
Add the indicator on any symbol and timeframe
Keep your normal intraday EMAs (e.g., EMA 12/21) for execution
Note: You can change the bands to not just be 12 or 21, you can change them if needed for your own systems or emas that you use.
This tool is intentionally lightweight: it does one job—showing the true daily EMA structure across all timeframes—and leaves trade execution logic to your primary system.
Moving_average

Damo's Custom EMA Bands 1.0I was making these manually for a long time. They just give me more peace of mind when I'm using EMAs. They feel more like a net catching price. These are easy to make. All they are is 3 EMAs with the Source at High, Low and (H+L)/2 for the midpoint.
I find on a 3-Day chart on BTC the 100 EMA is great for telling what trend we're are in.
i.postimg.cc
HybridWhales DAY TRADINGThis indicator offers a streamlined view of prevailing market trends on lower timeframes, empowering day traders to execute their strategies with greater precision
It incorporates two widely used exponential moving averages (EMAs)—the 50-period and 200-period—alongside an 800-period EMA, which effectively mirrors the 200-period EMA on the next higher timeframe. This setup provides enhanced flexibility, delivering multi-timeframe insights without the need to switch charts manually.
In addition, the indicator highlights essential intraday levels for quick reference:
Daily Open, denoted in yellow
Monday Highs, marked in red
Monday Lows, indicated in green
The indicator's core strength lies in its ability to detect market maker activity through color-coded candlesticks, based on volume analysis. Candles exhibiting significantly higher volume than the average of the prior eight candles are colored green (for bullish closes) or red (for bearish closes), signaling active market maker positioning—either entering shorts or longs.
Candles with moderately elevated volume (above average but not extreme) are shaded blue (bullish) or pink (bearish), suggesting market makers are accumulating short or long positions.
Interpretation is key: Red or pink candles (bearish) imply that market makers have initiated long positions, with price likely to revisit and fill these areas in the future. Conversely, green or blue candles (bullish) indicate market makers establishing shorts, anticipating a eventual pullback to these levels
To pinpoint the precise zones where price may return, the indicator places a white marker on each colored candle at its 50% retracement level, representing a fair value gap or imbalance.
Overall, this tool enables traders to spot market maker footprints, identify critical support and resistance zones, gauge weekly ranges, and assess potential momentum. While it fosters stronger confluence in analysis, results are not guaranteed and depend on individual trading execution.

TNT TRADER EMA FANEMA fan of 8 20 50 200, very simple and straight forward with color change options.

Lorentzian Length Adaptive Moving Average [LLAMA] Adaptation of "Machine Learning: Lorentzian Classification" by
Gradient color by base on work by
LLAMA: A regime-aware adaptive moving average that bends with the market.
Start with a problem traders know:
Traditional moving averages are either too slow (EMA200) or too fast (EMA9)
Adaptive MAs exist, but they often hug price too tightly or smooth too much, failing to balance bias and tactics
LLAMA uses a Lorentzian distance function to adapt its length dynamically. Instead of a fixed smoothing window, it stretches or contracts depending on market conditions. This distortion reduces lag while still providing a clear bias line.
The indicator looks back at recent bars and measures how similar they are using a Lorentzian distance (a log‑scaled absolute difference). It keeps track of the “nearest neighbors” — bars that most resemble the current regime. Each neighbor carries a label (long, short, neutral) based on simple price comparisons. By averaging these labels, LLAMA predicts whether the market is leaning bullish or bearish. That prediction is then mapped into a dynamic length between and .
Bullish bias -> length stretches toward max (smoother, more stable).
Bearish bias -> length contracts toward min (snappier, more reactive).
During breakouts, LLAMA tightens and comes into contact with bars, giving actionable signals. During chop, it stretches to avoid false triggers. It covers both ends of the spectrum (bias and tactics) in one line, something static MA's can't do.
Think of LLAMA as a lens that bends with the market:
Wide lens (max length) for big picture bias.
Narrow lens (min length) for tactical precision.
The "Lorentzian Loop" is the math that decides when to widen or narrow.

Rons Custom WatermarkRon's Custom Watermark (RCW)
This is a lightweight, all-in-one watermark indicator that displays essential fundamental and technical data directly on your chart. It's designed to give you a quick, at-a-glance overview of any asset without cluttering your screen.
Features
The watermark displays the following information in a clean table:
* Company Info: Full Name & Market Cap (e.g., "AST SpaceMobile, Inc. (18.85B)")
* Symbol & Timeframe: Ticker and current chart period (e.g., "ASTS, 1D")
* Sector & Industry: The asset's classification.
* Technical Status (MA): Shows if the price is Above or Below the SMA (with a 🟢/🔴 emoji).
* Technical Status (EMA): Shows if the price is Above or Below the EMA (with a 🟢/🔴 emoji).
* Earnings: A countdown showing "X days remaining" until the next earnings report.
* (Optional) Volatility: The 14-day ATR value and its percentage of the current price.

MA SMART Angle
### 📊 WHAT IS MA SMART ANGLE?
**MA SMART Angle** is an advanced momentum and trend detection indicator that analyzes the angles (slopes) of multiple moving averages to generate clear, non-repainting BUY and SELL signals.
**Original Concept Credit:** This indicator builds upon the "MA Angles" concept originally created by **JD** (also known as Duyck). The core angle calculation methodology and Jurik Moving Average (JMA) implementation by **Everget** are preserved from the original open-source work. The angle calculation formula was contributed by **KyJ**. This enhanced version is published with respect to the open-source nature of the original indicator.
Original indicator reference: "ma angles - JD" by Duyck
---
## 🎯 ORIGINALITY & VALUE PROPOSITION
### **What Makes This Different from the Original:**
While the original "MA Angles" by **JD** provided excellent angle visualization, it lacked actionable entry signals. **MA SMART Angle** addresses this by adding:
**1. Clear Entry/Exit Signals**
- Explicit BUY/SELL arrows based on angle crossovers, momentum confirmation, and MA alignment
- No guessing when to enter trades - the indicator tells you exactly when conditions align
**2. Non-Repainting Logic**
- All signals use confirmed historical data (shifted by 2 bars minimum)
- Critical for backtesting reliability and live trading confidence
- Original indicator could repaint signals on current bar
**3. Dual Signal System**
- **Simple Mode:** More frequent signals based on angle crossovers + momentum (for active traders)
- **Strict Mode:** Requires full multi-MA alignment + momentum confirmation (for conservative traders)
- Adaptable to different trading styles and risk tolerances
**4. Smart Signal Filtering**
- **Anti-spam cooldown:** Prevents duplicate signals within configurable bar count
- **No-trade zone detection:** Filters out low-conviction sideways markets automatically
- **Multi-timeframe MA alignment:** Ensures all moving averages agree on direction before signaling
**5. Enhanced Visualization**
- Large, clear BUY/SELL arrows with descriptive labels
- Color-coded backgrounds for market states (trending vs. ranging)
- Momentum histogram showing acceleration/deceleration in real-time
- Live status table displaying trend strength, angle value, momentum, and MA alignment
**6. Professional Alert System**
- Four distinct alert conditions: BUY Signal, SELL Signal, Strong BUY, Strong SELL
- Enables automated trade notifications and strategy integration
**7. Modified MA Periods**
- Original used EMA(27), EMA(83), EMA(278)
- Enhanced version uses faster EMA(3), EMA(8), EMA(13) for more responsive signals
- Better suited for modern volatile markets and shorter timeframes
---
## 📐 HOW IT WORKS - TECHNICAL EXPLANATION
### **Core Methodology:**
The indicator calculates angles (slopes) for five key moving averages:
- **JMA (Jurik Moving Average)** - Smooth, lag-reduced trend line (original implementation by **Everget**)
- **JMA Fast** - Responsive momentum indicator with higher power parameter
- **MA27 (EMA 3)** - Primary fast-moving average for signal generation
- **MA83 (EMA 8)** - Medium-term trend confirmation
- **MA278 (EMA 13)** - Slower trend filter
### **Angle Calculation Formula (by KyJ):**
```
angle = arctan((MA - MA ) / ATR(14)) × (180 / π)
```
**Why ATR normalization?**
- Makes angles comparable across different instruments (forex, stocks, crypto)
- Makes angles comparable across different timeframes
- Accounts for volatility - a 10-point move in different assets has different significance
**Angle Interpretation:**
- **> 15°** = Strong trend (momentum accelerating)
- **0° to 15°** = Weak trend (momentum present but moderate)
- **-2° to +2°** = No-trade zone (sideways/choppy market)
- **< -15°** = Strong downtrend
### **Signal Generation Logic:**
#### **BUY Signal Conditions:**
1. MA27 angle crosses above 0° (upward momentum initiates)
2. All three EMAs (3, 8, 13) pointing upward (trend alignment confirmed)
3. Momentum is positive for 2+ bars (acceleration, not deceleration)
4. Angle exceeds minimum threshold (not in no-trade zone)
5. Cooldown period passed (prevents signal spam)
#### **SELL Signal Conditions:**
1. MA27 angle crosses below 0° (downward momentum initiates)
2. All three EMAs pointing downward (downtrend alignment)
3. Momentum is negative for 2+ bars
4. Angle below negative threshold (not in no-trade zone)
5. Cooldown period passed
#### **Strong BUY+ / SELL+ Signals:**
Additional entry opportunities when JMA Fast crosses JMA Slow while maintaining strong directional angle - indicates momentum acceleration within established trend.
---
## 🔧 HOW TO USE
### **Recommended Settings by Trading Style:**
**Scalpers / Day Traders:**
- Signal Type: **Simple**
- Minimum Angle: **3-5°**
- Cooldown Bars: **3-5 bars**
- Timeframes: 1m, 5m, 15m
**Swing Traders:**
- Signal Type: **Strict**
- Minimum Angle: **7-10°**
- Cooldown Bars: **8-12 bars**
- Timeframes: 1H, 4H, Daily
**Position Traders:**
- Signal Type: **Strict**
- Minimum Angle: **10-15°**
- Cooldown Bars: **15-20 bars**
- Timeframes: Daily, Weekly
### **Parameter Descriptions:**
**1. Source** (default: OHLC4)
- Price data used for MA calculations
- OHLC4 provides smoothest angles
- Close is more responsive but noisier
**2. Threshold for No-Trade Zones** (default: 2°)
- Angles below this are considered sideways/ranging
- Increase for stricter filtering of choppy markets
- Decrease to allow signals in quieter trending periods
**3. Signal Type** (Simple vs. Strict)
- **Simple:** Angle crossover OR (trend + momentum)
- **Strict:** Angle crossover AND all MAs aligned AND momentum confirmed
- Start with Simple, switch to Strict if too many false signals
**4. Minimum Angle for Signal** (default: 5°)
- Only generate signals when angle exceeds this threshold
- Higher values = stronger trends required
- Lower values = more sensitive to momentum changes
**5. Cooldown Bars** (default: 5)
- Minimum bars between consecutive signals
- Prevents spam during volatile chop
- Scale with your timeframe (higher TF = more bars)
**6. Color Bars** (default: true)
- Colors chart bars based on signal state
- Green = bullish conditions, Red = bearish conditions
- Can disable if you prefer clean price bars
**7. Background Colors**
- **Yellow background** = No-trade zone (low angle, ranging market)
- **Green flash** = BUY signal generated
- **Red flash** = SELL signal generated
- All customizable or can be disabled
---
## 📊 INTERPRETING THE INDICATOR
### **Visual Elements:**
**Main Chart Window:**
- **Thick Lime/Fuchsia Line** = MA27 angle (primary signal line)
- **Medium Green/Red Line** = MA83 angle (trend confirmation)
- **Thin Green/Red Line** = MA278 angle (slow trend filter)
- **Aqua/Orange Line** = JMA Fast (momentum detector)
- **Green/Red Area** = JMA slope (overall trend context)
- **Blue/Purple Histogram** = Momentum (angle acceleration/deceleration)
**Signal Arrows:**
- **Large Green ▲ "BUY"** = Primary buy signal (all conditions met)
- **Small Green ▲ "BUY+"** = Strong momentum buy (JMA fast cross)
- **Large Red ▼ "SELL"** = Primary sell signal (all conditions met)
- **Small Red ▼ "SELL+"** = Strong momentum sell (JMA fast cross)
**Status Table (Top Right):**
- **Angle:** Current MA27 angle in degrees
- **Trend:** Classification (STRONG UP/DOWN, UP/DOWN, FLAT)
- **Momentum:** Acceleration state (ACCEL UP/DN, Up/Down)
- **MAs:** Alignment status (ALL UP/DOWN, Mixed)
- **Zone:** Trading zone status (ACTIVE vs. NO TRADE)
- **Last:** Bars since last signal
### **Trading Strategies:**
**Strategy 1: Pure Signal Following**
- Enter LONG on BUY signal
- Exit on SELL signal
- Use stop-loss at recent swing low/high
- Works best on trending instruments
**Strategy 2: Confirmation with Price Action**
- Wait for BUY signal + bullish candlestick pattern
- Wait for SELL signal + bearish candlestick pattern
- Increases win rate by filtering premature signals
- Recommended for beginners
**Strategy 3: Momentum Acceleration**
- Use BUY+/SELL+ signals for adding to positions
- Only take these in direction of primary signal
- Scalp quick moves during momentum spikes
- For experienced traders
**Strategy 4: Mean Reversion in No-Trade Zones**
- When status shows "NO TRADE", fade extremes
- Wait for angle to exit no-trade zone for reversal
- Contrarian approach for range-bound markets
- Requires tight stops
---
## ⚠️ LIMITATIONS & DISCLAIMERS
**What This Indicator DOES:**
✅ Measures momentum direction and strength via angle analysis
✅ Generates signals when multiple conditions align
✅ Filters out low-conviction sideways markets
✅ Provides visual clarity on trend state
**What This Indicator DOES NOT:**
❌ Predict future price movements with certainty
❌ Guarantee profitable trades (no indicator can)
❌ Work equally well on all instruments/timeframes
❌ Replace proper risk management and position sizing
**Known Limitations:**
- **Lagging Nature:** Like all moving averages, signals occur after momentum begins
- **Whipsaw Risk:** Can generate false signals in volatile, directionless markets
- **Optimization Required:** Parameters need adjustment for different assets
- **Not a Complete System:** Should be combined with risk management, position sizing, and other analysis
**Best Performance Conditions:**
- Strong trending markets (crypto bull runs, stock breakouts)
- Liquid instruments (major forex pairs, large-cap stocks)
- Appropriate timeframe selection (match to trading style)
- Used alongside support/resistance and volume analysis
---
## 🔔 ALERT SETUP
The indicator includes four alert conditions:
**1. BUY SIGNAL**
- Message: "MA SMART Angle: BUY SIGNAL! Angle crossed up with momentum"
- Use for: Primary long entries
**2. SELL SIGNAL**
- Message: "MA SMART Angle: SELL SIGNAL! Angle crossed down with momentum"
- Use for: Primary short entries or long exits
**3. Strong BUY**
- Message: "MA SMART Angle: Strong BUY momentum - JMA fast crossed up"
- Use for: Adding to longs or aggressive entries
**4. Strong SELL**
- Message: "MA SMART Angle: Strong SELL momentum - JMA fast crossed down"
- Use for: Adding to shorts or aggressive exits
**Setting Up Alerts:**
1. Right-click indicator → "Add Alert on MA SMART Angle"
2. Select desired condition from dropdown
3. Choose notification method (popup, email, webhook)
4. Set alert expiration (typically "Once Per Bar Close")
---
## 📚 EDUCATIONAL VALUE
This indicator serves as an excellent learning tool for understanding:
**1. Angle-Based Momentum Analysis**
- Traditional indicators show MA crossovers
- This shows the *rate of change* (velocity) of MAs
- Teaches traders to think in terms of momentum acceleration
**2. Multi-Timeframe Confirmation**
- Shows how fast, medium, and slow MAs interact
- Demonstrates importance of trend alignment
- Helps develop patience for high-probability setups
**3. Signal Quality vs. Quantity Tradeoff**
- Simple mode = more signals, more noise
- Strict mode = fewer signals, higher quality
- Teaches discretionary filtering skills
**4. Market State Recognition**
- Visual distinction between trending and ranging markets
- Helps traders avoid trading choppy conditions
- Develops "market context" awareness
---
## 🔄 DIFFERENCES FROM OTHER MA INDICATORS
**vs. Traditional MA Crossovers:**
- Measures momentum (angle) rather than just price crossing MA
- Provides earlier signals as angles change before price crosses
- Filters better for sideways markets using no-trade zones
**vs. MACD:**
- Uses multiple MAs instead of just two
- ATR normalization makes it universal across instruments
- Visual angle representation more intuitive than histogram
**vs. Supertrend:**
- Not based on ATR bands but on MA slope analysis
- Provides graduated strength indication (not just binary trend)
- Less prone to whipsaw in low volatility
**vs. Original "MA Angles" by JD:**
- Adds explicit entry/exit signals (original had none)
- Implements no-repaint logic for reliability
- Includes signal filtering and quality controls
- Provides dual signal systems (Simple/Strict)
- Enhanced visualization and status monitoring
- Uses faster MA periods (3/8/13 vs 27/83/278) for modern markets
---
## 📖 CODE STRUCTURE (for Pine Script learners)
This indicator demonstrates:
**Advanced Pine Script Techniques:**
- Custom function implementation (JMA, angle calculation)
- Var declarations for stateful tracking
- Table creation for HUD display
- Multi-condition signal logic
- Alert system integration
- Proper use of historical references for no-repaint
**Code Organization:**
- Modular function definitions (JMA, angle)
- Clear separation of concerns (inputs, calculations, plotting, alerts)
- Extensive commenting for maintainability
- Best practices for Pine Script v5
**Learning Resources:**
- Study the JMA function to understand adaptive smoothing
- Examine angle calculation for ATR normalization technique
- Review signal logic for multi-condition confirmation patterns
- Analyze anti-spam filtering for state management
The code is open-source - feel free to study, modify, and improve upon it!
---
## 🙏 CREDITS & ATTRIBUTION
**Original Concepts:**
- **"ma angles - JD" by JD (Duyck)** - Core angle calculation methodology and indicator concept
Original open-source indicator on TradingView Community Scripts
- **JMA (Jurik Moving Average) implementation by Everget** - Smooth, low-lag moving average function
Acknowledged in original JD indicator code
- **Angle Calculation formula by KyJ** - Mathematical formula for converting MA slope to degrees using ATR normalization
Acknowledged in original JD indicator code comments
**Enhancements in This Version:**
- Signal generation logic - Original implementation for this indicator
- No-repaint confirmation system - Original implementation
- Dual signal modes (Simple/Strict) - Original implementation
- Visual enhancements and status table - Original implementation
- Alert system and signal filtering - Original implementation
- Modified MA periods (3/8/13 instead of 27/83/278) - Optimization for modern markets
**Open Source Philosophy:**
This indicator follows the open-source spirit of TradingView and the Pine Script community. The original "ma angles - JD" by JD (Duyck) was published as open-source, enabling this enhanced version. Similarly, this code is published as open-source to allow further community improvements.
---
## ⚡ QUICK START GUIDE
**For New Users:**
1. Add indicator to chart
2. Start with default settings (Simple mode)
3. Wait for BUY signal (green arrow)
4. Observe how price behaves after signal
5. Check status table to understand market state
6. Adjust parameters based on your instrument/timeframe
**For Experienced Traders:**
1. Switch to Strict mode for higher quality signals
2. Increase cooldown bars to reduce frequency
3. Raise minimum angle threshold for stronger trends
4. Combine with your existing strategy for confirmation
5. Set up alerts for desired signal types
6. Backtest on your preferred instruments
---
## 🎓 RECOMMENDED COMBINATIONS
**Works Well With:**
- **Volume Analysis:** Confirm signals with volume spikes
- **Support/Resistance:** Take signals near key levels
- **RSI/Stochastic:** Avoid overbought/oversold extremes
- **ATR:** Size positions based on volatility
- **Price Action:** Wait for candlestick confirmation
**Complementary Indicators:**
- Order Flow / Footprint (for institutional confirmation)
- Volume Profile (for identifying value areas)
- VWAP (for intraday mean reversion reference)
- Fibonacci Retracements (for target setting)
---
## 📈 PERFORMANCE EXPECTATIONS
**Realistic Win Rates:**
- Simple Mode: 45-55% (higher frequency, moderate accuracy)
- Strict Mode: 55-65% (lower frequency, higher accuracy)
- Combined with price action: 60-70%
**Best Asset Classes:**
1. **Cryptocurrencies** (strong trends, clear signals)
2. **Forex Major Pairs** (smooth price action, good angles)
3. **Large-Cap Stocks** (trending behavior, liquid)
4. **Index Futures** (trending instruments)
**Challenging Conditions:**
- Low volatility consolidation periods
- News-driven erratic movements
- Thin/illiquid instruments
- Counter-trending markets
---
## 🛡️ RISK DISCLAIMER
**IMPORTANT LEGAL NOTICE:**
This indicator is for **educational and informational purposes only**. It is **NOT financial advice** and does not constitute a recommendation to buy or sell any financial instrument.
**Trading Risks:**
- Trading carries substantial risk of loss
- Past performance does not guarantee future results
- No indicator can predict market movements with certainty
- You can lose more than your initial investment (especially with leverage)
**User Responsibilities:**
- Conduct your own research and due diligence
- Understand the instruments you trade
- Never risk more than you can afford to lose
- Use proper position sizing and risk management
- Consider consulting a licensed financial advisor
**Indicator Limitations:**
- Signals are based on historical data only
- No guarantee of accuracy or profitability
- Parameters must be optimized for your specific use case
- Results vary significantly by market conditions
By using this indicator, you acknowledge and accept all trading risks. The author is not responsible for any financial losses incurred through use of this indicator.
---
## 📧 SUPPORT & FEEDBACK
**Found a bug?** Please report it in the comments with:
- Chart symbol and timeframe
- Parameter settings used
- Description of unexpected behavior
- Screenshot if possible
**Have suggestions?** Share your ideas for improvements!
**Enjoying the indicator?** Leave a like and follow for updates!

SMAs+EMA20 [AAK]The SMAs+EMA20 indicator plots five SMAs (20/50/100/150/200) plus a reactive EMA20 on a single chart.
Use it to gauge trend direction, multi-horizon support/resistance, and short-term momentum with EMA20.
Features:
• Toggle visibility for each MA
• Custom colors, line width
Developed by AAK — clarity, simplicity, precision.

SuperTrend Dual RMAOverview
The SuperTrend Dual RMA is a hybrid volatility-based trend-following system that merges two Relative Moving Averages (RMAs) with an Average True Range (ATR)–anchored SuperTrend framework. The primary purpose of this indicator is to offer a smoother and more reliable depiction of directional bias while maintaining sensitivity to price volatility and market volume.
Traditional SuperTrend implementations typically rely on a single moving average and a fixed volatility envelope. This dual RMA structure introduces an adaptive central tendency line that reacts proportionally to both price and volume, allowing for more nuanced identification of trend reversals and continuation patterns.
**Core Concept**
The indicator is built around two key principles — smoothing and volatility adaptation.
1. **Smoothing:** The use of two separate RMAs with configurable lengths creates a dynamic equilibrium between short-term responsiveness and long-term stability. The first RMA captures near-term directional shifts, while the second provides broader market context. The average of both becomes the foundation of the SuperTrend bands.
2. **Volatility Adaptation:** The ATR multiplier and period define the distance between upper and lower bands relative to recent volatility. This ensures that the SuperTrend line remains flexible across varying market conditions — expanding during high volatility and contracting during calm phases.
**Calculation Steps**
* The indicator first computes two volume-weighted RMAs based on the typical price (`hlc3`) multiplied by trading volume.
* Each RMA is normalized by the smoothed volume to maintain proportional weighting.
* These two RMAs are averaged to produce a “basis line” that reflects the current market consensus price.
* The ATR is calculated over a user-defined period, then multiplied by a volatility factor (ATR multiplier).
* The resulting ATR value defines dynamic upper and lower thresholds around the basis line.
* Trend direction is determined by price closing behavior relative to these thresholds:
* When the closing price exceeds the upper band, the trend is considered bullish.
* When it drops below the lower band, the trend turns bearish.
* If price remains within the bands, the prior trend direction is maintained for consistency.
**Visual Structure**
The SuperTrend Dual RMA provides multiple layers of visual feedback for enhanced interpretation:
* Two distinct RMA lines (short and long) are plotted with complementary colors for contrast and clarity.
* A soft fill between the RMA lines highlights the interaction between short- and medium-term momentum.
* The ATR-based SuperTrend bands are drawn above and below the basis, with adaptive coloring that corresponds to the prevailing trend direction.
* Bar colors automatically adjust to reflect bullish or bearish bias, making it easy to identify trend shifts without relying solely on crossovers.
* Optional triangle markers appear below or above bars to signal potential buy or sell opportunities based on crossover logic.
**Signals and Alerts**
The indicator provides real-time crossover detection:
* **Buy Signal:** Triggered when the closing price moves above the SuperTrend line, confirming potential bullish continuation or reversal.
* **Sell Signal:** Triggered when the closing price drops below the SuperTrend line, indicating possible bearish momentum or reversal.
Both conditions have built-in `alertcondition()` functions, allowing users to set automated alerts for trading or monitoring purposes. This enables integration with TradingView’s alert system for push notifications, emails, or webhook connections.
**Usage Guidelines**
* **Trend Identification:** Use the color-coded trend line and bar color as a visual guide to the current directional bias.
* **Entry and Exit Timing:** Consider entering trades when a new crossover alert appears, preferably in the direction of the overall higher-timeframe trend.
* **Parameter Tuning:** Adjust the RMA lengths and ATR parameters based on asset volatility. Shorter RMA and ATR settings provide faster reactions, suitable for intraday or high-frequency trading, while longer configurations better fit swing or position strategies.
* **Risk Management:** Because the SuperTrend inherently acts as a dynamic stop level, traders can use the opposite band or SuperTrend line as a trailing stop or exit signal.
**Practical Applications**
* Trend confirmation in multi-timeframe strategies.
* Adaptive trailing stop placement using the lower or upper band.
* Visual comparison of volume-weighted price movement against volatility envelopes.
* Integration into algorithmic trading systems as a signal filter or trend bias component.
* Identification of overextended conditions when price significantly diverges from the SuperTrend basis.
**Originality and Advantages**
The SuperTrend Dual RMA differentiates itself from conventional SuperTrend scripts through three innovative design choices:
1. **Dual Volume-Weighted RMAs:** By incorporating two RMAs weighted by trading volume, the indicator accounts for liquidity dynamics, producing smoother and more reliable averages compared to price-only calculations.
2. **Anchored SuperTrend Framework:** The SuperTrend bands are not derived from a fixed source (such as a single close or median price) but from a blended RMA basis, making them more adaptable to varying market behaviors.
3. **Integrated Multi-Layer Visualization:** The inclusion of filled regions between RMAs, dynamic band coloring, and bar tinting enhances readability and analytical depth without overwhelming the chart.
These improvements collectively create a more balanced and data-rich representation of market structure, offering a higher degree of analytical precision. It’s suitable for traders seeking both discretionary and systematic use, as the indicator’s logic is transparent and compatible with alert-based or automated workflows.
**Summary**
The SuperTrend Dual RMA is a refined evolution of the classic SuperTrend, optimized for traders who value smoother directional tracking and more intelligent volatility adaptation. It blends two time-sensitive, volume-aware moving averages with an ATR-derived volatility system to deliver reliable, actionable trend information. Its visual design, adaptive responsiveness, and integrated alert functionality make it a complete solution for identifying and managing trends across multiple asset classes and timeframes.

MechArt Moving Average and % Above V1.1MechArt Moving Average and % Above V1.1
Unlock the power of custom analysis with this Adjustable Moving Average Indicator! Whether you're a day trader, swing trader, or long-term investor, this tool helps you track price action with precision and flexibility. Tailor your trading strategy to your needs by adjusting the type of moving average, price triggers, and percentage levels.
🔑 Key Features:
Choose Your Moving Average Type 🌀
Select from four popular moving averages:
SMA (Simple Moving Average)
EMA (Exponential Moving Average)
WMA (Weighted Moving Average)
VWMA (Volume Weighted Moving Average)
Find the one that best fits your trading style!
Adjustable Trigger Price
Choose between four price types to trigger signals:
Open
High
Low
Close
Pick the price type that makes the most sense for your strategy!
Percentage Above the Moving Average 📈🔽
Set a custom percentage above the moving average to generate alerts when the price reaches key levels.
Customizable Alerts 🔔
Get notified when the price is above the target price or below the moving average. Perfect for timely trades!
📉 Visual Alerts:
🔴 Red Background: When the selected price is above the target price (percentage above the moving average).
🟩 Green Background: When the selected price is below the moving average.
🚀 How This Indicator Helps You:
Precision 🎯: Visual signals with clear red and green backgrounds help you make quick decisions based on the price's relationship to your moving average.
Flexibility 🔄: Customize the type of moving average and the price used for triggers to fit your trading style.
📊 Perfect For:
Swing Traders 📈: Use the indicator to identify price trends and reversals based on moving averages.
Day Traders ⏳: Set short-term percentage levels to catch immediate price movements.
Long-Term Investors 💼: Track longer-term trends and set alerts when prices deviate significantly from your moving average.
Take control of your trading strategy with this Adjustable Moving Average Indicator and start making more informed decisions today! 🏅
Change from V1.0: Fixed Timeframe setting to match chart.

MechArt Moving Average and % Above V1.0MechArt Moving Average and % Above V1.0
Unlock the power of custom analysis with this Adjustable Moving Average Indicator! Whether you're a day trader, swing trader, or long-term investor, this tool helps you track price action with precision and flexibility. Tailor your trading strategy to your needs by adjusting the type of moving average, price triggers, and percentage levels.
🔑 Key Features:
Choose Your Moving Average Type 🌀
Select from four popular moving averages:
SMA (Simple Moving Average)
EMA (Exponential Moving Average)
WMA (Weighted Moving Average)
VWMA (Volume Weighted Moving Average)
Find the one that best fits your trading style!
Adjustable Trigger Price
Choose between four price types to trigger signals:
Open
High
Low
Close
Pick the price type that makes the most sense for your strategy!
Percentage Above the Moving Average 📈🔽
Set a custom percentage above the moving average to generate alerts when the price reaches key levels.
Customizable Alerts 🔔
Get notified when the price is above the target price or below the moving average. Perfect for timely trades!
📉 Visual Alerts:
🔴 Red Background: When the selected price is above the target price (percentage above the moving average).
🟩 Green Background: When the selected price is below the moving average.
📅 Adjustable Timeframe:
Choose the timeframe that suits you! Whether you're trading on a 1-minute chart, 1-hour, 1-day, or 1-week, this indicator works for all timeframes.
🚀 How This Indicator Helps You:
Precision 🎯: Visual signals with clear red and green backgrounds help you make quick decisions based on the price's relationship to your moving average.
Flexibility 🔄: Customize the type of moving average and the price used for triggers to fit your trading style.
📊 Perfect For:
Swing Traders 📈: Use the indicator to identify price trends and reversals based on moving averages.
Day Traders ⏳: Set short-term percentage levels to catch immediate price movements.
Long-Term Investors 💼: Track longer-term trends and set alerts when prices deviate significantly from your moving average.
Take control of your trading strategy with this Adjustable Moving Average Indicator and start making more informed decisions today! 🏅

ADX Trend Strength Filter + TRAMA [DotGain]Summary
Are you tired of trading trend signals, only to get stopped out in volatile, sideways chop?
The ADX Trend Strength Filter (ADX TSF) is designed to solve this exact problem. It is a comprehensive trend-following system that only generates signals when a trend not only has the right direction and momentum, but also sufficient strength.
This indicator filters out weak or indecisive market phases (the "chop") and will only color the bars Green or Red when all conditions for a strong, confirmed trend are met.
⚙️ Core Components and Logic
The ADX TSF relies on a triple-filter logic to generate a clear trade signal:
Trend Filter (TRAMA): A TRAMA (Trending Adaptive Moving Average) is used as the main trendline. This adaptive average automatically adjusts to market volatility, acting as a dynamic support/resistance level.
Price > TRAMA = Bullish
Price < TRAMA = Bearish
Momentum Filter (RSI Crossover): Momentum is measured by a crossover of two moving averages of the RSI (a fast EMA and a slow SMA). This confirms whether the momentum is pointing in the same direction as the trend.
Strength Filter (ADX): This is the most important filter. A signal is only considered valid if the ADX (Average Directional Index) is above a defined threshold (Default: 30). This ensures the trend has sufficient strength.
🚦 How to Read the Indicator
The indicator has three states, displayed directly as bar colors on your chart:
🟩 GREEN BARS (Strong Uptrend) All three conditions are met:
Price is above the TRAMA.
RSI momentum is bullish (Fast MA > Slow MA).
ADX is above 30 (Strong trend is present).
🟥 RED BARS (Strong Downtrend) All three conditions are met:
Price is below the TRAMA.
RSI momentum is bearish (Fast MA < Slow MA).
ADX is above 30 (Strong trend is present).
🟧 ORANGE BARS (Neutral / Caution) This state appears if any of the following conditions are true:
Weak Trend: The ADX is below 30. The market is in consolidation or a sideways phase. (This is the primary filter!)
Indecision: The price is caught in the "Neutral Zone" between the TRAMA and the 200 SMA.
Visual Elements
Bar Colors: (Green/Red/Orange) Show the current trend status.
TRAMA (Orange Line): Your primary adaptive trendline.
200 SMA (White Line): Serves as a reference for the long-term trend.
Orange Background (Fill): Fills the area between the TRAMA and SMA to visually highlight the "Neutral Zone."
Key Benefit
The goal of the ADX TSF is to keep traders out of weak, unpredictable markets and help them participate only in strong, momentum-confirmed trends.
Have fun :)
Disclaimer
This "Buy The F*cking Dip" (BTFD) indicator is provided for informational and educational purposes only. It does not, and should not be construed as, financial, investment, or trading advice.
The signals generated by this tool (both "Buy" and "Sell") are the result of a specific set of algorithmic conditions. They are not a direct recommendation to buy or sell any asset. All trading and investing in financial markets involves substantial risk of loss. You can lose all of your invested capital.
Past performance is not indicative of future results. The signals generated may produce false or losing trades. The creator (© DotGain) assumes no liability for any financial losses or damages you may incur as a result of using this indicator.
You are solely responsible for your own trading and investment decisions. Always conduct your own research (DYOR) and consider your personal risk tolerance before making any trades.

Cloud and Table - Ostinato TradingMain indicator of Ostinato Trading, the moving averages cloud and table. You can superpose various moving averages, bollinger bands and their color fill. Additionaly the table is used to plot the distance from the price to moving averages, the ATR value, the stop loss ... You can also plot a bulls eyes of SL and TP in points to visualise it on the chart.

Close Below MAClose Below MA (SMA or EMA)
This indicator helps traders quickly identify when a candle closes below a moving average — a classic signal of potential bearish momentum or a shift in trend.
You can choose between Simple Moving Average (SMA) or Exponential Moving Average (EMA) from a convenient dropdown menu, and customize the MA length to fit your strategy.
When a candle closes below the selected MA, a small black arrow appears above the bar, and an alert can be triggered for instant notifications.
Features:
Choose between SMA or EMA.
Adjustable MA length.
Visual signal (arrow) when the close is below the selected MA.
Built-in alert support
Usage Ideas:
Spot early signs of a bearish reversal.
Use alerts for automated trade monitoring.

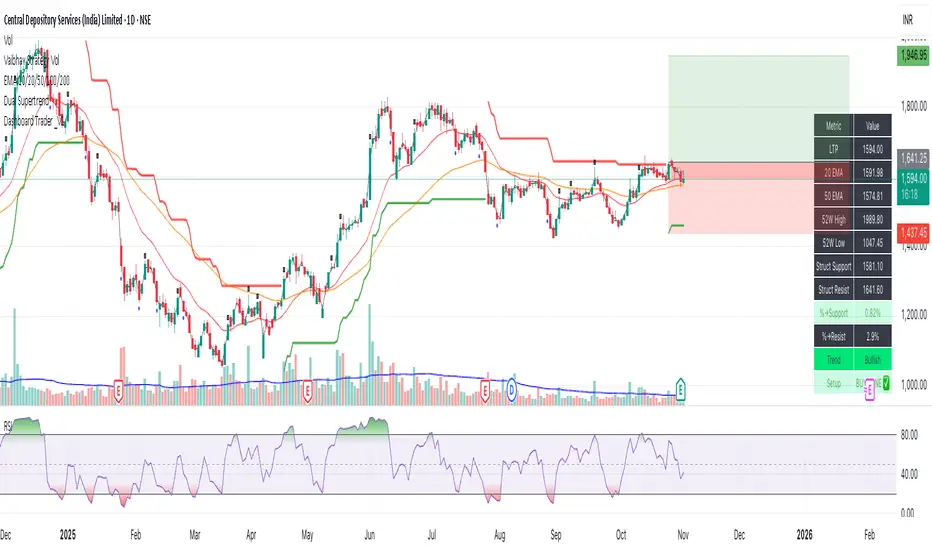
Dashboard Trader _V1
📊 Dashboard Trader – Adaptive Structure, Trend & Zones
Description:
NSE Dashboard V3 is a next-gen support–resistance and trend-mapping indicator designed for positional and swing traders. It combines price structure, moving averages, and adaptive pivot logic to highlight Buy Zones, Take-Profit Zones, and overall market direction — all inside a clean, compact dashboard.
⸻
🧩 What It Does
• Auto-detects structural support & resistance zones using adaptive pivot clustering logic.
• Tracks broken levels dynamically — old supports removed, new ones added.
• Identifies trend bias using dual EMAs (20-EMA & 50-EMA).
• Displays a live dashboard table showing:
• LTP (Last Traded Price)
• 20 EMA / 50 EMA
• 52-week High & Low (true daily data)
• Structural Support & Resistance
• % Distance to each zone
• Trend direction
• Trade Setup Zone → BUY ✅ / TAKE PROFIT ⚠ / NEUTRAL
⸻
🧠 How to Trade It
1. Check the trend:
• 20 EMA > 50 EMA → Bullish bias (look for long entries).
• 20 EMA < 50 EMA → Bearish bias (look for short or avoid longs).
2. Enter near support:
• When price is ≤ 2% above Struct Support and trend is bullish → BUY ZONE ✅
3. Exit or reduce near resistance:
• When price is ≤ 2% below Struct Resistance → TAKE PROFIT ⚠
4. If no valid resistance (at ATH):
• Trail stop below 20 EMA or last swing low.
⸻
⚙️ Key Features
• EMA-based trend detection
• Dynamic structural zone calculation (auto-updates)
• Daily timeframe 52-week High/Low
• Auto color-coded zones and table
• Works on all NSE stocks, futures, or indices
• Optional refresh every new bar
• Lightweight – optimized for live chart use
⸻
📈 Best Used For
• Swing trading / Positional setups (Daily or 4-hour charts)
• Intraday confirmation on lower timeframes (15-min+)
• Trend continuation entries and risk-defined reversals
⸻
⚠️ Disclaimer
This indicator is for educational purposes only.
It does not constitute financial advice or a buy/sell recommendation.
Always combine with your own price action, volume, and risk management.
⸻
💬 Author’s Note
Built for traders who think in zones, not signals.
Trade where risk is smallest and structure is strongest.
— Wealthcafe Investments
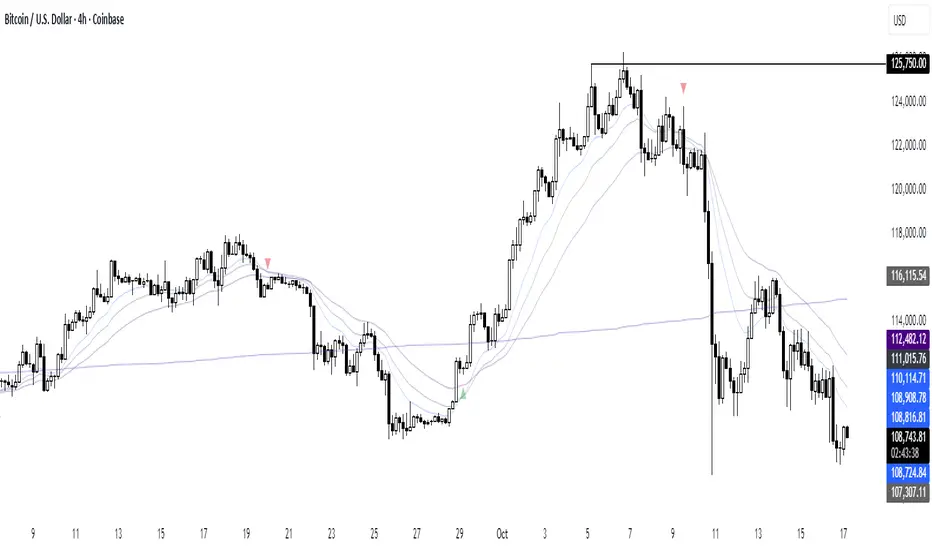
Fixed High Timeframe Moving AveragesFixed High Timeframe Moving Averages (W/D/4H)
Summary
This indicator plots essential, high-timeframe (HTF) Moving Averages onto your chart, **no matter which timeframe you are currently viewing**.
It is designed for traders who need multi-timeframe context at a glance. Stop switching charts to see where the 200-Week or 50-Day MA is—now you can see all critical HTF levels directly on your 5-minute (or any other) chart.
---
Who it’s for
Traders who rely on moving averages but like to work on lower chart timeframes while keeping higher timeframe context in sight. If you scalp on 1–15m yet want Weekly/Daily/4H MAs always visible, this is for you.
---
What it shows
Pinned (“fixed”) moving averages from higher timeframes—Weekly (20/100/200) , Daily (50/100/200/365) and 4H (200) —rendered on any chart timeframe. Your favorite HTF MAs stay on screen no matter what TF you’re currently analyzing.
---
Features
* **MA types:** SMA, EMA, VWMA, Hull.
* **Fully configurable:** toggle each line, set periods, colors, and thickness.
* **Two alert modes (see below):** intrabar vs confirmed HTF close.
* **Works on any symbol & chart TF** using `request.security` to fetch HTF data.
---
Alerts & Modes
This indicator solves the biggest problem with MTF alerts: false signals. You can choose one of two modes:
1. **Intrabar mode** — compares current chart price to the HTF MA. Triggers as soon as price crosses the HTF line; great for early signals but may update until the HTF bar closes.
2. **Confirmed mode** — checks HTF close vs HTF MA. Signals only on the higher-TF bar close; fewer false starts, no intrabar repainting on that TF.
Per-line *Cross Above / Cross Below* conditions are provided for all enabled MAs (e.g., “20W — Cross Above”, “365D — Cross Below”, etc.).
**How to use alerts:** add the script → “Create Alert” → pick any condition from the script’s list.
---
Why this helps
* Keeps Weekly/Daily structure visible while you execute on LTF.
* Classic anchors (e.g., 200D, 20W/100W/200W) are popular for trend bias, dynamic support/resistance, and pullback context.
* Lets you standardize MA references across all your lower-TF playbooks.
---
Notes on confirmation & repainting
* Intrabar signals can change until the higher-TF bar closes (that’s expected with multi-TF data).
* Confirmed mode waits for the HTF close—cleaner, but later. Choose what fits your workflow.
---
Quick setup
1. Pick `MA Type` (SMA/EMA/VWMA/Hull).
2. Enable the HTF lines you want (Weekly 20/100/200; Daily 50/100/200/365; 4H 200).
3. Choose `Alert Mode` (Intrabar vs Confirmed).
4. Style colors/widths to taste and set alerts on the lines you care about.
---
Good practice
* Combine HTF MAs with price action (swings, structure, liquidity grabs) rather than using them in isolation.
* Always validate signals in your execution TF and use a risk plan tailored to volatility.
* Protect your capital: position sizing, stops, and disciplined risk management matter more than any single line on the chart.
---
Disclaimer
For educational/informational purposes only; not financial advice. Trading involves risk—manage it responsibly.

THAIT Moving Averages Tight within # ATR EMA SMA convergence
THAIT(tight) indicator is a powerful tool for identifying moving average convergence in price action. This indicator plots four user-defined moving averages (EMA or SMA). It highlights moments when the MAs converge within a user specified number of ATRs, adjusted by the 14-period ATR, signaling potential trend shifts or consolidation.
A convergence is flagged when MA1 is the maximum, the spread between MAs is tight, and the price is above MA1, excluding cases where the longest MA (MA4) is the highest. The indicator alerts and visually marks convergence zones with a shaded green background, making it ideal for traders seeking precise entry or exit points.

PDB - RSI Based Buy/Sell signals with 4 MARSI Based Buy/Sell Signals on Price chart + 4 MA System
This indicator plots RSI-based Buy & Sell signals directly on the price chart , combined with a 4-Moving-Average trend filter (20/50/100/200) for higher accuracy and cleaner trade timing.
The signal triggers when RSI reaches user-defined overbought/oversold levels, but unlike a standard RSI, this version plots the signals **on the chart**, not in the RSI window — making entries and exits easier to see in real time.
RSI Levels Are Fully Customizable
The default RSI thresholds are 30 (oversold) and 70 (overbought).
However, you can adjust these to fit your trading style. For example:
> When day trading on the 5–15 min timeframe, I personally use 35 (oversold) and 75 (overbought) to catch moves earlier.
> The example shown in the preview image uses 10-minute timeframe settings.
You can change the RSI levels to trigger signals from **any value you choose**, allowing you to tailor the indicator to scalping, day trading, or swing trading.
4 Moving Averages Included:
20, 50, 100, 200 MAs act as dynamic trend filters so you can:
✔ trade signals only in the direction of trend
✔ avoid false reversals
✔ identify momentum shifts more clearly
Works on all markets and timeframes — crypto, stocks, FX, indices.

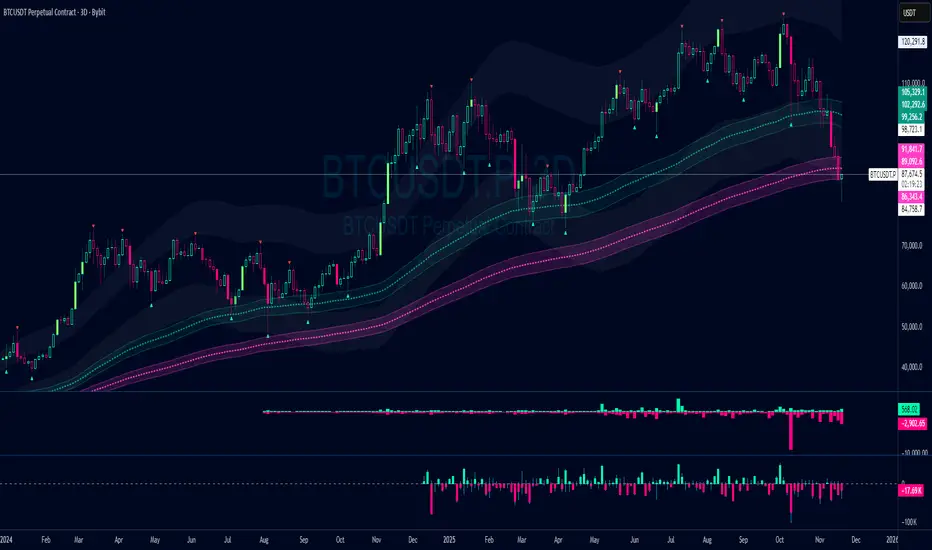
Fishnet Squeeze [Osprey]🟠 Overview
The SMA Fishnet with Squeeze indicator combines a multi-timeframe moving average ribbon system with an advanced squeeze detection algorithm to help traders identify both trend direction and potential breakout opportunities.
🟠 How to Use This Indicator
- Squeeze Breakout Trading
When the indicator signals a squeeze (yellow diamond marker and highlighted background), prepare for a potential breakout in either direction
- Support and Resistance Identification
The twelve SMA levels act as dynamic support and resistance zones. Price often bounces or pauses at these levels, especially at the convergence of multiple SMAs.
Squeeze Settings
- **Enable/Disable**: Toggle squeeze detection on or off
- **Lookback Period**: Adjust the historical comparison window (20-200 bars)
- **Percentile Threshold**: Set sensitivity for squeeze detection (1-20%)
- **Minimum Duration**: Define how many bars must confirm a squeeze (1-10)
- **Visual Customization**: Modify squeeze marker colors to suit your preferences
‼️ Test different values for Lookback Period ! Lower lookback period = more frequent squeeze marks. I suggest using 31 or 100.
🟠 The Fishnet Structure
The indicator employs twelve SMAs ranging from ultra-short-term (3-period) to long-term (200-period), creating a "fishnet" pattern on your chart. This graduated approach provides a comprehensive view of price action across multiple timeframes simultaneously:
🟠 Advanced Squeeze Detection Algorithm
The squeeze detection component identifies periods when all twelve SMAs converge into an unusually tight range, indicating market indecision and potential energy buildup. The algorithm uses several sophisticated filters:
1. ATR-Normalized Range Calculation: The indicator normalizes the SMA range using Average True Range (ATR) to ensure consistent squeeze detection across different volatility environments and price levels.
2. Historical Percentile Analysis: Compares the current normalized range against a customizable lookback period (default: 31 bars) to identify when SMAs are in the bottom percentile of historical tightness.
3. Statistical Validation: Uses z-score analysis to confirm that the current range is significantly below the mean, filtering out false signals.
4. Duration Confirmation: Requires the squeeze condition to persist for a minimum number of consecutive bars (default: 3) to validate genuine compression.
5. Local Minimum Verification: Confirms that the current squeeze represents the tightest point in recent history (20-bar window).
Reactive Curvature Smoother Moving Average IndicatorSummary in one paragraph
RCS MA is a reactive curvature smoother for any liquid instrument on intraday through swing timeframes. It helps you act only when context strengthens by adapting its window length with a normalized path energy score and by smoothing with robust residual weights over a quadratic fit, then optionally blending a capped one step forecast. Add it to a clean chart and watch the single colored line. Shapes can shift while a bar forms and settle on close. For conservative use, judge on bar close.
Scope and intent
• Markets: major FX pairs, index futures, large cap equities, liquid crypto
• Timeframes: one minute to daily
• Purpose: reduce lag in trends while resisting chop and outliers
• Limits: indicator only, no orders
Originality and usefulness
• Novelty: adaptive window selection by minimizing normalized path energy with directionality bias, plus Huber weighted residuals and curvature aware penalty, finished with a mintick capped forecast blend
• Failure modes addressed: whipsaws from fixed length MAs and outlier spikes that pull means
• Testable: Inputs expose all components and optional diagnostics show chosen length, directionality, and energy
• Portable yardstick: forecast cap uses mintick to stay symbol aware
Method overview in plain language
Base measures
• Range span of the tested window and a path energy defined as the sum of squared price increments, normalized by span
Components
Adaptive window chooser: scans L between Min and Max using an energy over trend score and picks the lowest score
Robust smoother: fits a quadratic to the last L bars, computes residuals, applies Huber weights and an exponential residual penalty scaled down when curvature is high
Forecast blend: projects one step ahead from the quadratic, caps displacement by a multiple of mintick, blends by user weight
Fusion rule
• Final line equals robust mean plus optional capped forecast blend
Signal rule
• Visual bias only: color turns lime when close is above the line, red otherwise
What you will see on the chart
• One colored line that tightens in trends and relaxes in chop
• Optional debug overlays for core value, chosen L, directionality, and energy
• Optional last bar label with L, directionality, and energy
• Reminder: drawings can move intrabar and settle on close
Inputs with guidance
Setup
• Source: price series to smooth
Logic
• Min window l_min. Typical 5 to 21. Higher increases stability, adds lag
• Max window l_max. Typical 40 to 128. Higher reduces noise, adds lag ceiling
• Length step grid_step. Typical 1 to 8. Smaller is finer and heavier
• Trend bias trend_bias. Typical 0.50 to 0.80. Higher favors trend persistence
• Residual penalty lambda_base. Typical 0.8 to 2.0. Higher downweights large residuals more
• Huber threshold huber_k. Typical 1.5 to 3.0. Higher admits more outliers
• Curvature guard curv_guard. Typical 0.3 to 1.0. Higher reduces influence when curve is tight
• Forecast blend lead_blend. 0 disables. Typical 0.10 to 0.40
• Forecast cap lead_limit. Typical 1 to 5 minticks
• Show chosen L and metrics show_debug. Diagnostics toggle
Optional: enable diagnostics to see length, direction, and energy
Realism and responsible publication
• No performance claims. Past results never guarantee future outcomes
• Shapes can move while bars are open and settle on close
• Use on standard candles for analysis and combine with your own risk process
Honest limitations and failure modes
• Very quiet regimes can reduce energy contrast, length selection may hover near the bounds
• Gap heavy symbols can disrupt quadratic fit on the window edges
• Excessive forecast blend may look anticipatory; use low values and the cap

PDB 4 MA + Candle Strength/Weakness Detector
4MA Strength & Reversal Detector
Unlock the power of momentum with this advanced 4 Moving Average system (20, 50, 100, 200) designed to pinpoint market strength and early reversal zones with precision.
How It Works:
- Bearish Reversal: Triggered when all moving averages align (20 < 50 < 100 < 200) and bearish reversal candles appear — highlighting potential tops.
- Bullish Reversal: Triggered when all moving averages align (200 < 100 < 50 < 20) and bullish reversal candles form — marking potential bottoms
:Best For:
⚡ Scalpers and day traders using 1–5 minute timeframes
📈 Identifying momentum shifts and trend exhaustion early
Tip: Combine this with volume or RSI for stronger confirmation and fewer false signals.

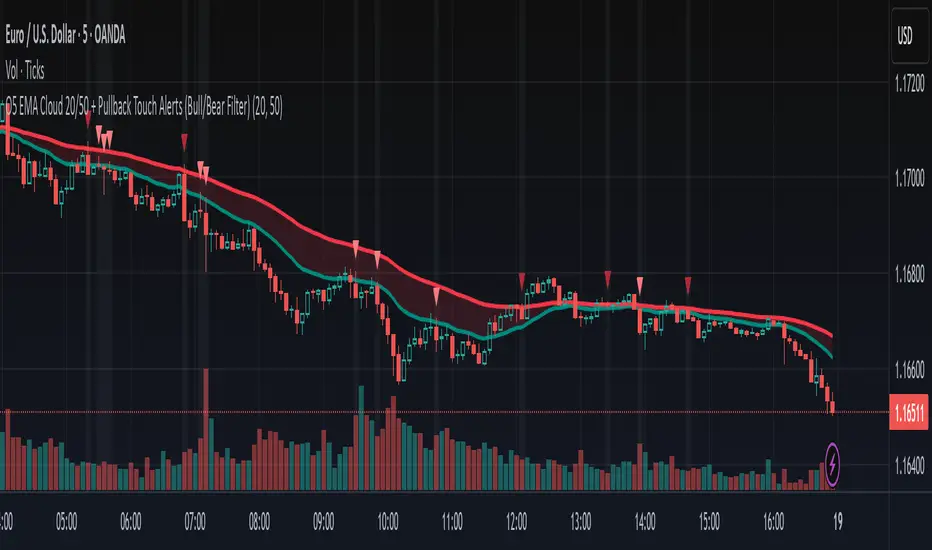
O5 EMA Cloud 20/50 + Pullback Touch Alerts (Bull/Bear Filter)This indicator shows an EMA cloud that is set to Fast=20 and Slow=50 by default, but can be changed.
It features suggested entry signals when price pulls back to either EMA level in both uptrends and downtrends.
Buy signals print only when price pulls back to one of the EMA levels and closes up.
Bearish signals only print when price pulls back to one of the EMA levels and closes down.