Global M2 ex-China MonitorGlobal M2 Monitor - Ultimate Edition
🎯 OVERVIEW
Advanced global M2 money supply monitoring indicator, offering a unique macroeconomic view of global liquidity. Real-time tracking of M2 evolution in major developed economies.
📊 KEY FEATURES
Global M2 Aggregation : USA, Japan, Canada, Eurozone, United Kingdom
Currency Conversion : All data converted to USD for consistent analysis
High Resolution Display : Daily curve by default
Technical Analysis : 50-period moving average (SMA/EMA/WMA)
Accurate YoY Calculation : Annual variation based on monthly data
Advanced Signal System : Multi-condition color codes
🎨 COLOR SYSTEM - DEFAULT SETTINGS
🟢 GREEN : YoY ≥ 7% AND M2 ≥ SMA → Strong growth + Bullish momentum
🔴 RED : YoY ≤ 2% AND M2 ≤ SMA → Weak growth + Bearish momentum
🟢 LIGHT GREEN : YoY ≥ 7% BUT M2 < SMA → Good fundamentals, temporarily weak momentum
🔴 LIGHT RED : YoY ≤ 2% BUT M2 > SMA → Weak fundamentals, price still supported
🔵 BLUE : YoY between 2% and 7% → Neutral zone of moderate growth
🇨🇳 WHY IS CHINA EXCLUDED BY DEFAULT?
Chinese M2 data presents methodological reliability and transparency issues. Exclusion allows for more consistent analysis of mature market economies.
Different M2 definition vs Western standards
Capital controls affecting real convertibility
Frequent monetary manipulations by authorities
✅ Available option : Can be activated in settings
⚙️ OPTIMIZED DEFAULT PARAMETERS
// DISPLAY SETTINGS
Candle Period: D (Daily)
// MOVING AVERAGE
MA Period: 50, Type: SMA
// BACKGROUND LOGIC
YoY Bullish: 7%, YoY Bearish: 2%
SMA Method: absolute, Threshold: 0.2%
// COLORS
Transparency: 5%
China M2: Disabled
📈 RECOMMENDED USAGE
Traders : Anticipate sector rotations
Investors : Identify abundant/restricted liquidity phases
Macro-analysts : Monitor monetary policy impacts
Portfolio managers : Understand inflationary pressures
🔍 ADVANCED INTERPRETATION
M2 ↗️ + YoY ≥ 7% → Favorable risk-on environment
M2 ↘️ + YoY ≤ 2% → Defensive risk-off environment
Divergences → Early warning signals for trend changes
💡 WHY THIS INDICATOR?
Global money supply is the lifeblood of the financial economy . Its growth or contraction typically precedes market movements by 6 to 12 months.
"Don't fight the Fed... nor the world's central banks"
🛠️ ADVANCED CUSTOMIZATION
All parameters are customizable:
YoY bullish/bearish thresholds
SMA comparison method (absolute/percentage)
Colors and transparency
Moving average period and type
Optional China inclusion
📋 TECHNICAL INFORMATION
YoY Calculation : Based on monthly data for consistency
Sources : FRED, ECONOMICS, official data
Updates : Real-time with publications
Currencies : Updated exchange rates
Moneysupply

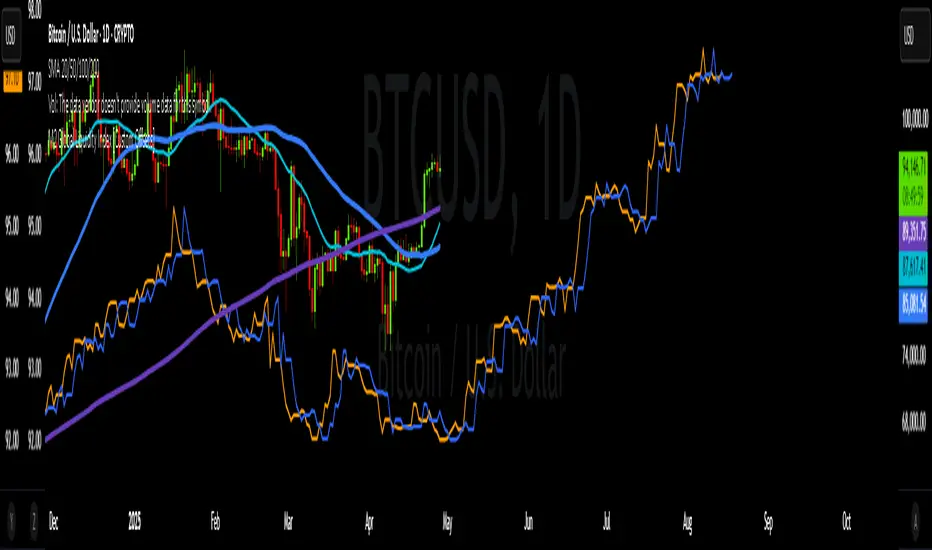
DCA with the Money Supply Index DCA with the Money Supply Index (MSI) by zdmre
This strategy is based on the Money Supply Index (MSI) by zdmre and enhances it with two functional options for users: a DCA (Dollar-Cost Averaging) approach and a signal-based buy/sell mode. It’s designed to help traders and investors make data-driven, disciplined entry decisions based on monetary supply trends.
🧠 Concept Overview
The Money Supply Index (MSI) provides insight into how liquidity (money supply) influences market movements. This strategy builds upon that foundation by allowing users to either:
Accumulate positions over time using DCA, based on favorable MSI conditions.
Execute a single buy and sell trade, optimized for bull market conditions.
⚙️ Inputs Explained
General Parameters
Start Bar Index / Stop Bar Index
Defines the range of bars (historical data) for backtesting or strategy visualization.
Long DCA
Activates the DCA mode. If unchecked, the strategy operates in single-entry/single-exit signal mode.
Trading Signal
Enables signal-based entries and exits when the MSI reaches predefined thresholds.
DCA Parameters
Entry Value
The MSI value that triggers a DCA buy event. When the MSI crosses below this value, the strategy considers it a favorable moment to deploy the saved capital.
Saved Amount
The amount of money set aside regularly (e.g., monthly) for investment. This simulates the DCA effect by accumulating capital and deploying it when conditions are optimal.
Data Inputs
Money Supply
The data source for the Money Supply Index (default: ECONOMICS:USM2).
Relational Symbol
The market instrument to compare against the money supply (default: NASDAQ_DLY:NDX). This allows the strategy to measure liquidity impact on a specific market.
Chart Display Options
You can toggle these metrics on the chart for better visualization:
Entry Price (green) – The price level of executed buys.
Cash Balance (yellow) – Remaining uninvested capital.
Invested Capital (red) – Total amount currently invested.
Current Value (blue) – The current valuation of the investment.
Profit (purple) – The total realized and unrealized profit.
Trades on Chart / Signal Labels / Quantity – Enables trade markers, signal text, and position size visualization.
📈 How the Strategy Works
1️⃣ DCA Mode
In DCA mode, the strategy simulates periodic savings and only invests when the MSI indicates favorable liquidity conditions (based on the Entry Value).
This approach aims to achieve the best possible average entry price over time — a powerful strategy for long-term investors seeking stable accumulation with reduced emotional bias.
2️⃣ Signal-Based Mode
In signal mode (with DCA disabled), the strategy performs one buy and one sell trade based on MSI turning points.
It’s most effective during bull markets, where liquidity expansion supports upward momentum.
This mode helps identify high-probability entry and exit zones rather than averaging in continuously.
💡 Additional Notes
This strategy includes helpful metrics to monitor your personal investment performance — showing invested capital, cash reserves, and profit in real-time.
The goal is to combine macroeconomic insight (money supply) with disciplined execution and capital management.
⚠️ Disclaimer
This strategy is for educational and research purposes only. It does not constitute financial advice. Always conduct your own analysis before making investment decisions.

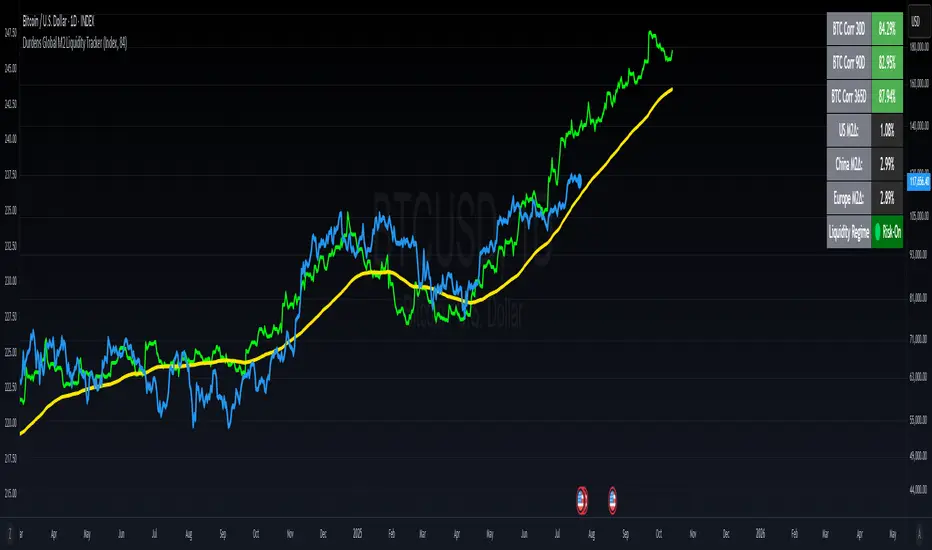
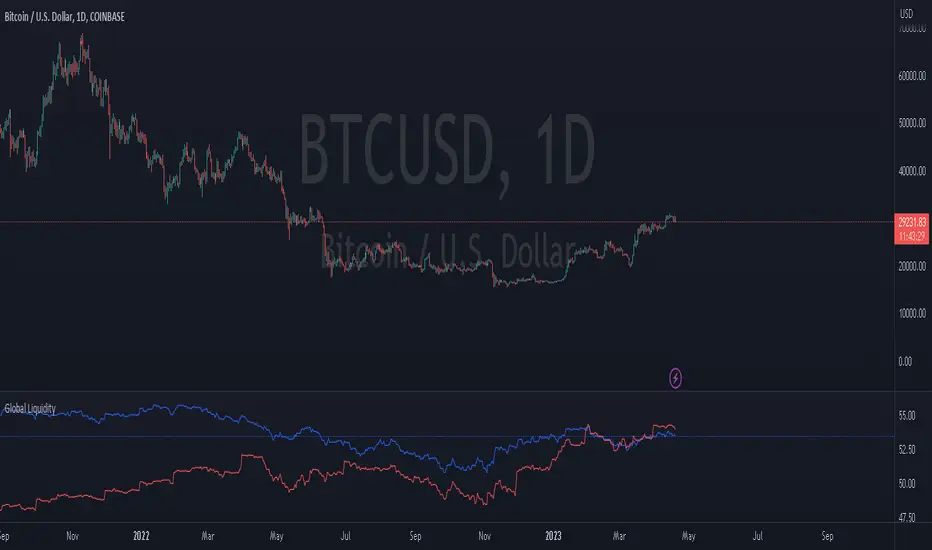
Durdens Global M2 Liquidity Tracker🧠 Durdens Global M2 Liquidity Tracker | Bitcoin vs Liquidity, Visualized
If you’re not watching global liquidity, you’re not really trading macro.
This indicator tracks FX-adjusted M2 money supply across 20+ countries, aggregated into a single global liquidity signal. It can then be used to overlay against Bitcoin for timing macro shifts with precision.
🔍 Core Features:
🌐 USD-adjusted M2 from the US, China, Eurozone, UK, Japan, and more
📊 Normalization modes: None (raw), Index (Based to 100), Z-Score
⏳ Offset input to shift liquidity data forward — aligns with Bitcoin's delayed reaction (84–107 days common)
🧠 BTC correlation matrix: 30D, 90D, 365D correlation values
🧪 Top 3 M2 delta signals: Tracks 90-day % change for US, China, EU
🧮 Fibonacci SMAs: 13 / 34 / 89 for structural macro context
🟢🔴 Liquidity regime engine: EMA 89 defines "Risk-On" vs "Risk-Off" states
🧩 How It Works:
Each country’s M2 is multiplied by its FX rate (to USD) and summed into a single global M2 line. This ensures comparability across nations. The user can choose to:
Normalize the output (raw, indexed, or z-scored)
Shift the global M2 forward in time (offset), simulating the lag effect liquidity has on Bitcoin
Visualize macro risk conditions using EMA 89 as a liquidity regime filter
Analyze BTC correlation across 3 windows and track key regions’ M2 delta
❓ FAQ:
Why does this matter?
M2 is the monetary fuel behind asset bubbles. When liquidity rises, Bitcoin follows; with a delay. This tracker helps you front-run macro flows before they hit the chart.
Why use Index or Z-Score modes?
Raw values skew long-term visual analysis. Index mode rebases data for comparative trend tracking. Z-Score shows when liquidity is overheated or suppressed (mean reversion).
What does the offset input do?
Liquidity doesn’t hit Bitcoin instantly. Many traders use an 84–107 day forward shift to align M2 changes with BTC price action. The offset helps you visualize this.
Why track top 3 M2 regions?
US, China, and Eurozone are the heavyweights in global liquidity. Tracking their offset-day % change gives immediate insight into capital expansion or contraction.
Can I use this to trade?
Absolutely; but it’s best used as a macro filter. Combine with price structure, funding, or on-chain data to optimize timing and conviction.
⚡ Use Cases:
Spot early pivots in liquidity regimes (Risk-Off to Risk-On)
Quantify macro backdrop for Bitcoin or altcoin cycles
Understand when the Fed or PBOC are tightening or easing
Ditch the hopium. Trade with context.
—
Built by: @DurdensBitcoinLedger
Follow for updates — future upgrades include:
• Regional toggles
• Custom M2 baskets
• Alert conditions
• Continued revisions & updates
Stay liquid, not wrecked.
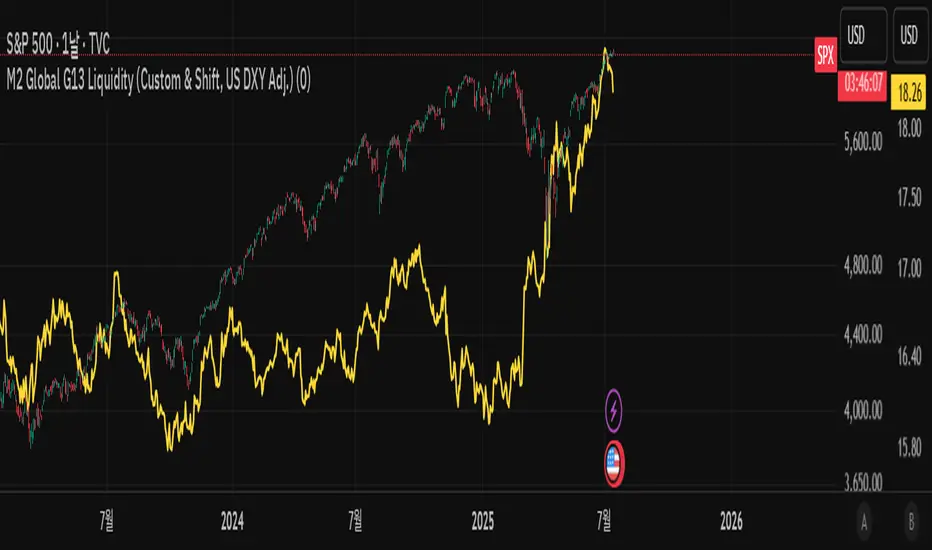
M2 Global G13 Liquidity (Custom & Shift, US DXY Adj.)🌎 M2 Global G13 Liquidity index (Custom & Shift, US DXY Adj.)
💡 Indicator Overview
The M2 Global G13 Liquidity indicator combines the M2 liquidity of 13 major countries, allowing users to selectively include or exclude each country to visualize global capital flows and potential investment liquidity at a glance.
Each country's M2 data is converted to USD using real-time exchange rates, and the US M2 is further adjusted using the Dollar Index (DXY) to reflect the impact of dollar strength or weakness on US liquidity.
✅ What is M2?
M2 is a broad measure of money supply that includes cash, demand deposits, savings deposits, and certain financial products.
It represents a country's overall liquidity and capital supply and is often interpreted as "dry powder" ready to be deployed into various assets such as equities, real estate, and bonds.
Therefore, M2 serves as a crucial benchmark for assessing a country's potential investment capacity that can flow into markets at any time.
💰 Exchange Rate & Dollar Index Adjustment
- All country M2 data is converted from local currencies to USD.
- The US M2 is further adjusted using the Dollar Index (DXY) to better reflect its real global power:
- DXY > 100 → Liquidity contraction (strong dollar effect)
- DXY < 100 → Liquidity expansion (weak dollar effect)
🗺️ Country Selection Options
- Default selection: United States
- Major selections: China, Eurozone, Japan, United Kingdom (core G5 economies)
- Additional selections: Switzerland, Canada, India, Russia, Brazil, South Korea, Mexico, South Africa
- Users can freely add or remove countries to customize the indicator to match their analytical needs.
📈 Example Use Cases
- Monitor global capital flows: Track worldwide liquidity trends and detect potential market risk signals.
- Analyze exchange rate and monetary policy trends: Compare dollar strength with major central bank policies.
- Benchmark against equity indices: Evaluate correlations with MSCI World, KOSPI, NASDAQ, etc.
- Valuation analysis: Compare overall liquidity levels to equity index prices or market capitalization to assess relative valuation and identify potential overvaluation or undervaluation.
- Crisis response strategy: Identify liquidity contraction during global credit crises or deleveraging phases.
==================================================
🌎 M2 글로벌 G13 유동성 지수 (Custom & Shift, US DXY Adj.)
💡 지표 소개
M2 Global G13 Liquidity 지표는 세계 13개 주요국의 M2 유동성을 선택적으로 결합하여, 글로벌 자금 흐름과 잠재 투자 자금을 한눈에 시각화할 수 있도록 설계된 종합 유동성 지표입니다.
국가별 M2 데이터를 환율과 결합해 달러 기준으로 표준화하며, 특히 미국 M2는 달러지수(DXY)로 보정하여 달러 강약에 따른 파급력을 반영합니다.
✅ M2란?
M2는 광의 통화지표로, 현금 + 요구불 예금 + 저축성 예금 + 일부 금융상품을 포함합니다.
이는 한 국가의 유동성 수준과 자금 공급 상태를 나타내는 핵심 거시경제 지표이며, **주식·부동산·채권 등 다양한 자산에 투자될 준비가 된 '대기자금'**으로도 해석됩니다.
따라서 M2는 투자시장으로 언제든지 흘러들어갈 수 있는 잠재적 투자 역량을 평가할 때 중요한 기준입니다.
💰 환율 및 달러지수 보정
- 모든 국가 M2는 자국 통화에서 **달러(USD)**로 환산됩니다.
- 특히 미국 M2는 달러 가치의 글로벌 실질 파워를 평가하기 위해 DXY 보정을 적용합니다.
- DXY > 100 → 유동성 축소 (강달러 효과)
- DXY < 100 → 유동성 확대 (약달러 효과)
🗺️ 국가별 선택 옵션
- 기본 선택: 미국
- 주요 선택: 중국, 유로존, 일본, 영국 (주요 G5)
- 추가 선택: 스위스, 캐나다, 인도, 러시아, 브라질, 한국, 멕시코, 남아공
- 사용자는 각 국가를 자유롭게 더하거나 빼면서 커스터마이즈할 수 있습니다.
📈 활용 예시
- 글로벌 자금 흐름 모니터링: 전세계 유동성 추세 및 시장 리스크 신호 분석
- 환율/금리 정책 분석: 달러 강약과 주요국 정책 변화 비교
- 주가지수 벤치마크 비교: MSCI World, 코스피, 나스닥 등과 상관관계 확인
- 밸류에이션 분석: 전체 유동성 수준을 주가지수나 시가총액과 비교하여, 시장의 상대적 고평가·저평가 여부를 평가
- 위기 대응 전략: 글로벌 신용위기·자금 긴축 국면 대비
My-Indicator - Global Liquidity & Money Supply M2 + Time OffsetThis script is designed to visualize a global liquidity and money supply index by combining data from various regions and, optionally, central bank activity. Visualizing this data on a chart allows you to see how central banks are intervening in the financial system and how the total amount of money in the economy is changing. Let’s take a look at how it works:
Central Bank Liquidity
Shows the actions of central banks (e.g. FED, ECB) providing short-term cash to commercial banks. If you see spikes or a steady increase in these indicators, it may suggest that liquidity is being increased through intervention, which often stimulates the market.
Money Supply
M2 money supply is a monetary aggregate that includes M1 (cash and current deposits) plus savings deposits, small term deposits, and other financial instruments that, while not as liquid as M1, can be quickly converted into cash. As a result, M2 provides a broader picture of the available money in the economy, which is useful for analyzing market conditions and potential economic trends.
How does it help investors?
It allows you to quickly see when central banks are injecting additional liquidity, which could signal higher prices.
It allows you to see trends in the money supply, which informs potential changes in inflation and the economic cycle.
Combining both sets of data provides a more complete picture – both in the short and long term – which makes it easier to predict upcoming price movements.
This allows investors to better respond to changes in central bank policy and broader monetary trends, increasing their chances of making better investment decisions.
Data Collection
The script retrieves money supply data for key markets such as the USA (USM2), Europe (EUM2), China (CNM2), and Japan (JPM2). It also offers additional money supply series for other markets—like Canada (CAM2), Great Britain (GBM2), Russia (RUM2), Brazil (BRM2), Mexico (MXM2), and New Zealand (NZM2)—with extra options (e.g., Australia, India, Korea, Indonesia, Malaysia, Sweden) disabled by default. Moreover, you can enable data for central bank liquidity (such as FED, RRP, TGA, ECB, PBC, BOJ, and other central banks), which are also disabled by default.
Index Calculation
The indicator calculates the index by adding together all the enabled money supply series (and the central bank data if activated) and then scales the sum by dividing it by 1,000,000,000,000 (one trillion). This scaling makes the resulting values more manageable and easier to read on the chart.
Time Offset Feature
A key feature of the script is the time offset. With the input parameter "Time Offset (days)", the user can shift the plotted index line by a specific number of days. The script converts the given offset in days into a number of bars based on the current chart's timeframe. This allows you to adjust for the delay between liquidity changes and their effect on asset prices.
Overall, the indicator plots a line on your chart representing the global liquidity and money supply index, allowing you to visually monitor trends and better understand how liquidity and central bank actions may influence market movements.
What makes this script different from others?
Every supported market—both major regions (USA, Eurozone, China, Japan, etc.) and additional ones—is available. You can toggle each series on or off, so you can view only Money Supply data, only Central Bank Liquidity, or any custom combination.
Separated Data Groups. Inputs are organized into clear groups (“Money Supply”, “Other Money Supply”, “Central Bank Liquidity”), making it easy to focus on just the data you need without clutter.
True Day‑Based Offset. This script converts your chosen “Time Offset (days)” into actual days regardless of timeframe. Whether you’re on a 5‑minute or daily chart, the index is always shifted by exactly the number of days you specify.

M2 Global Liquidity Index [Custom Offsets]M2 Global Liquidity Index
Plots the global M2 money supply alongside price, with two user-configurable forward shifts to help you anticipate macro-driven moves in BTC (or any asset).
Key Features
Current M2 Index (no offset)
Offset A — shift M2 forward by N days (default 78)
Offset B — shift M2 forward by M days (default 109)
Extended Currencies toggle adds 9 additional central banks (CHF, CAD, INR, RUB, BRL, KRW, MXN, ZAR)
All lines share the left-hand axis and scale to trillions
Inputs
Offset A (days): integer ≥ 0 (default 78)
Offset B (days): integer ≥ 0 (default 109)
Include extended currencies?: on/off
How to Use
Add the indicator to any chart (overlay mode).
In Settings → Inputs, enter your desired lead times for Offset A and Offset B.
Toggle extended currencies if you need a broader “global liquidity” view.
Watch how price action (e.g. BTC) tracks the shifted M2 lines to spot potential turning points.
Why It Matters
Changes in money supply often lead risk assets by several weeks to months. This tool makes it easy to visualize and test those correlations directly on your favorite timeframe.
Blockchain Fundamentals: Liquidity Cycle MomentumLiquidity Cycle Momentum Indicator
Overview:
This indicator analyzes global liquidity trends by calculating a unique Liquidity Index and measuring its year-over-year (YoY) percentage change. It then applies a momentum oscillator to the YoY change, providing insights into the cyclical momentum of liquidity. The indicator incorporates a limited historical data workaround to ensure accurate calculations even when the chart’s history is short.
Features Breakdown:
1. Limited Historical Data Workaround
Function: The limit(length) function adjusts the lookback period when there isn’t enough historical data (i.e., near the beginning of the chart), ensuring that calculations do not break due to insufficient data.
2. Global Liquidity Calculation
Data Sources:
TVC:CN10Y (10-year yield from China)
TVC:DXY (US Dollar Index)
ECONOMICS:USCBBS (US Central Bank Balance Sheet)
FRED:JPNASSETS (Japanese assets)
ECONOMICS:CNCBBS (Chinese Central Bank Balance Sheet)
FRED:ECBASSETSW (ECB assets)
Calculation Methodology:
A ratio is computed (cn10y / dxy) to adjust for currency influences.
The Liquidity Index is then derived by multiplying this ratio with the sum of the other liquidity components.
3. Year-over-Year (YoY) Percent Change
Computation:
The indicator determines the number of bars that approximately represent one year.
It then compares the current Liquidity Index to its value one year ago, calculating the YoY percentage change.
4. Momentum Oscillator on YoY Change
Oscillator Components:
1. Calculated using the Chande Momentum Oscillator (CMO) applied to the YoY percent change with a user-defined momentum length.
2. A weighted moving average (WMA) that smooths the momentum signal.
3. Overbought and Oversold zones
Signal Generation:
Buy Signal: Triggered when the momentum crosses upward from an oversold condition, suggesting a potential upward shift in liquidity momentum.
Sell Signal: Triggered when crosses below an overbought condition, indicating potential downward momentum.
State Management:
The indicator maintains a state variable to avoid repeated signals, ensuring that a new buy or sell signal is only generated when there’s a clear change in momentum.
5. Visual Presentation and Alerts
Plots:
The oscillator value and signalline are plotted for visual analysis.
Overbought and oversold levels are marked with dashed horizontal lines.
Signal Markers:
Buy and sell signals are marked with green and maroon circles, respectively.
Background Coloration:
Optionally, the chart’s background bars are colored (yellow for buy signals and fuchsia for sell signals) to enhance visual cues when signals are triggered.
Conclusion
In summary, the Liquidity Cycle Momentum Indicator provides a robust framework to analyze liquidity trends by combining global liquidity data, YoY changes, and momentum oscillation. This makes it an effective tool for traders and analysts looking to identify cyclical shifts in liquidity conditions and potential turning points in the market.

Blockchain Fundamentals: Global LiquidityGlobal Liquidity Indicator Overview
This indicator provides a comprehensive technical analysis of liquidity trends by deriving a Global Liquidity metric from multiple data sources. It applies a suite of technical indicators directly on this liquidity measure, rather than on price data. When this metric is expanding Bitcoin and crypto tends to bullish conditions.
Features:
1. Global Liquidity Calculation
Data Integration: Combines multiple market data sources using a ratio-based formula to produce a unique liquidity measure.
Custom Metric: This liquidity metric serves as the foundational input for further technical analysis.
2. Timeframe Customization
User-Selected Period: Users can select the data timeframe (default is 2 months) to ensure consistency and flexibility in analysis.
3. Additional Technical Indicators
RSI, Momentum, ROC, MACD, and Stochastic:
Each indicator is computed using the Global Liquidity series rather than price.
User-selectable toggles allow for enabling or disabling each individual indicator as desired.
4. Enhanced MACD Visualization
Dynamic Histogram Coloring:
The MACD histogram color adjusts dynamically: brighter hues indicate rising histogram values while darker hues indicate falling values.
When the histogram is above zero, green is used; when below zero, red is applied, offering immediate visual insight into momentum shifts.
Conclusion
This indicator is an enlightening tool for understanding liquidity dynamics, aiding in macroeconomic analysis and investment decision-making by highlighting shifts in liquidity conditions and market momentum.

M2 Global Liquidity Index
The M2 Global Liquidity Index calculates a composite index reflecting the aggregate liquidity provided by the M2 money supply of five major currencies: Chinese Yuan (CNY), US Dollar (USD), Euro (EUR), Japanese Yen (JPY), and British Pound (GBP). The M2 money supply includes cash, checking deposits, and easily convertible near money. By incorporating exchange rates (CNY/USD, EUR/USD, JPY/USD, GBP/USD), the script adjusts each country's M2 supply to a common base (USD) and sums them up to produce a global liquidity metric. This metric, plotted on a daily timeframe, provides an overview of the total liquidity available in these five significant economies.
Understanding the M2 money supply is crucial for assessing liquidity because it represents the amount of money readily available in an economy for spending and investment. Higher M2 levels generally indicate more liquidity, suggesting easier access to capital for businesses and consumers, potentially leading to economic growth. Conversely, lower M2 levels can signify tighter liquidity conditions, possibly resulting in constrained spending and investment.

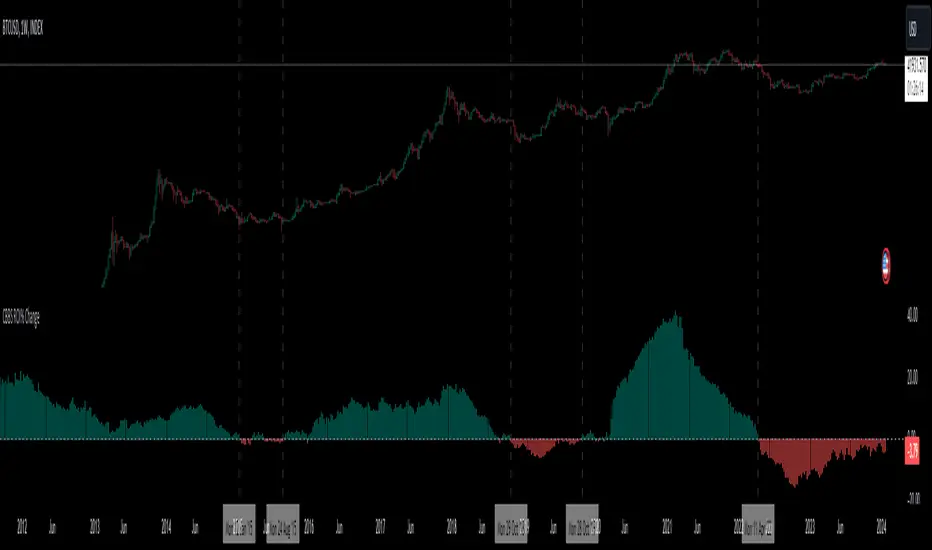
Central Banks Balance Sheets ROI% ChangeIntroducing the "Central Banks Balance Sheets ROI% Change" indicator, a tool designed to offer traders and analysts an understanding of global liquidity dynamics.
This indicator tracks the Return on Investment (ROI) percentage changes across major central banks' balance sheets, providing insights into shifts in global economic liquidity not tied to cumulative figures but through ROI calculations, capturing the pulse of overall economic dynamics.
Key Enhancements:
ROI Period Customization: Users can now adjust the ROI calculation period, offering flexibility to analyze short-term fluctuations or longer-term trends in central bank activities, aligning with their strategic time horizons.
Chart Offset Feature: This new functionality allows traders to shift the chart view, aiding in the alignment of data visualization with other indicators or specific analysis needs, enhancing interpretive clarity.
Central Bank Selection: With options to include or exclude data from specific central banks among the world's top 15 economies (with the exception of Mexico and the consolidation of the EU's central bank data), traders can tailor the analysis to their regional focus or diversification strategies.
US M2 Option: Recognizing the significance of the M2 money supply as a liquidity metric, this indicator offers an alternative view focusing solely on the US M2, allowing for a concentrated analysis of the US liquidity environment.
Comprehensive Coverage: The tool covers a wide array of central banks, including the Federal Reserve, People's Bank of China, European Central Bank, and more, ensuring a broad and inclusive perspective on global liquidity.
Visualization Enhancements: A histogram plot vividly distinguishes between positive and negative ROI changes, offering an intuitive grasp of liquidity expansions or contractions at a glance.
This indicator is a strategic tool designed for traders who seek to understand the undercurrents of market liquidity and its implications on global markets.
Whether you're assessing the impact of central bank policies, gauging economic health, or identifying investment opportunities, the "Central Banks Balance Sheets ROI% Change" indicator offers a critical lens through which to view the complex interplay of global liquidity factors.
Global Liquidity IndexThe Global Liquidity Index offers a consolidated view of all major central bank balance sheets from around the world. For consistency and ease of comparison, all values are converted to USD using their relevant forex rates and are expressed in trillions. The indicator incorporates specific US accounts such as the Treasury General Account (TGA) and Reverse Repurchase Agreements (RRP), both of which are subtracted from the Federal Reserve's balance sheet to give a more nuanced view of US liquidity. Users have the flexibility to enable or disable specific central banks and special accounts based on their preference. Only central banks that both don’t engage in currency pegging and have reliable data available from late 2007 onwards are included in this aggregated liquidity model.
Global Liquidity Index = Federal Reserve System (FED) - Treasury General Account (TGA) - Reverse Repurchase Agreements (RRP) + European Central Bank (ECB) + People's Bank of China (PBC) + Bank of Japan (BOJ) + Bank of England (BOE) + Bank of Canada (BOC) + Reserve Bank of Australia (RBA) + Reserve Bank of India (RBI) + Swiss National Bank (SNB) + Central Bank of the Russian Federation (CBR) + Central Bank of Brazil (BCB) + Bank of Korea (BOK) + Reserve Bank of New Zealand (RBNZ) + Sweden's Central Bank (Riksbank) + Central Bank of Malaysia (BNM).
This tool is beneficial for anyone seeking to get a snapshot of global liquidity to interpret macroeconomic trends. By examining these balance sheets, users can deduce policy trajectories and evaluate the global economic climate. It also offers insights into asset pricing and assists investors in making informed capital allocation decisions. Historically, riskier assets, such as small caps and cryptocurrencies, have typically performed well during periods of rising liquidity. Thus, it may be prudent for investors to avoid additional risk unless there's a consistent upward trend in global liquidity.

Global LiquidityThe "Global Liquidity" script is an indicator that calculates and displays the global liquidity value using a formula that takes into account the money supply of several major economies. The script utilizes data from various sources, such as the Federal Reserve Economic Data (FRED), Economics, and FX_IDC.
The indicator plots the global liquidity value as a candlestick chart and breaks it down into two categories: the Euro-Atlantic region (West) and the rest of the world (East). The values are denominated both in inflation-adjusted dollars and in trillions of dollars. The script also calculates the spread between the Euro-Atlantic region and the rest of the world.
Traders and investors can use this indicator to gauge the overall liquidity of the global economy and to identify potential investment opportunities or risks. By breaking down the liquidity value into different regions, traders can also gain insights into regional economic trends and dynamics.
Note that this script is subject to the terms of the Mozilla Public License 2.0 and was created by rodopacapital.
Money Supply Index (MSI) by zdmreThe primary objective of the states monetary policy is to maintain price stability with sustainable maximum economic growth. In anticipation of higher inflation , the Central Banks raise short-term interest rate thereby to reduce money supply. Conversely, the Central Banks reduce short-term interest rate to inject additional money into the economy in apprehension of unleashing recessionary forces. The stock markets usually respond negatively to interest rate increases and positively to interest rate decreases. The linkages between money market and stock market a wealth effect due to a change in money supply disturbs the equilibrium in the portfolio of investors.
This index indicates the long-run and short-run dynamic effects of broad money supply (M2) on U.S. stock market (this symbol is optional (Bitcoin, Gold or Oil or other markets etc.)).
#DYOR

Inflation Adjusted Performance: Ticker/M2 money supplyPlots current ticker / M2 money supply, to give an idea of 'inflation adjusted performance'.
~In the above, see the last decade of bullish equities is not nearly as impressive as it seems when adjusted to account for the FED's money printing.
~Works on all timeframes/ assets; though M2 money supply is daily data release, so not meaningful to plot this on timeframe lower than daily.
~To display on same pane; comment-out line 6 and un-comment line 7; then save, remove and re-add indicator.
~Scale on the right is meaningless; this indicator is just to show/compare the shape of the charts.

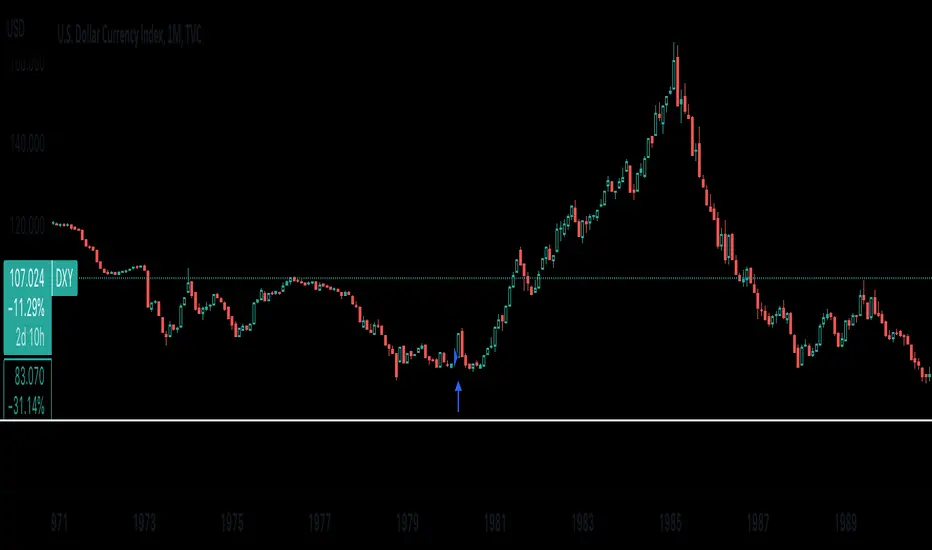
When was the last time we were in stagflation?Here I coded a strategy that indicates when we should enter a long position in the US dollar. The three indicators I used were the Inflation Rate, 10Y interest rate, and GDP growth rate. Right now in our economy, It seems as though we are in stagflation due to high inflation and declining GDP growth. Thoughts on how our government should handle the oversupply of money in the economy right now are another conversation. The reason I built this indicator is to see when the last time our country was in this type of market environment was and to see how far the dollar rose from that point on. It is necessary to say that the US dollar generally does not show these steep increases in value unless there is a hard cut in the Money supply. However, what we see is that the last time we were in stagflation was around the early 1980s when the dollar value rose to around 107( the levels we're at right now) and did not stop until It hit its peak at 150!!!! This isn't all that exciting really because if the FED follows a similar path as It did back in the '80s then we are going to see a whole lot more money supply being cut, an increase in interest rates, and a declining GDP Growth rate.
ATTENTION: This indicator does not tell you to buy any financial instrument that follows the DXY(US Dollar index), with that being said please feel free to comment and tell me your opinion. whether it's how bad my coding is(I'm a beginner sorry!!) or whether my ideas on our market environment right now are bogus or just do not make sense.
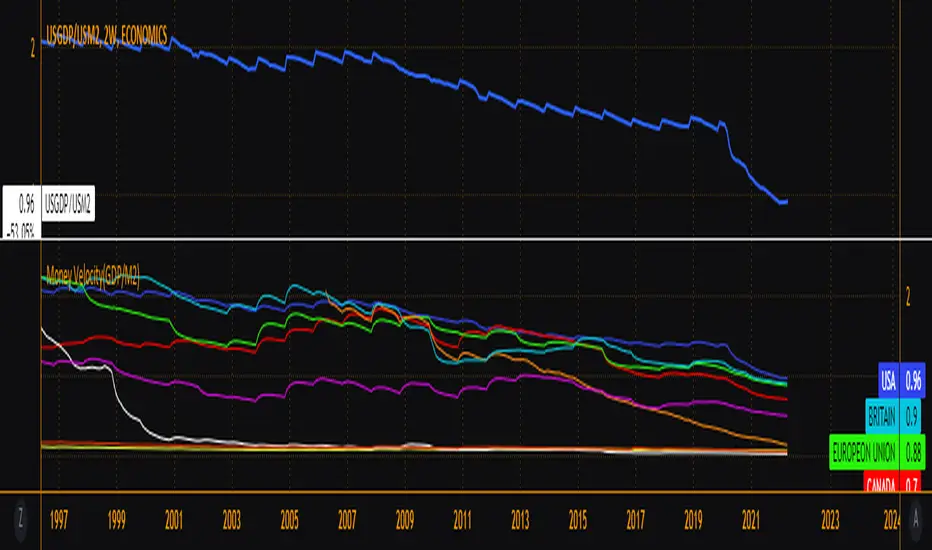
Money Velocity(GDP/M2)V=GDP/M2
Major world economy's money supply velocity. Compare how each country's monetary policy has played out and current trajectory in comparison to others. The velocity of money is a measure of the number of times that the average unit of currency is used to purchase goods and services within a given time period. The concept relates the size of economic activity to a given money supply, and the speed of money exchange is one of the variables that determine inflation.
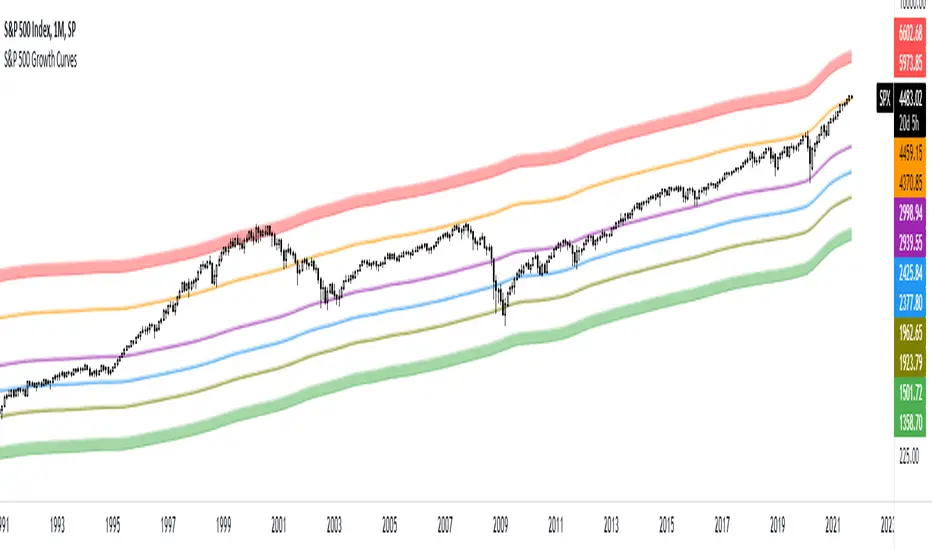
S&P 500 Growth CurvesThese curves are based on the growth of the money supply and the Fibonacci retracement levels. You can use this indicator to determine when the market is undervalued or overvalued. You can also see how often the price reacts to these curves.
Inflation NationThis is a measure between current inflation and inflation if the velocity of money increased to 1.4 (pre-pandemic levels).
