STOCH&EMA Strategy with a trailing stop EMA'S dictate direction of entry
50 EMA above 200 EMA = LONG
50 EMA below 200 EMA = SHORT
Stoch 15,20,5
When LONG and "K" crosses over signal line "D Underneath the value of 40 = Enter Long
When SHORT and "K" crosses under signal line "D" Above the value of 60 = Enter Short
Risk managment
Trailing profit at 21 pips with a 1 pip offset ( attempting to catch any further moves of breaks)
Stop loss 20 pips
Any suggestions on how to improve this strategy is always welcome
M-oscillator

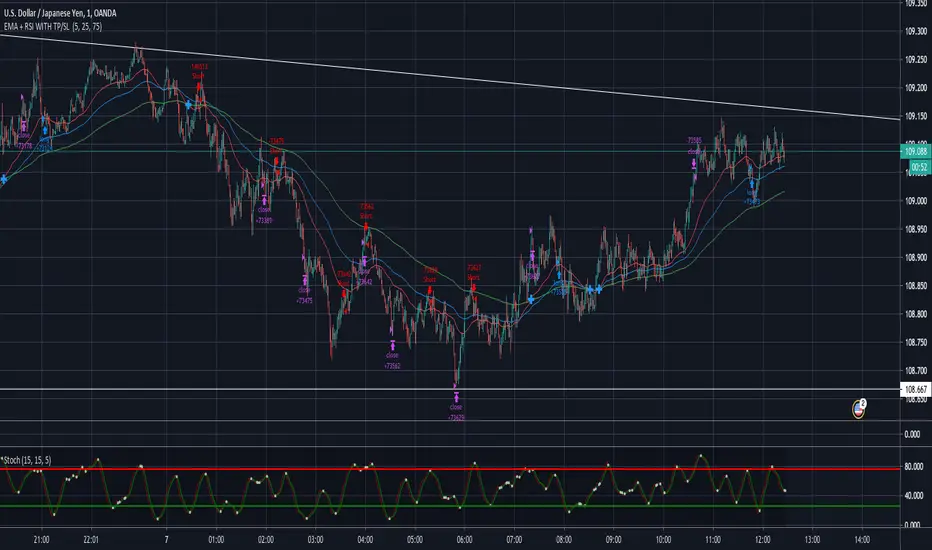
EMA + RSI WITH TP/SL 1 Minute scalping strategy
EMA 50 & EMA 200 dictate direction of entry
EMA 50 above EMA 200 = Long
EMA 50 below EMA 200 = Short
If Long and RSI crossover 25 = Long entry
If Short and RSI crossunder 75 = Short entry
Each trade is currently 1:1.3 risk to reward ratio.
15 pip TP
12 PIP SL
Any suggestions on further improvements /variations are more then welcome.
SURE SHOT TREND IDENTIFIERSURE SHOT TREND IDENTIFIER (SSTI) - It keeps Traders on Trending Side of the Market
BELOW BASIC THINGS MUST KNOW BEFORE USING THIS TOOL
1. Priority One: Background should be GREEN for UP TREND and RED for DOWN TREND
2. Minimum 4 out of first 5 Signals MUST come from below list to take your position
1. UP TREND
i. Background GREEN
ii. Bottom GREEN Dot – Trading Point Alert to take position
iii. BIG GREEN UP Arrow – Indication for Bullish
iv. TOP GREEN Dots – Positive Trend Direction
v. Long Signal Message – with this combination, we can say it is confirmed trend
vi. Likely to Raise with Up Arrow Message – Optional, as this will trigger automatically when you get first 4 signals.
vii. More Buying Message – Optional, to give more strength to the Trend
2. DOWN TREND
i. Background RED
ii. Bottom RED Dot – Trading Point Alert to take position
iii. BIG RED DOWN Arrow – Indication for Bearish
iv. TOP RED Dots – Negative Trend Direction
v. Short Signal Message – with this combination, we can say it is confirmed trend
vi. Likely to Fall with Down Allow Message – Optional, as this will trigger automatically when you get first 4 signals.
vii. More Selling Message – Optional, to give more strength to the Trend
3. Lines with YELLOW color filling is CPR (Central Pivot Range)
1. It helps when to EXIT from the position
2. Small GREEN Dot Lines represents Resistance Levels with R1, R2, R3 and R4 Levels
3. Small RED Dot Lines represents Support Levels with S1, S2, S3 and S4 Levels
4. Very Important:
1. If background color and TOP Dots colors are different, then it will give you wrong indication, so please don’t take any position, wait to get both same color.
2. If TOP Dots are showing YELLOW color, then it will be sideways market, so wait to match background and TOP Dots colors. If already taken position, take the decision based on other conditions to continue or EXIT from the position.
3. Please take position only ON BEGINNING of the TREND, don’t take any position during MIDDLE of the TREND. You may end up with losses.
4. GREEN background but NO other 3 supportive indicator confirmation – Exit / Continue with existing position based on other conditions, but - No New Position
5. GREEN background will other 3 supportive indicators, but RED Dots on Top, then don’t take NEW Position or Don’t EXIT. Take decision based on other indicators.
6. RED background but NO other 3 supportive indicator confirmation – Exit / Continue with existing position based on other conditions, but - No New Position
7. Close Long Message at below of the Candle – EXIT / Cautious on existing position based on other conditions, but - No New Position
5. Decision Making to EXIT Positions from
1. UP TREND when you see any of the below alerts on GREEN background
i. Close Long Message
ii. More Selling Message
iii. DOWN Message
iv. BIG RED DOWN Arrow
v. CPR conditions
1. If Candle Touches R1/R2/R3/R4 and struggling to move ABOVE any of these levels, then EXIT from the position
2. If you are a conservative investor, best method is to EXIT after reaching 50% of any of the Lower to Upper Resistance Level. i.e from CPR R1 R2 R3 R4
3. If you are an aggressive investor, you can wait till it gives first 4 alerts to exit.
2. DOWN TREND when you see any of the below alerts on RED background
i. Close Short Message
ii. More Buying Message
iii. UP Message
iv. BIG GREEN UP Arrow
v. CPR conditions
1. If Candle Touches S1/S2/S3/S4 and struggling to move BELOW any of these levels, then EXIT from the position
2. If you are a conservative investor, best method is to EXIT after reaching 50% of any of the Upper to Lower Support Level. i.e from CPR S1 S2 S3 S4
3. If you are an aggressive investor, you can wait till it gives first 4 alerts to exit

BEST ATR Stop Multiple StrategyHello traders
Here we go again.... with another strategy snippet.
Reminder: it's an alternative of this Trailing Stop strategy script
Entry logic
The entry is based on a Simple Moving Averages (SMA) cross.
This part doesn't matter here - as I wanted to focus on the ATR multiple stop loss component.
ATR STOP
This strategy snippet uses an entry stop loss defined based on a multiple of the average true range value.
The soure code detects ATR value at entry price, applies the multiplier and will set a static (= non trailing) stop-loss to each position
A pinescript v4 label will appear for each new signal displaying the ATR*multiplier value at signal time
All the BEST
Dave

Pyramiding Strategy To Study [mcristianrios]This script simulates what goes behind scenes in a Strategy and it serves to know in Study mode how many positions are running at the same time.

Combo Backtest 123 Reversal & Dynamo This is combo strategies for get a cumulative signal.
First strategy
This System was created from the Book "How I Tripled My Money In The
Futures Market" by Ulf Jensen, Page 183. This is reverse type of strategies.
The strategy buys at market, if close price is higher than the previous close
during 2 days and the meaning of 9-days Stochastic Slow Oscillator is lower than 50.
The strategy sells at market, if close price is lower than the previous close price
during 2 days and the meaning of 9-days Stochastic Fast Oscillator is higher than 50.
Second strategy
In July 1996 Futures magazine, E. Marshall Wall introduces the
Dynamic Momentum Oscillator (Dynamo). Please refer to this article
for interpretation.
The Dynamo oscillator is a normalizing function which adjusts the
values of a standard oscillator for trendiness by taking the difference
between the value of the oscillator and a moving average of the oscillator
and then subtracting that value from the oscillator midpoint.
WARNING:
- For purpose educate only
- This script to change bars colors.
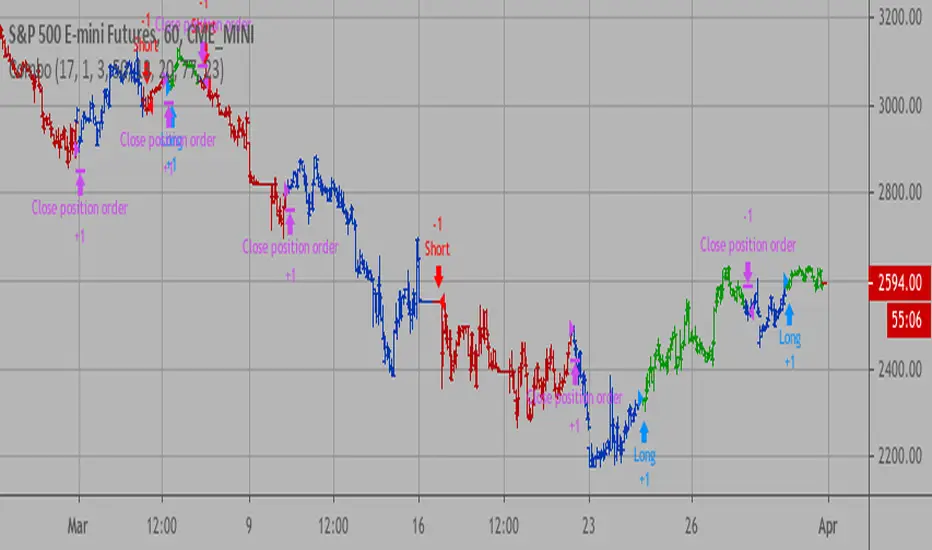
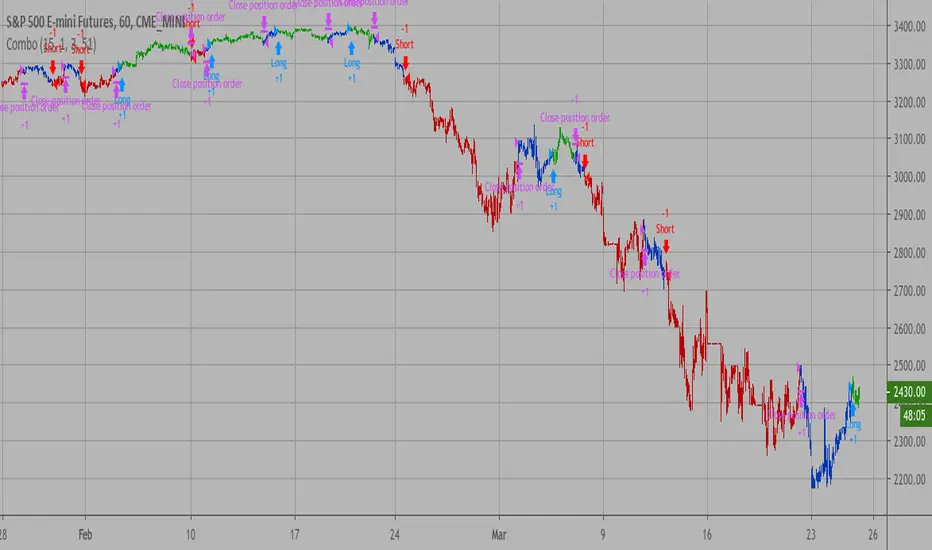
Dominator Ladder StrategyThe Dominator is a technical indicator. Based on algorithm calculations, this indicator extrapolates the previous price for the next bar.
Here is how Dominator is calculated:
1. The study estimates the price projected for the next bar. The estimated price is based on the algorithm method.
2. The study extrapolates this value to find a projected price change for the next bar.
The resulting extrapolated value is shown as a histogram on a lower subgraph. By default, sections of the histogram where the extrapolated value is increasing are shown in green; sections corresponding to the decreasing value are shown in red.
Note: Value projection is purely mathematical as all calculations are based on algorithm averaging of previous values.
Note: lower subgraph it's just for you to understand and view the waves during the Strategy process Study it's not included in this strategy.
Overlay True
The strategy includes 3 different adjustable levels for the ladder , plus automatic adjustable stop loss and takes profit calculated from your average entry price after each ladder adds.
Adjustable BAcktest Window.
1 long signals
3 ladder long add signals
1 short signals
3 ladder short add signals
1 dynamic stop calculated from your average entry price
1 dynamic take profit calculated from your average entry price

PowerBot Binary Backtest FrameworkHello Traders,
This is the backtest framework for testing the Powerbot algorithm before activating alerts which can be used for precise Trading.
Powerbot can be used across any timeframe and across any expiration based on the performance
This backtest comes with some features to help traders make a decision on the following:
When using the indicator itself.
1. We use our proprietary algorithm - "Powerbot binary algorithm script", which is Public but can only be accessed based on request. If you would like to use the algorithm please ensure you have tested different assets and varying expiration for your trades through the backtest - if you don't know how to do that please contact us by sending a message.
EXPLORE YOUR OPTIONS FOR TRADING THROUGH VARIED ITERATION.
2. You can choose any expiration time by changing the expiration time period from the 'settings' button, this will display new results. example; on a 5 minutes chart timeframe, 6 bars would be 30 minutes, which means 5 minutes times 6, which is 30 and minutes because your timeframe is set to minutes. Another example is that on a 1-hour timeframe, 12 bars would be 12 hours, given 1 * 12 is 12hours, because your timeframe is set to hours.
3. You can choose the trading session you want, please note that we have included the three most active sessions - ASIAN, EU/UK, & US Session, by default, the scripts checks for performance on 24/7, which means it does not omit trades outside of the trading session. The Tradingview time is in UTC (or GMT -4). The best times to trade are during sessions most active times.
This backtesting indicator is free to add to the chart if you would like to use the algorithm during your trading session you need to contact us. After which you can use the algorithm for as long as you want.
Please note that no signal can work in all timeframe across all markets that is why backtesting to search for algorithms with at least 50% performance ratio is excellent for trading. All you need is to diversify alerts across to assets or more to rake in profits.
If you require assistance in understanding what session would work best, you can send us a message to work through the process together.
Thank you for you support. This script is free to use to see potential of the indicator itself.
We are NOT allowed to advertise any script on sale based on tradingview house rules.
Wishing you all the best.

Reversion Scalp Bot v4Name: Reversion Scalp Bot
Symbol: XBTUSD
Suggested Equity: 15%
Leverage: 10X or 25X
Candles: 1-minute
Type: Scalp
Description:
This scalp bot uses medium leverage to scalp small but high certainty movements on the 1-minute timeframe. In a proprietary feature, the algo is built for in and out trades essentially based on mean reversion and volume indicators.
The Algo is also leveraging pattern recognition and backtested volume analysis. You are trading with the exchange's built-in systems that drive liquidations and insurance funds. Each trade will be longer no than one hour.

inwCoin Stochastic RSI + MACD Filter StrategyinwCoin Stochastic RSI Strategy with MACD as trend filter.
Parameters Setup
===============
* everything are self-explanatory.
Entry Logic
===========
Long/Cover Short Signal :
- If SmoothK > Bottom Line and SmoothD is crossing up Bottom Line = BUY SIGNAL
- In human word : Both lines cross up bottom line from below.
- If "Use MACD as trend filter" checked, long signal will trigger if MACD > 0
Short/Close Long Signal :
- If Smooth K < Top Line and SmoothD is crossing down Top Line = SELL SIGNAL
- In human word : Both lines cross down top line from top.
- If "Use MACD as trend filter" checked, short signal will trigger if MACD < 0
How to use in real trade
===============
1) Just add to the chart and see the backtest result. Make sure to adjust commission and slippage properly.
2) Recommended to using in Daily Timeframe.
Extra
=====
Short Entry Example ( 2018-2020 )

hamster-bot HiDeep strategy// DESCRIPTION OF STRATEGY
HiDeep Strategy
Author foresterufa
This is a counter-trending strategy that is gradually gaining a position against the trend at the best price.
A prerequisite for completing a position is the price exit from the internal channel on the chart and the appearance of the HiDeep indicator.
The condition for closing the position is touching the opposite side of the internal channel.
A condition for facilitating closure along the middle line of the channel, with high price volatility , is that the price touches the border of the external channel.
Input signals are generated by HiDeep indicators. Closing a position by moving averages.

Combo Backtest 123 Reversal & Dynamic Pivot Point This is combo strategies for get a cumulative signal.
First strategy
This System was created from the Book "How I Tripled My Money In The
Futures Market" by Ulf Jensen, Page 183. This is reverse type of strategies.
The strategy buys at market, if close price is higher than the previous close
during 2 days and the meaning of 9-days Stochastic Slow Oscillator is lower than 50.
The strategy sells at market, if close price is lower than the previous close price
during 2 days and the meaning of 9-days Stochastic Fast Oscillator is higher than 50.
Second strategy
This Pivot points is calculated on the current day.
Pivot points simply took the high, low, and closing price from the previous period and
divided by 3 to find the pivot. From this pivot, traders would then base their
calculations for three support, and three resistance levels. The calculation for the most
basic flavor of pivot points, known as ‘floor-trader pivots’, along with their support and
resistance levels.
WARNING:
- For purpose educate only
- This script to change bars colors.
Combo Backtest 123 Reversal & Dynamic Momentum Index This is combo strategies for get a cumulative signal.
First strategy
This System was created from the Book "How I Tripled My Money In The
Futures Market" by Ulf Jensen, Page 183. This is reverse type of strategies.
The strategy buys at market, if close price is higher than the previous close
during 2 days and the meaning of 9-days Stochastic Slow Oscillator is lower than 50.
The strategy sells at market, if close price is lower than the previous close price
during 2 days and the meaning of 9-days Stochastic Fast Oscillator is higher than 50.
Second strategy
This indicator plots Dynamic Momentum Index indicator. The Dynamic Momentum
Index (DMI) was developed by Tushar Chande and Stanley Kroll. The indicator
is covered in detail in their book The New Technical Trader.
The DMI is identical to Welles Wilder`s Relative Strength Index except the
number of periods is variable rather than fixed. The variability of the time
periods used in the DMI is controlled by the recent volatility of prices.
The more volatile the prices, the more sensitive the DMI is to price changes.
In other words, the DMI will use more time periods during quiet markets, and
less during active markets. The maximum time periods the DMI can reach is 30
and the minimum is 3. This calculation method is similar to the Variable
Moving Average, also developed by Tushar Chande.
The advantage of using a variable length time period when calculating the RSI
is that it overcomes the negative effects of smoothing, which often obscure short-term moves.
The volatility index used in controlling the time periods in the DMI is based
on a calculation using a five period standard deviation and a ten period average
of the standard deviation.
WARNING:
- For purpose educate only
- This script to change bars colors.

Laguerre RSI by KivancOzbilgic STRATEGYBacktesting.
" Laguerre RSI is based on John EHLERS' Laguerre Filter to avoid the noise of RSI .
Change alpha coefficient to increase/decrease lag and smoothness.
Buy when Laguerre RSI crosses upwards above 20.
Sell when Laguerre RSI crosses down below 80.
While indicator runs flat above 80 level, it means that an uptrend is strong.
While indicator runs flat below 20 level, it means that a downtrend is strong. "
Developer: John EHLERS
Author: KivancOzbilgic

Fractal Breakout StrategyFractal
A type of pattern used in technical analysis to predict a reversal in the current trend. A fractal pattern consists of five bars and is identified when the price meets the following characteristics:
1. A shift from a downtrend to an uptrend occurs when the lowest bar is located in the middle of the pattern and two bars with successively higher lows are positioned around it.
2. A shift from an uptrend to a downtrend occurs when the highest bar is located in the middle of the pattern and two bars with successively lower highs are positioned around it.

Reticulata Enhanced - StrategyThis script is the backtesting for Reticulata Enhanced.
Building on our core script - Reticulata, the enhanced version features several requested extras to give you more flexibility with your trading style.
What is Reticulata Enhanced?
The Reticulata core leverages a blend of MA/RSI strategies mixed with the Bull Bear Bots optimised logic for risk management. This enhanced version takes it a step further with additional risk management features:
Trailing Stop
Fixed Stop
Fixed Stop, but move at TP
Trend confirmation
Usage
Using the indicator is as simple as:
1. Select the strategy, or combination of strategies you want to use
2. If desired, select one or more of the available trend filters
3. Adjust your stop options
4. Review backtest results
Markets
Like the core, the enhanced algo also supports a range of markets and timeframes, including the majors (EURUSD, etc...) in Forex and a variety of Cryptocurrencies including Bitcoin (BTC/XBT etc...).
All of our scripts are designed for manual traders but are ready to use with automated trading bots.

Volume and Price Moving average StrategyNAME : Volume and Price Moving average Strategy
SUMMARY
Long when Indicator >= BuyandSell
Short when Indicator < BuyandSell
It is an index created by combining the moving average of trading volume and price.
To avoid future reference, you must set the Candle Chart time and Resolution Time equally.
If you set it differently, there is a gap in yield due to future reference.
For MA Type and MA period, it is to select what the moving average of the price will be set to.
For Indicator Value, it is about the set value of this indicator.
Price Type is what to use for price. Market price, low price, closing price, high price, typical price (market price + high price + low price) / 3, center (market price + high price) / 2
There are six types.
BuyandSell is to set the index value to enter and clear. The default is 0.
Although it can be set to 0 or more, there is a risk of over-optimization.
As you can see from the profit curve, Bitcoin is a good strategy that works well when volatility is high.
MDD is too large to operate with this indicator alone, so it would be good to use it with other indicators.
If you leave a good indicator comment, I'll test it. Thank you.
==========================
Korean
거래량과 가격의 이동평균을 조합하여 만든 지표입니다.
미래참조를 피하기 위해서는 반드시 캔들 차트의 시간과, Resolution Time을 똑같이 설정해야 합니다.
다르게 설정할 경우 미래참조로 인한 수익률 괴리가 생기니 꼭 똑같이 설정해주세요.
MA Type, MA period의 경우 가격의 이동평균을 무엇으로 설정할 것인지 선택하는 것 입니다.
Indicator Value의 경우 이 지표의 설정 값에 대한 것입니다.
Price Type은 가격으로 무엇을 사용할 것인지 입니다. 시가, 저가, 종가, 고가, Typical Price (시가+고가+저가)/3, Center(시가+고가)/2
이렇게 6종류가 있습니다.
BuyandSell은 진입, 청산할 지표값을 세팅하는 것입니다. 기본값 0입니다.
0이상, 이하로도 설정할 수 있지만, 그렇게 할 경우 과최적화의 위험이 있습니다.
수익 곡선을 보시면 아시겠지만 비트코인이 변동성이 클 때 잘 먹히는 좋은 전략입니다.
이 지표만으로는 MDD가 너무 커서 운용하기 힘드니 다른 지표와 같이 활용하시면 좋을 것 같습니다.
좋은 지표 코멘트로 남겨주시면 테스트 해보겠습니다. 감사합니다.

Why is it ok to backtest on TradingView from now on!TradingView backtester has bad reputation. For a good reason - it was producing wrong results, and it was clear at first sight how bad they were.
But this has changed. Along with many other improvements in its PineScript coding capabilities, TradingView fixed important bug, which was the main reason for miscalculations. TradingView didn't really speak out about this fix, so let me try :)
Have a look at this short code of a swing trading strategy (PLEASE DON'T FOCUS ON BACKTEST RESULTS ATTACHED HERE - THEY DO NOT MATTER). Sometimes entry condition happens together with closing condition for the already ongoing trade. Example: the condition to close Long entry is the same as a condition to enter Short. And when these two aligned, not only a Long was closed and Short was entered (as intended), but also a second Short was entered, too!!! What's even worse, that second short was not controlled with closing conditions inside strategy.exit() function and it very often lead to losses exceeding whatever was declared in "loss=" parameter. This could not have worked well...
But HOORAY!!! - it has been fixed and won't happen anymore. So together with other improvements - TradingView's backtester and PineScript is now ok to work with on standard candlesticks :)
Yep, no need to code strategies and backtest them on other platforms anymore.
----------------
Having said the above, there are still some pitfalls remaining, which you need to be aware of and avoid:
Don't backtest on HeikenAshi, Renko, Kagi candlesticks. They were not invented with backtesting in mind. There are still using wrong price levels for entries and therefore producing always too good backtesting results. Only standard candlesticks are reliable to backtest on.
Don't use Trailing Stop in your code. TradingView operates only on closed candlesticks, not on tick data and because of that, backtester will always assume price has first reached its favourable extreme (so 'high' when you are in Long trade and 'low' when you are in Short trade) before it starts to pull back. Which is rarely the truth in reality. Therefore strategies using Trailing Stop are also producing too good backtesting results. It is especially well visible on higher timeframe strategies - for some reason your strategy manages to make gains on those huge, fat candlesticks :) But that's not reality.
"when=" inside strategy.exit() does not work as you would intuitively expect. If you want to have logical condition to close your trade (for example - crossover(rsi(close,14),20)) you need to place it inside strategy.close() function. And leave StopLoss + TakeProfit conditions inside strategy.exit() function. Just as in attached code.
If you're working with pyramiding, add "process_orders_on_close=ANY" to your strategy() script header. Default setting ("=FIFO") will first close the trade, which was opened first, not the one which was hit by Stop-Loss condidtion.
----------------
That's it, I guess :) If you are noticing other issues with backtester and would like to share, let everyone know in comments. If the issue is indeed a bug, there is a chance TradingView dev team will hear your voice and take it into account when working on other improvements. Just like they heard about the bug I described above.
P.S. I know for a fact that more improvements in the backtesting area are coming. Some will change the game even for non-coding traders. If you want to be notified quickly and with my comment - gimme "follow".

Combo Backtest 123 Reversal & DSS Bressert This is combo strategies for get a cumulative signal.
First strategy
This System was created from the Book "How I Tripled My Money In The
Futures Market" by Ulf Jensen, Page 183. This is reverse type of strategies.
The strategy buys at market, if close price is higher than the previous close
during 2 days and the meaning of 9-days Stochastic Slow Oscillator is lower than 50.
The strategy sells at market, if close price is lower than the previous close price
during 2 days and the meaning of 9-days Stochastic Fast Oscillator is higher than 50.
Second strategy
Double Smoothed Stochastics (DSS) is designed by William Blaw.
It attempts to combine moving average methods with oscillator principles.
WARNING:
- For purpose educate only
- This script to change bars colors.

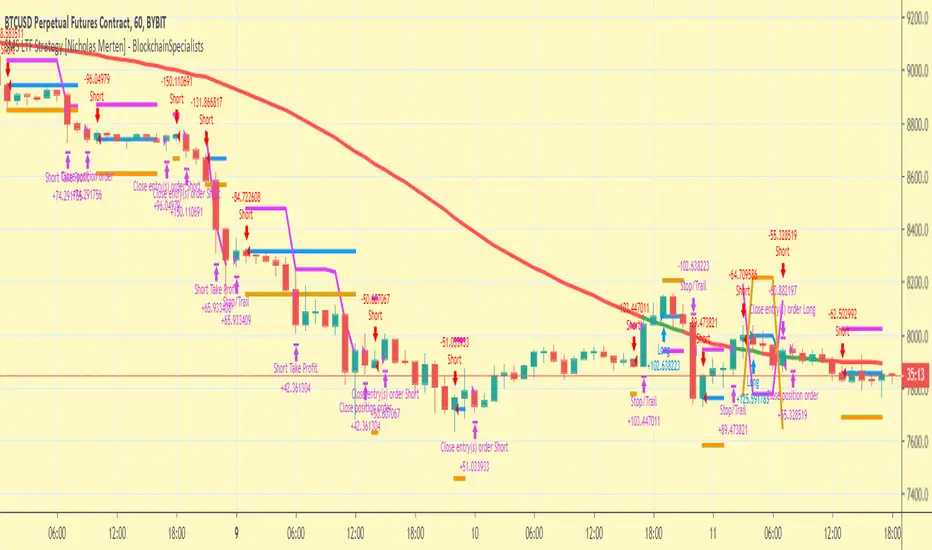
SMS LTF Strategy [Nicholas Merten] - BlockchainSpecialistsHi, this is my interpretation of the SMS indicator, optimised for Lower Time Frame Trading - previously coded by myself (see profile) and u/SandRocks99 - These versions can be found by searching for TradingView indicators with the title:
"SMS Indicator"
I would recommend checking these indicators out first, and joining the 'SMS Indicator Group' Telegram.
To keep things simple for testing ,and so users can get the hang of what is going on, I've removed a lot of the input settings to show how the strategy performs on default settings.
I would recommend only trading Crypto against USD pairs, as TradingView has some issues calculating performance against BTC or other Crypto pairs.
Performance on all USD pairs on ByBit seems to be promising.
If anyone feels like they can improve the performance, or has any ideas or aspirations for automating this strategy, please PM me.
Any issues, comment or let me know personally.
Thanks a lot.
Cracking Cryptocurrency - Bottom Feeder Strategy TesterBottom Feeder - Strategy Tester
The Bottom Feeder is designed to algorithmically detect significantly oversold conditions in price that represent profitable buying opportunities. Combining this with it’s unique Stop and Target System, the Bottom Feeder is designed to return consistent return with minimal draw down. Whether used as a Market Bottom Detector or as a system for executing safe, profitable mean reversion trades, the Bottom Feeder is a powerful tool in any trader’s arsenal.
Bottom Feeder was designed to be used on BTCUSD, however it is also effective on other USD/USDT pairs. One will have to check the individual pair they wish to trade with the Strategy Tester to simulate performance.
Strategy displayed is from 2018-2021 on **Conservative Mode** with Percent of Equity (30%) enabled.
Options
Let’s go through the input options one by one, so that you are able to comfortably navigate all that this indicator has to offer. The link below will display a picture of the layout of the settings for your convenience.
For the sake of simplicity, let’s note now that all settings marked **Conservative Mode** will not work in Aggressive Mode.
Mode : Determines how aggressively Bottom Feeder generates a buy signal. In Conservative Mode, trades can only be opened once per candle and the stop and target will update as new signals appear. In Aggressive Mode, a separate trade is opened each time Bottom Feeder signals, which may be multiple times within one Daily candle.
Position Sizing Strategy : Determines what Risk Management system you will deploy when trading Bottom Feeder. Your options are “Percent of Equity” and “Distance to Stop Loss”. If Percent of Equity is selected, a trade size will be equal to a percentage of your equity, pursuant to the value in the ‘Percent of Equity’ box. If Distance to Stop Loss is selected, then your Position Size will be determined based off the distance to your stop loss and the value in the ‘Risk Percentage’ box.
Percent Of Equity : Determines what percentage of your equity will be allocated to each trade when ‘Position Sizing Strategy’ is enabled.
Risk Percentage : Determines the size of each trade if ‘Distance to Stop Loss’ strategy is enabled. This value reflects what percent of your account you will lose per trade if the trade hits your stop loss.
Plot Target and Stop Loss : Toggles on/off the visualized take profit and stop losses on the chart.
**Conservative Mode** TP Multiplier : This is an input box, it requires a float value. That is, it can accept either a whole number integer or a number with a decimal. This number will determine your Take Profit target. It will take whatever number is entered into this box and multiply the Average True Range against it to determine your Take Profit.
**Conservative Mode** SL Multiplier : See above - this will modify your Stop Loss Value.
**Conservative Mode** Average or Median True Range : This is a drop-down option, the two options are Average True Range or Median True Range. If Average True Range is selected, then this indicator will use the Average True Range calculation, that is, the average of a historical set of True Range values to determine the Average True Range value for Target and Stop Loss calculation. If Median True Range is selected, it will not take an average and will instead take the Median value of your historical look back period.
**Conservative Mode** True Range Length : This is an input that requires an integer. This will represent your historical lookback period for Average/Median True Range calculation.
**Conservative Mode** True Range Smoothing : This is a drop-down with the following options: Exponential Moving Average ( EMA ), Simple Moving Average ( SMA ), Weighted Moving Average ( WMA ), Relative Moving Average (RMA). This will determine the smoothing type for calculating the Average True Range if it is selected. Note: if Median True Range is selected above, this option will not have any effect as there is no smoothing for a Median value.
**Conservative Mode** Custom True Range Value? : This is a true/false option that is false by default. If enabled, it will override the Average/Median True Range calculation in favor of a users custom True Range value to be input below.
**Conservative Mode** Custom True Range Value : This is an input box that requires a float value. If Custom True Range is enabled this is where a user will input their desired custom True Range value for Target and Stop Loss calculation.
From Month/Day/Year to Month/Day/Year : This sets the Time Frame of your backtest for the Bottom Feeder Strategy. It will run FROM the date selected TO the date selected.
Stop and Target Description
Because Bottom Feeder is designed only to scalp the various market bottoms that can appear over time in the market and not to identify trends or to trade ranges, it’s imperative that the indicator notify us not just to when to enter our trades, but when to exit! In the service of that, CC Bottom Feeder has a built in Stop and Target system that tracks and displays the stop loss and take profit levels of each individual open trade, whether in Aggressive or Conservative Mode.
Conservative Mode Targeting: In Conservative Mode, Bottom Feeder signals are aggregated into a compound trade. The signal will appear as a green label pointing up below a candle, and will appear upon a candle close. If Bottom Feeder then generates another signal the stop loss and target price will be updated. The process will continue until the aggregated trade completes in either direction. On a trade with multiple signals, a larger position is slowly entered into upon each buy signal.
Aggressive Mode Targeting: In Aggressive Mode, Bottom Feeder signals are individually displayed as they are generated, regardless of how many signals are generated on any single candle. If Bottom Feeder continues to signal, each individual open trade will have their own stop loss and target that will be displayed on the chart until the individual trade completes in either direction. As opposed to a large compound position, aggressive mode represents a higher number of independent signals with their own stop and target levels.
Stop losses and targets are designed to be hard, not soft. That is, they are intended to be stop market orders, not mental stop losses. If price wicks through the target or stop, it will activate.

Trendless MACD Strategy (Trendless Strategy Series -1 )I Try to eliminate the trend of the stock to see a clear version of the indicators. If you have any idea about that topic, you can send a message to me and we can improve this idea together.

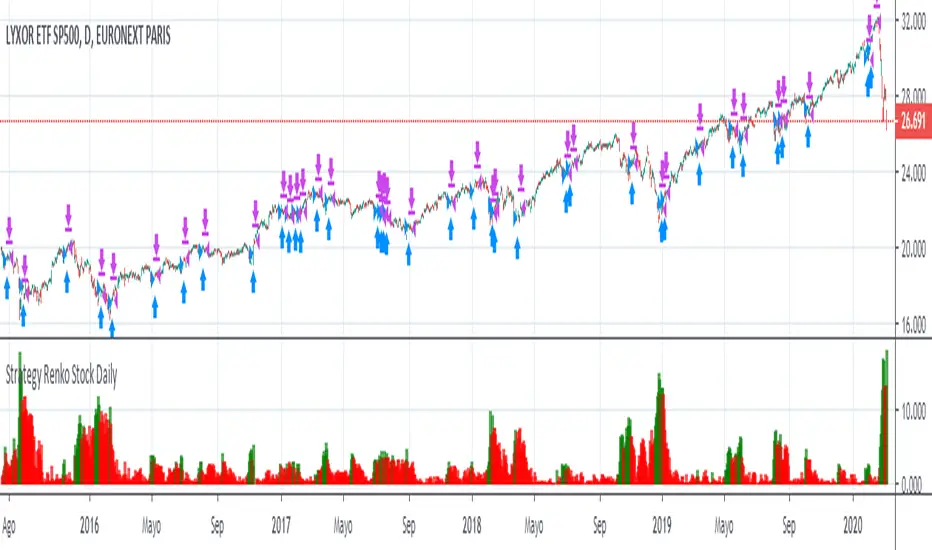
Renko Stock DailyHello,
This strategy must be use only for stocks. It doesnt work with FOREX or others..
You must use it only for renko candles
Best regards