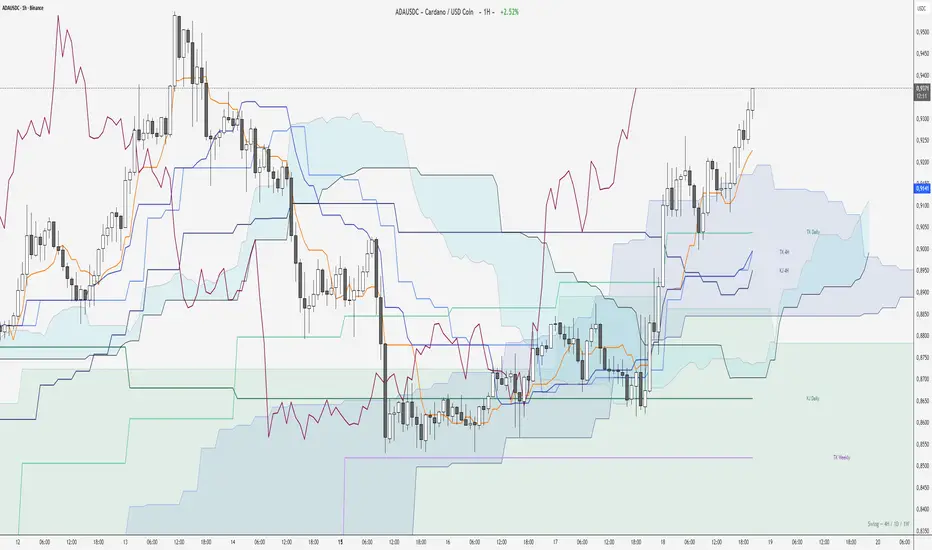
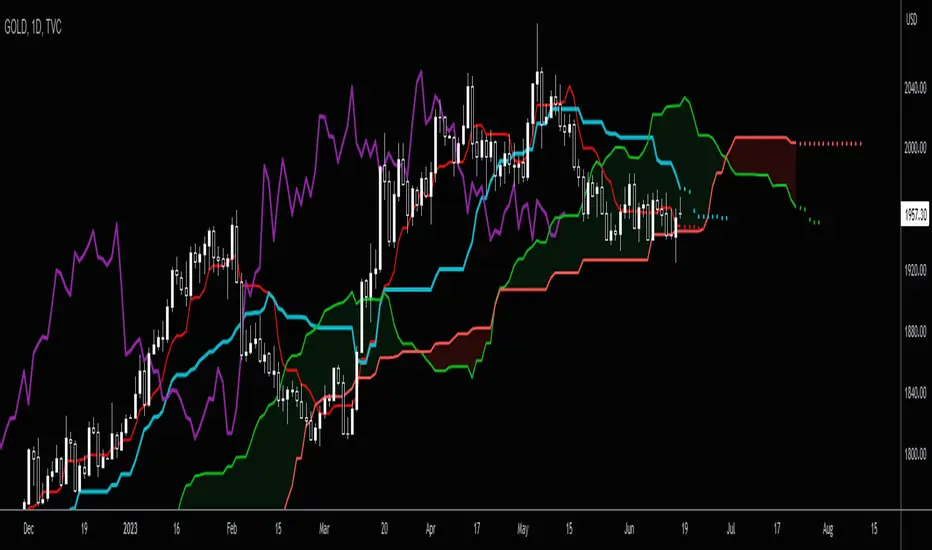
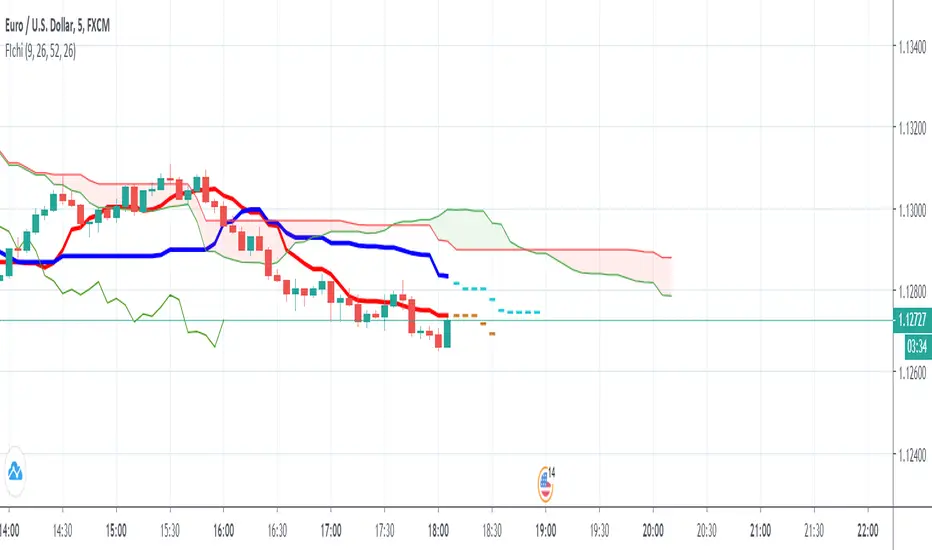
Ichimoku Horizon v2Ichimoku Horizon v2
Multi-timeframe Ichimoku. Pine Script v6.
lookahead_off, no-repaint. Chart timeframe + up to three higher horizons.
What’s new in v2
Presets (+ Custom mode).
Timeframe banner.
Lines and colors configurable per TF.
Right-side labels for Tenkan/Kijun + “Kumo TF” labels.
Preset structure
Timeframe 1 = short horizon → blue.
Timeframe 2 = medium horizon → green.
Timeframe 3 = long horizon → violet.
MTF display is automatic only when the selected TF is higher than the chart TF.
Calculation rules
Tenkan 9, Kijun 26, SSB 52, Displacement 26.
SSA = average(Tenkan, Kijun) projected +26.
SSB = (52-high + 52-low) / 2 projected +26.
Chikou = close plotted 26 periods back.
lookahead_off and no-repaint
lookahead_off: calculations use no future data. Lines update live while a bar forms, then freeze at close.
No-repaint: past values never change after close. Plots reflect the real-time state exactly.
Adjustable labels
Distance: per-TF right offset (in bars) to position labels.
Size and color: Tiny/Small/Normal/Large, color per TF.
Anti-overlap: automatic spacing when two labels share nearly the same price.
Disclaimer
Ichimoku Horizon is a decision-support tool. It guarantees no results and does not replace your analysis or training in trading and risk. Before risking capital, test on a demo account if possible. Match parameters to your asset and horizon. Markets are volatile: losses, including total loss, are possible. Use risk management.
Kijun
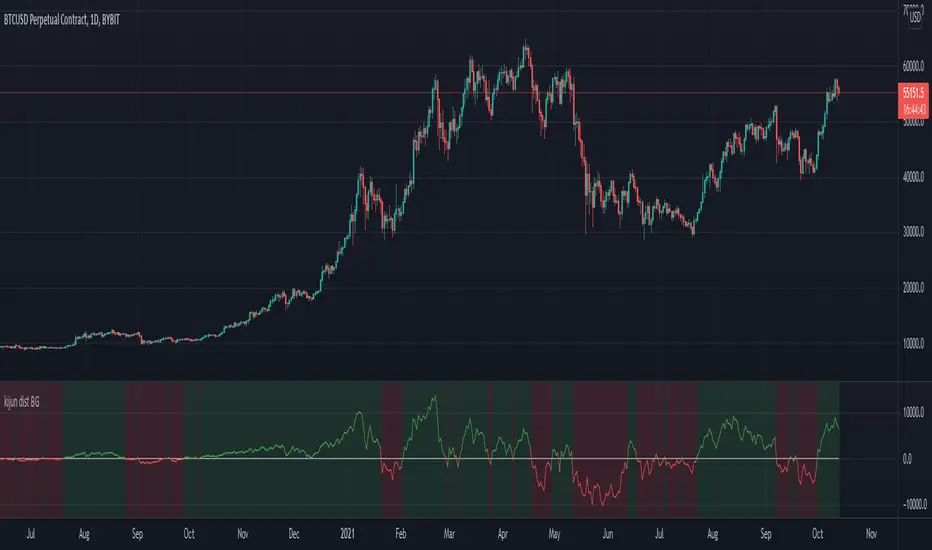
Kijun_ATROVERVIEW
Kijun + ATR is an indicator that combines Lagging Kijun Base Line From Ichimoku Cloud (direction indicator) and Volatility Indicator ATR.
By combining ATR with kijun we can filter out noise from Base Line.
CALCULATIONS
Kijun is calculated by taking average of lowest and highest point of price over set lenght.
ATR is just default Tradingview Indicator that calculates average true range of price over set period of time.
WORKING
When both close > lower and not close < upper are true indicator indicate long by color limeand indicates short when close < upper by color fuchsia (Color can be changed in settings)
Indicator works best in Trending Market Regimes can have problems by signaling tops in Consolidating Market Regimes during bear markets and by sygnaling bottom in short consolidating market regimes during bull market.

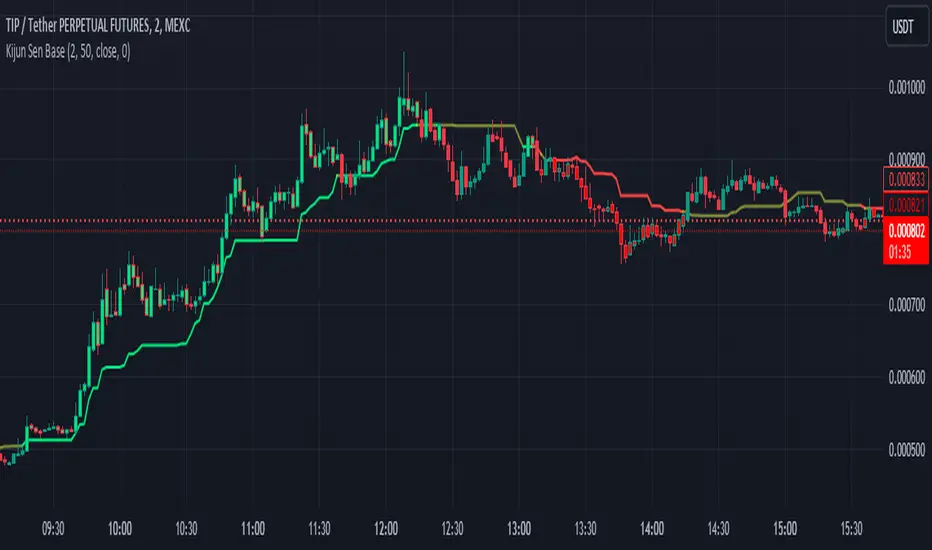
Kijun Sen BaseWhat is Kijun Sen?
Kijun-sen also means "base line" and is the mid-point of the 26-period high and low. Kijun-sen is typically used in conjunction with Tenkan-sen (conversion line) or (the 9-period midpoint price) to generate trade signals when they cross. Kijun-sen is typically used in conjunction with the other Ichimoku indicators.
What is the Kijun Sen Base?
The Kijun Sen Base is the center line in the Ichimoku Cloud Indicator. We have taken that line out and made it an indicator on its own , color-coded it, and allowed traders to track the price for a clean and simple base filter.
Is this a Moving Average?
NO
The Difference Between Kijun-sen (Base Line) and a Simple Moving Average (SMA)
The Kijun-sen is a midpoint of the high and low prices over the last 26 periods. This is not an average.
How do I trade with this Indicator?
Unless there's a lot of recent price movement, enough to pull the price away from the 26-period midpoint, the Kijun-sen will often trade near and intersect with the current price. At times like these, it is not an ideal tool for helping with trend direction. If, however, there is a strong price move away from Kijun Sen and the gap between Kijun Sen and the price is "increasing" or "widening", this is an indication that a trend is forming.
Kijun Sen Base can be used to confirm a trend and is a clean addition to other indicators the trader may use on their charts while at the same time keeping the chart less cluttered.
Happy Trading and Good Luck!
Simple Ichimoku Kinko Hyo Cloud█ OVERVIEW
This indicator as an educational and showcase the usage of user-defined types or objects (UDT) for Ichimoku Kinko Hyo or Ichimoku Cloud.
█ CREDITS
TradingView

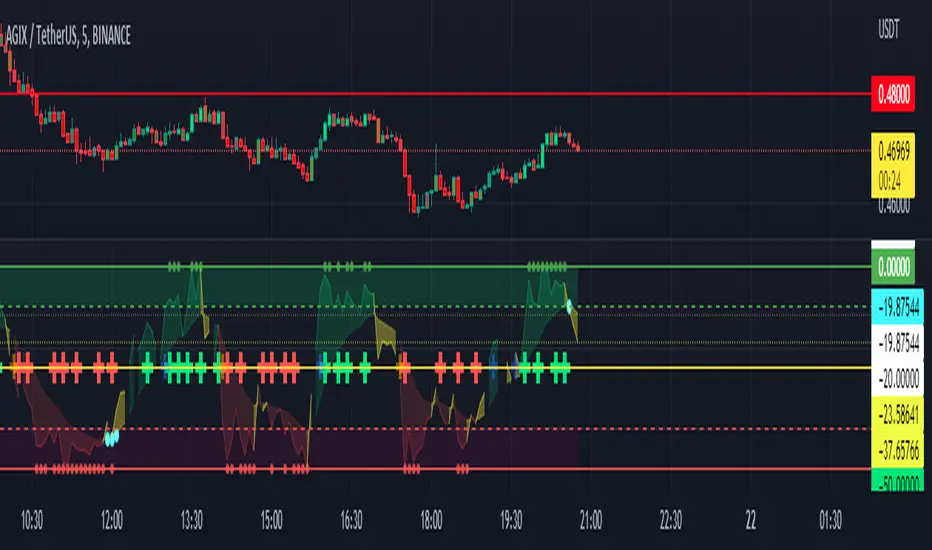
FOREX Master Pattern Trend Finder by nnamdertWhat does this Indicator do?
This indicator works by identifying Trends and "potential" shifts in trends before they happen. It is technically a momentum indicator that watches for specific Bullish or Bearish momentum (i.e. Bull Runs, and Crashes).
How does it do this?
It uses a custom script that takes into account extremes in price and certain moving averages and other accurate forward looking indicators. Once it finds a Bull run, signals are triggered in the form of PLUS signs. It does the same for strong Bearish trends. Based on how the script is configured, the Indicator is able to spot (in advance) unique movement in the trend that can predict a change in momentum prior to the change occurring.
These momentum changes can be configured as alerts.
As seen in the screenshot below the indicator triggers "early warning" signals when it detects a specific movement that is indicative of a potential change in momentum or trend. It does this IN ADVANCE of any change - it is ONLY A PREDICTION but allows the trader to look at the asset to determine if the potential change in trend is valid and gives the trader enough time to set up a trade and stop-loss.
As seen in the screenshot below color-coded candles allow the trader to visually SEE the change on the chart making it easier to get a quick glance at the current trend. In addition, Green and Red Crosses were added to the oscillator to help easily identify trends if the color coded candle feature is turned OFF. These Red and Green Crosses are not located at every highlighted bar location, rather, at the first bar that the alert was triggered on. If there was a gap in the trend, the alert triggers, and plots again when a new trend starts.
As seen in the screenshot below, when a strong trend is present in either direction, small red or green dots are plotted on the oscillator. This makes spotting past and current trends much easier. Even if the price is not moving up or down, this indicates strong underlying buying or selling pressure.
Some traders like using indicators as a reversal finder. Although this indicator is NOT A REVERSAL INDICATOR, I added a signal that can be used as a "potential" reversal finder. You can see this in the screenshot below.
These "reversal" signals typically appear prior to a move in the opposite direction (but not always). A stop-loss can be set at the high or low of the previous bar depending on direction.
At times, multiple "conflicting" warning signals appear back-to-back. This is indicative of a "crab" in the market. Basically, indecision is present in the market. These "early warning" signals are smaller and either BLUE or ORANGE . Once a trend is recognized, the signal will be either RED or GREEN and a bit larger.
Viewing a higher timeframe will allow Forex Master Pattern traders to easily spot contraction zones. I manually draw the lines in at these zones. These "Value Lines" are typically respected in the future. As shown in the screenshot below, the level acted as support in the future and a newer value line was created at a "higher level" - this indicates a Bullish momentum in price as buyers and sellers have agreed upon the higher price as a true value area.
As seen in the screenshot below, multiple potential reversal signals plotted on the chart indicate a "weakening' in the strength of the current trend. This allows the trader to strategically move their stop-loss or simply take some profits off the table at this level.
This Indicator does NOT overlay on the current chart but allows the trader to see color coded bars. Simply double clicking within the indicator will expand the indicator to full screen, and double clicking within the chart itself will hide the secondary pane but keep the candles visible on the chart.
Happy Trading and GOOD LUCK!
Ichimoku Buy/Sell Signals of manual MTF Tenkan crossing KijunIchimoku Buy/Sell Signals based on fast, small time frame Tenkans crossing longer timeframes Kijuns - Manual MTF Analysis
This code marks the potential change of direction based on the input of one timeframe's Ichimoku Tenkan (conversion) line crossing over a higher, longer timeframe's Ichimoku Kijun (base) line.
Feel free to change the inputs if need be and to hide the yellow box. Use Ichimoku rules of Tenkan, Kijun, Lagging Span, and Cloud for Take profit/Stop Losses. It is best to wait 3-5 minutes after the signal to enter to confirm the trend and to confirm if the Lagging Span has broken key levels. I refer to the book Trading with Ichimoku - A Practical Guide to Low-Risk Ichimoku Strategies by Karen Peloille as the Ichimoku rulebook. Good luck.
For day trading/scalping/intraday - 1min/3min/5min
Tenkan Line Timeframe = 1min
Kijun Line Timeframe = 5min
For swing trading - multiple days/weeks - 4HR/Daily/Weekly Charts
Tenkan Line Timeframe = day
Kijun Line Timeframe = week

SuperIchi [LuxAlgo]Using one indicator as the core for another one to improve certain aspects while offering an alternative user interaction can be very interesting in technical analysis.
This indicator is a modification of the popular Ichimoku indicator using the equally popular Supertrend indicator as its core, thus no longer entirely relying on calculations done over a fixed window size but instead relying on the average true range and the trend detection method offered by the Supertrend.
Settings
Tenkan: Atr length (left) and factor (right) used for the Supertrend involved in the calculations of the Tenkan Ichimoku component
Kijun: Atr length (left) and factor (right) used for the Supertrend involved in the calculations of the Kijun Ichimoku component
Senkou Span B: Atr length (left) and factor (right) used for the Supertrend involved in the calculations of the second Senkou Span Ichimoku component
Displacement: Bar offset of the cloud (positive offset) and Chikou (negative offset)
Usage
The SuperIchi indicator can be interpreted similarly to a regular Ichimoku as it retains the components and aspects from this one. Users can make use of the Supertrend Factor to detect shorter or longer-term trends.
Unlike the regular components of the Ichimoku based on rolling maximums/minimums, using the Supertrend here allows smoother components and makes it less prone to whipsaw signals.
Note that the Chikou is disabled by default in the style settings
Details
The original Ichimoku indicator is constructed from the average between the rolling maximum high and minimum low values. The Supertrend indicator also relies on one upper/lower extremity but using the average of these extremities for the modification of the Ichimoku indicator might not provide easy to use results due to the nature of these extremities.
Instead, we compute the average between the Supertrend and trailing maximums/minimums with a value reset when a new trend is detected by the Supertrend. This allows obtaining a result that is closer to the original average used by Ichimoku.

T/K CROSSSimple crossing of the Tenkan & Kijun Sen indicated by a "Cross". Surfed Tradingview for it, but did not find it, so decided to make one. Does NOT include the Ichimoku Cloud & the Chikou

Kijun Trend IndicatorName: Kijun Trend Indicator
Category: Trend Analysis
Timeframe: All timeframes
Suggested usage: In a trending market, to understand when it is good to enter short (red line) and when to enter long (blue line).
Technical Analysis: The original idea was taken from Larry Williams: an uptrend is identified when the price is above an 18-period simple moving average (SMA) and when at least two candles do not touch the simple moving average with their lows. The opposite is true for a downtrend.
Corrado Rondelli has therefore reinterpreted with Ichimoku aka "ichimokized" replacing the 18-period Simple Moving Average with the 26-period Kijun - as per the original Ichimoku settings.
In order to make the indicator more flexible an Exponential Moving Average (EMA) has also been added.
The indicator plots the chosen line that becomes red when it is good to enter short and blue when it is good to enter long.
Configuration:
- Length: period to be used to calculate the line.
- Type: the line type that can be the Kijun (26-period) or SMA/EMA (18-period)

niceLINES (Kijun-Sen & SMMA 5, 50)Welcome to niceLINES - a combination of key lines to help find entries/exits and also determine the trend. The indicators used are the Kijun-Sen and SMMA 5, 50.
A great tool for finding entries and exits is when the 5SMMA (green line) and the Kijun-Sen (purple line) cross. Best used on longer time frames such as 1hr and above.
The 50 SMMA (blue line) is a quick and simple look at what's happening over a longer period of time. Not necessarily used for entries or exits but great for determining if an asset is going to bounce or not. You can see from the chart that the bounces off the 50 SMMA would have been a nice zone to add to a long position. Helps let you know if your trade is still on course long term or possibly failing.

Ichimoku+Based on the ichimoku cloud system, this indicator gives two presets: Standard (9/26/52/26) and Crypto (20/60/120/30).
This also shows on a chart where Tenkan-Kijun cross happens and when a Kumo Twist happens.

TK Cross and Kumo Twist AlertBased on the ichimoku cloud system, this shows on a chart where Tenkan-Kijun cross happens and when a Kumo Twist happens.

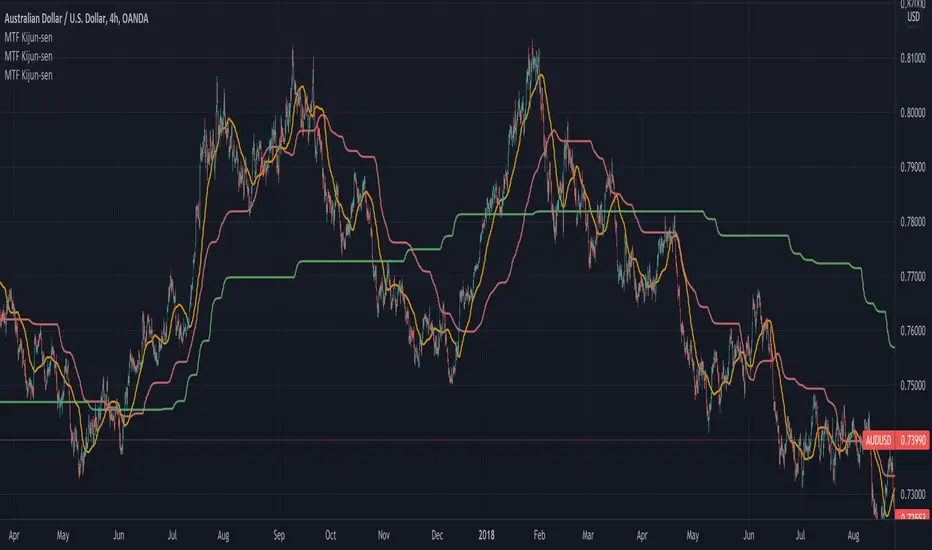
Multi Timeframe Kijun-sen [Takazudo]Multi Timeframe Kijun-sen implementation. Kijun-sen is a part of Ichimoku Kinko-hyo. This study is intented to be used as a part of buy/sell strategies.
This may be useful for lower timeframe entries.
This Kijun-sen script can be smooth using MA.
Ichimoku by HosodaWritten from scratch Ichimoku indicator, based on original calculations from Hosoda books. All formulas are exactly the same as Hosoda put them in his books, it contains additionally analysis from Higher Timeframe allowing to display Chikou trend, Kijun and Senkou-span B which are crucial in determining trend. It also contains overlay of Kyushu Legs. This is initial version of script and will be contanstly improved.
Some Ichimoku scripts have basic bugs in calculations and I ensure that formulas in this indicator are fully correct in relation to formulas provided by Hosoda.

Future Ichimoku LinesFuture Ichimoku Lines Plot: Tenkan-sen next 5 days, Kijun-sen next 10 days, Kumo A next 5 days and Kumo B next 14 days will be display
This will help you forecast the future of price and increase winning probability!
Always remember, risk management is the key of a successful trader
Have a nice trade! :D
Ichimoku Line CounterThis simple script will help you seen the range of Kijun-sen, Tenkan-sen and Senkou span B. You can use it to analyze the direction of Ichimoku components. Very useful for Ichimoku trader!
Example: how many days Kijun, Kumo, ... still flat or become flat?
We use the default number: 9, 26 and 52. You absolutely can modify it if your system use different numbers :P
Have a nice trade! :D
ICHIMOKU forecast öngörü Hi every Ichimoku Users,
ichimoku is a very useful indicator. It works very well in short periods.İ t helps me define market trends, find entry and follow.
However, it may take a lot of time to calculate which direction the lines will go.( kijun. tenkan and clouds). In the short-term charts, this is not what we want.
I'm sure you said yes.
ichimoku forecast will do this now.
will show us the next 3 candles.
ICHIMOKU FORECAST (öngörü) strengths:
- Forecast future +3 candles will make clouds, tenkan, kijun go!
- Help you indentify easy trend when clouds change, kijun go up or down!
- you can change colors, displacement, hide/show lines in its.
- Flexible and good for every timeframe: W, D, 4H, 1H and shorter.
- Flexible and good for every currencies, gold , future and more.
Test it, watch it, you'll see it works.

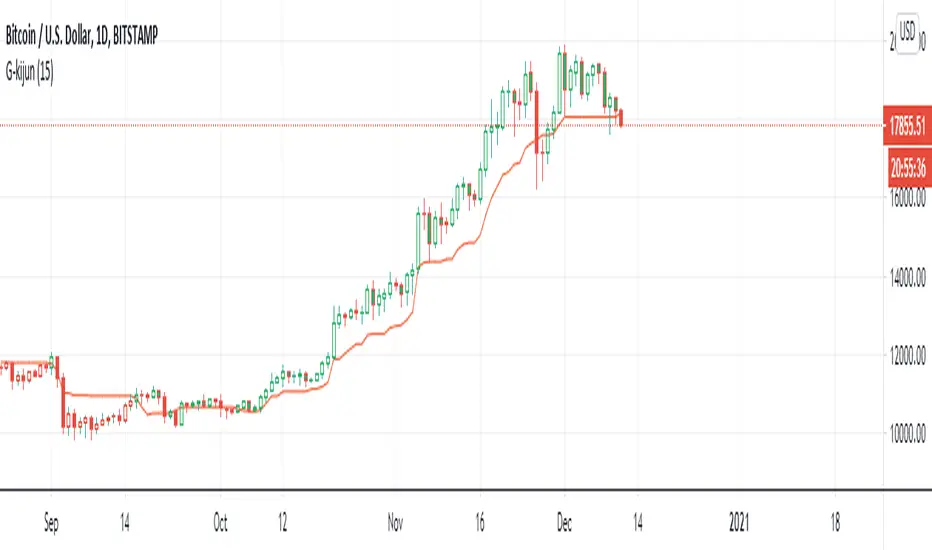
G-Kijun trailing stopThis indicator is the part of ichimoku kyo hyo.
I luv kijun-sen very much
kijun-sen is develop form (Highest - Lowest)/2
It's mean 50% of fibonacci
and I create color Green for price over the kijun-sen when the price cross down the kijun-sen it'sll be Red
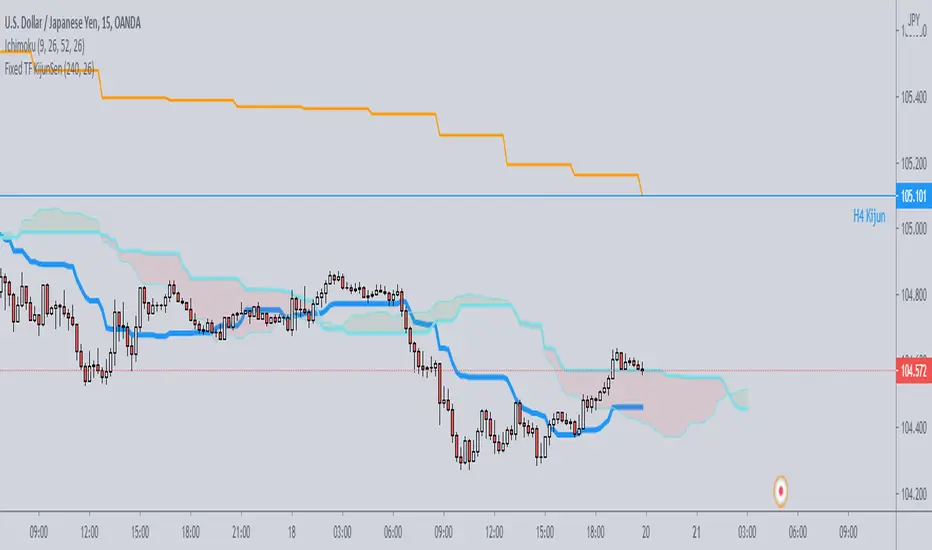
Fixed TF KijunSenJust a simple script which plots on any timeframe the kijunsen of a single specific timeframe, selectable by the user.
Useful for strategies which need to work on various timeframes, but need the kijun of that specific timeframe to be always visible for the analysis.
Ichimoku +FutureKijunIt's a simple code that will show you the future Kijun and Tenkan, assuming that no new High or Low will be submitted.
Kijun-Price DistanceThis script shows optional:
- distance between close price and Kijun-Sen
- distance btween Tenkan-Sen and Kijun-Sen
- Background color of current time frame
- Background color of the next higher time frame
Levels - [Silver-Wong]Draw a line on the right with indicator of what is set :
- EMA
- WMA
- MA
- Ichimoku Tenkan
- Ichimoku Kijun
In all inportant EMAs and timeframes
- MA/EMA/WMA 13, 20, 50, 100, 200
- 1H, 4H, 12H, Daily, Weekly

RSI with BGThis is a standard RSI indicator with Background colour and the option to draw the Background colour of the next higher timeframe.
Unfortunately, the 3D timeframe is not working properly (weekly background is not displayed). This is the same problem as with the MACD BG study.
