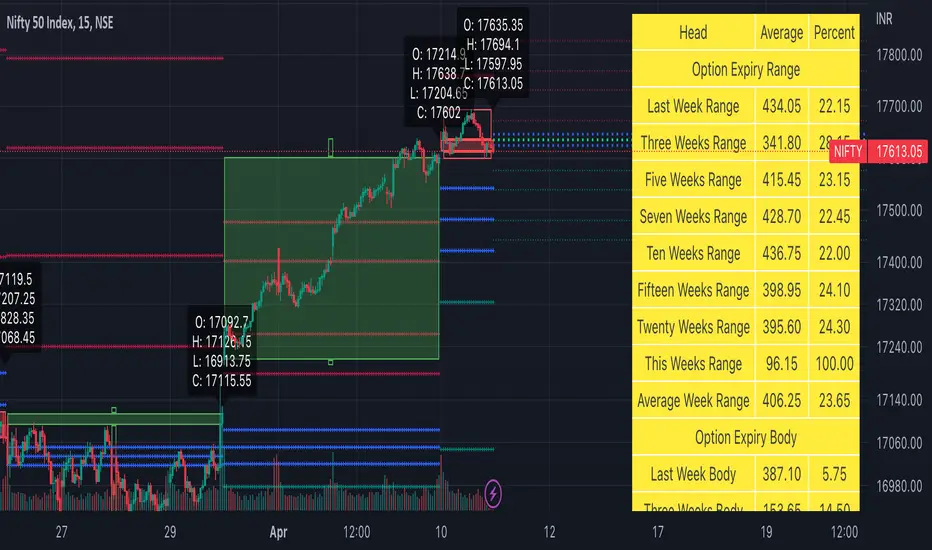
Weekly Options Expiry Candle V.2In India Weekly options expire on Thursday and that creates a different price action candle than the week timeframe.
My previous script Weekly Options Expiry Candle has some limitations. This script overcame those limitations and added some features.
You can use this in any intraday time frame candle.
It will show:
All expiry candle in box format
Expiry OHLC label
Pivot (Floor or Fibonacci) based on expiry OHLC data
Developing Expiry candle and Pivot
A table showing expiry range(high-low) and Expiry body abs(open-close) stats.
You can turn on or off any feature.
Please let me know if you found this script useful or have any questions or suggestions.
NSE:BANKNIFTY
NSE:NIFTY
Indianmarket
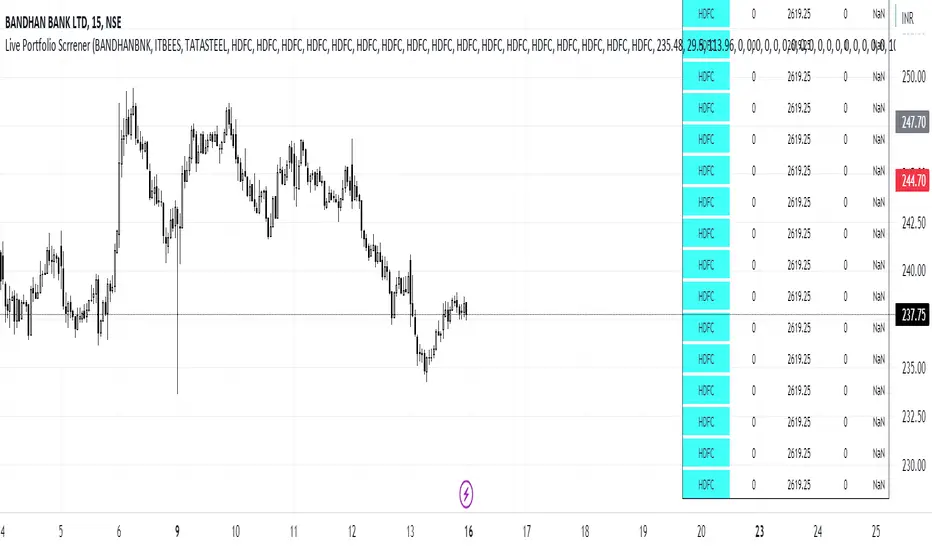
Live Portfolio ScreenerThe live portfolio screener indicator is a tool that help users to track the performance of their investments in real-time. The indicator provides a detailed breakdown of the user's portfolio, including the current profit and loss (P&L) for each stock that is invested in. This allows users to quickly and easily see how their portfolio is performing and make informed decisions about their investments on charts. Overall, this tool is an essential tool for anyone looking to stay on top of their investments and make data-driven decisions.
This indicator can load any symbol globally usable.
How to use this indicator ?
in this indicator firstly
you have add script name. (For example if you want to add symbol you have add in 's01 ' means the first symbol)
after that
you have to add price for each (For example if you want to add buy price for the first symbol then add the buy price in ' Bp01 ')
then the quantity comes in picture which is below price list and named here as Bq01 which means 'Buy quantity for first symbol'
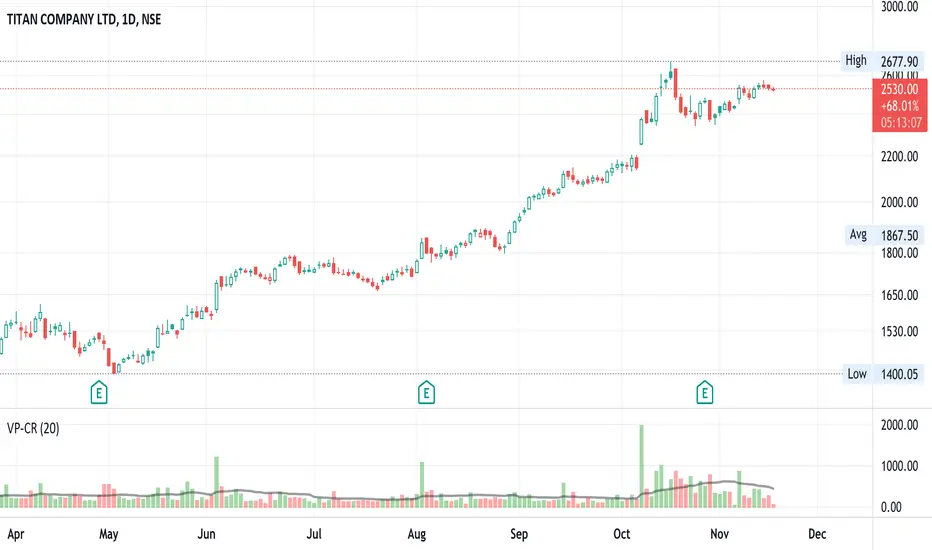
Volume x Price in Crores + RVolScript is designed predominantly for Indian users. Many are used to looking at numbers in lakhs and crores vs millions and billions, this provides a volume figure in rupee crores.
Formula is last close_price x volume / 1 cr or (close_price x volume /10000000). The second figure is the simple moving average (default to 20sma ) again in rupee crores. The third is the relative volume - todays volume / 20 day moving average.
Helpful especially when putting on a trade for a thinly traded stock. It is a quick gauge to how large or small one would want to buy or avoid. Helps manage risk. Also, great to see large volumes in crores to gauge institutional buys or sells.
On 10/NOV/21 - In the chart displayed here, Titan volumes are on average quite substantial as one can see. The 20 day moving average is 550 CR+. 10/NOV volumes are shown as 226 CR and the RVOL is 0.41 (226/550).