120x ticker screener (composite tickers)In specific circumstances, it is possible to extract data, far above the 40 `request.*()` call limit for 1 single script .
The following technique uses composite tickers . Changing tickers needs to be done in the code itself as will be explained further.
⎯⎯⎯⎯⎯⎯⎯⎯⎯⎯⎯⎯⎯⎯⎯⎯⎯⎯⎯⎯⎯⎯⎯⎯⎯⎯⎯⎯⎯⎯⎯⎯⎯⎯⎯⎯⎯⎯⎯⎯⎯⎯⎯⎯⎯⎯⎯⎯⎯⎯⎯⎯⎯⎯⎯
🔶 PRINCIPLE
Standard example:
c1 = request.security('MTLUSDT' , 'D', close)
This will give the close value from 1 ticker (MTLUSDT); c1 for example is 1.153
Now let's add 2 tickers to MTLUSDT; XMRUSDT and ORNUSDT with, for example, values of 1.153 (I), 143.4 (II) and 0.8242 (III) respectively.
Just adding them up 'MTLUSDT+XMRUSDT+ORNUSDT' would give 145.3772 as a result, which is not something we can use...
Let's multiply ORNUSDT by 100 -> 14340
and multiply MTLUSDT by 1000000000 -> 1153000000 (from now, 10e8 will be used instead of 1000000000)
Then we make the sum.
When we put this in a security call (just the close value) we get:
c1 = request.security('MTLUSDT*10e8+XMRUSDT*100+ORNUSDT', 'D', close)
'MTLUSDT*10e8+XMRUSDT*100+ORNUSDT' -> 1153000000 + 14340 + 0.8242 = 1153014340.8242 (a)
This (a) will be split later on, for example:
1153014330.8242 / 10e8 = 1.1530143408242 -> round -> in this case to 1.153 (I), multiply again by 10e8 -> 1153000000.00 (b)
We subtract this from the initial number:
1153014340.8242 (a)
- 1153000000.0000 (b)
–––––––––––––––––
14340.8242 (c)
Then -> 14340.8242 / 100 = 143.408242 -> round -> 143.4 (II) -> multiply -> 14340.0000 (d)
-> subtract
14340.8242 (c)
- 14340.0000 (d)
––––––––––––
0.8242 (III)
Now we have split the number again into 3 tickers: 1.153 (I), 143.4 (II) and 0.8242 (III)
⎯⎯⎯⎯⎯⎯⎯⎯⎯⎯⎯⎯⎯⎯⎯⎯⎯⎯⎯⎯⎯⎯⎯⎯⎯⎯⎯⎯⎯⎯⎯⎯⎯⎯⎯⎯⎯⎯⎯⎯⎯⎯⎯⎯⎯⎯⎯⎯⎯⎯⎯⎯⎯⎯⎯
In this publication the function compose_3_() will make a composite ticker of 3 tickers, and the split_3_() function will split these 3 tickers again after passing 1 request.security() call.
In this example:
t46 = 'BINANCE:MTLUSDT', n46 = 10e8 , r46 = 3, t47 = 'BINANCE:XMRUSDT', n47 = 10e1, r47 = 1, t48 = 'BINANCE:ORNUSDT', r48 = 4 // T16
•••
T16= compose_3_(t48, t47, n47, t46, n46)
•••
= request.security(T16, res, )
•••
= split_3_(c16, n46, r46, n47, r47, r48)
🔶 CHANGING TICKERS
If you need to change tickers, you only have to change the first part of the script, USER DEFINED TICKERS
Back to our example, at line 26 in the code, you'll find:
t46 = 'BINANCE:MTLUSDT', n46 = 10e8 , r46 = 3, t47 = 'BINANCE:XMRUSDT', n47 = 10e1, r47 = 1, t48 = 'BINANCE:ORNUSDT', r48 = 4 // T16
( t46 , T16 ,... will be explained later)
You need to figure out how much you need to multiply each ticker, and the number for rounding, to get a good result.
In this case:
'BINANCE:MTLUSDT', multiply number = 10e8, round number is 3 (example value 1.153)
'BINANCE:XMRUSDT', multiply number = 10e1, round number is 1 (example value 143.4)
'BINANCE:ORNUSDT', NO multiply number, round number is 4 (example value 0.8242)
The value with most digits after the decimal point by preference is placed to the right side (ORNUSDT)
If you want to change these 3, how would you do so?
First pick your tickers and look for the round values, for example:
'MATICUSDT', example value = 0.5876 -> round -> 4
'LTCUSDT' , example value = 77.47 -> round -> 2
'ARBUSDT' , example value = 1.0231 -> round -> 4
Value with most digits after the decimal point -> MATIC or ARB, let's pick ARB to go on the right side, LTC at the left of ARB, and MATIC at the most left side.
-> 'MATICUSDT', LTCUSDT', ARBUSDT'
Then check with how much 'LTCUSDT' and 'MATICUSDT' needs to be multiplied to get this: 5876 0 7747 0 1.0231
'MATICUSDT' -> 10e10
'LTCUSDT' -> 10e3
Replace:
t46 = 'BINANCE:MTLUSDT', n46 = 10e8 , r46 = 3, t47 = 'BINANCE:XMRUSDT', n47 = 10e1, r47 = 1, t48 = 'BINANCE:ORNUSDT', r48 = 4 // T16
->
t46 = 'BINANCE:MATICUSDT', n46 = 10e10 , r46 = 4, t47 = 'BINANCE:LTCUSDT', n47 = 10e3, r47 = 2, t48 = 'BINANCE:ARBUSDT', r48 = 4 // T16
DO NOT change anything at t46, n46,... if you don't know what you're doing!
Only
• tickers ('BINANCE:MTLUSDT', 'BINANCE:XMRUSDT', 'BINANCE:ORNUSDT', ...),
• multiply numbers (10e8, 10e1, ...) and
• round numbers (3, 1, 4, ...)
should be changed.
There you go!
🔶 LIMITATIONS
🔹 The composite ticker fails when 1 of the 3 isn't in market in the weekend, while the other 2 are.
That is the reason all tickers are crypto. I think it is possible to combine stock,... tickers, but they have to share the same market hours.
🔹 The number cannot be as large as you want, the limit lays around 15-16 digits.
This means when you have for example 123, 45.67 and 0.000000000089, you'll get issues when composing to this:
-> 123045670.000000000089 (21 digits)
Make sure the numbers are close to each other as possible, with 1 zero (or 2) in between:
-> 1.230045670089 (13 digits by doing -> (123 * 10e-3) + (45.67 * 10e-7) + 0.000000000089)
🔹 This script contains examples of calculated values, % change, SMA, RMA and RSI.
These values need to be calculated from HTF close data at current TF (timeframe).
This gives challenges. For example the SMA / %change is not a problem (same values at 1h TF from Daily data).
RMA , RSI is not so easy though...
Daily values are rather similar on a 2-3h TF, but 1h TF and lower is quite different.
At the moment I haven't figured out why, if someone has an idea, don't hesitate to share.
The main goal of this publication is 'composite tickers ~ request.security()' though.
🔹 When a ticker value changes substantially (x10, x100), the multiply number needs to be adjusted accordingly.
🔶 SETTINGS
SHOW SETS
SET
• Length : length of SMA, RMA and RSI
• HTF : Higher TimeFrame (default Daily)
TABLE
• Size table : \ _ Self-explanatory
• Include exchange name : /
• Sort : If exchange names are shown, the exchanges will be sorted first
COLOURS
• CH%
• RSI
• SMA (RMA)
DEBUG
Remember t46 , T16 ,... ?
This can be used for debugging/checking
ALWAYS DISABLE " sort " when doing so.
Example:
Set string -> T1 (tickers FIL, CAKE, SOL)
(Numbers are slightly different due to time passing by between screen captures)
Placing your tickers at the side panel makes it easy to compare with the printed label below the table (right side, 332201415014.45 ),
together with the line T1 in the script:
t1 = 'BINANCE:FILUSDT' , n1 = 10e10, r1 = 4, t2 = 'BINANCE:CAKEUSDT' , n2 = 10e5 , r2 = 3, t3 = 'BINANCE:SOLUSDT' , r3 = 2 // T1
FIL : 3.322
CAKE: 1.415
SOL : 14.56
Now it is easy to check whether the tickers are placed close enough to each other, with 1-2 zero's in between.
If you want to check a specific ticker, use " Show Ticker" , see out initial example:
Set string -> T16
Show ticker -> 46 (in the code -> t46 = 'BINANCE:MTLUSDT')
(Set at 0 to disable " check string " and NONE to disable " Set string ")
-> Debug/check/set away! 😀
🔶 OTHER TECHNIQUES
• REGEX ( Regular expression ) and str.match() is used to delete the exchange name from the ticker, in other words, everything before ":" is deleted by following regex:
exch(t) => incl_exch ? t : str.match(t, "(?<=:) +")
• To sort, array.sort_indices() is used (line 675 in the code), just as in my first "sort" publication Sort array alphabetically - educational
aSort = arrT.copy()
sort_Indices = array.sort_indices(id= aSort, order= order.ascending)
• Numbers and text colour will adjust automatically when switching between light/dark mode by using chart.fg_color / chart.bg_color
🔹 DISCLAIMER
Please don't ask me for custom screeners, thank you.
HTF

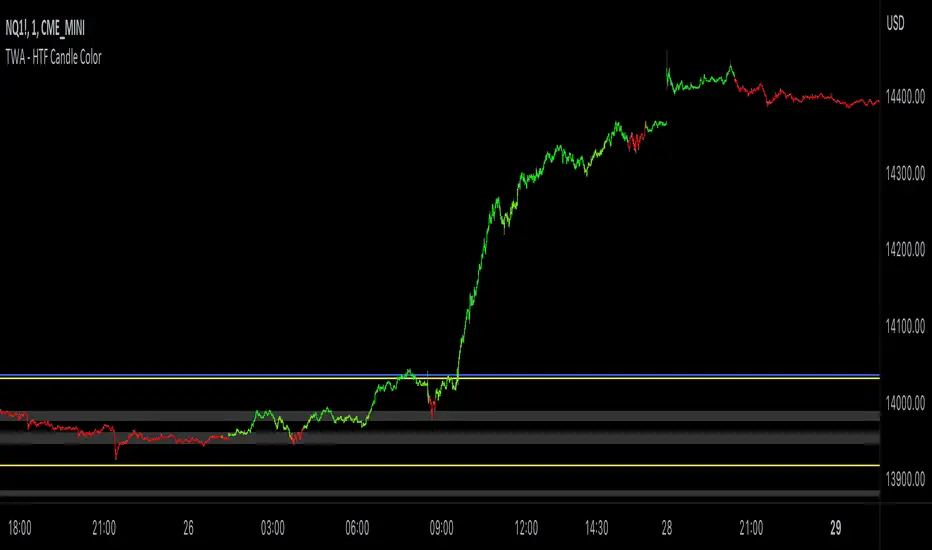
TWA - HTF Candle ColorOverview:
This indicator is designed to assist trend traders by confirming the market's direction on a higher timeframe and providing overlays to determine the strength and longevity of the current trend. Its goal is to help traders develop a probability-based mindset, enabling them to remain in profitable trades for longer periods and to identify when the trend might be shifting.
Main features and how to use:
The main feature of the indicator is the green and red coloring of the candles. The candles can be used to determine market direction and use that bias to pick a trading direction. The contrarian candle overlay is another useful feature that helps trend traders identify potential trend reversals. To use this feature, traders should wait until the overlay candle coloring "clicks off" to determine the probability that the current move has reached its peak or bottom and to look for a larger retracement. The unique flexibility of this feature allows trend traders to see both sides of the story.
Calculations and what makes this original:
- It finds breaks of common fibonacci retracement and extension values on a higher time frame using my proprietary williams % R indicator to find
trend direction
- To help add more confirmation to trend direction the proprietary algorithm combines the above fibonacci breaks with confirmation from price
breaking beyond multiple deviations measured from bollinger bands.
- From your current charts timeframe it automatically calculates which higher timeframe to analyze.
- The above algorithm from the higher timeframe is distilled down to a green or red candle color on the chart to show market direction.
- It uses a blend of rsi and CCI to calculate contrarian candle coloring to show trend exhaustion.
Additional features
Contrarian candle coloring:
The contrarian candle coloring feature is designed to help trend traders see possible reversals. It overlays a different candle color on top of the HTF candles at certain periods. The unique feature of this addition is its ability to transform a trend-following indicator into a tops and bottom reversion indicator all in one. This flexibility allows traders to see both the contrarian and trend-following perspectives.
Enhanced probability:
This feature helps traders determine the probability of their potential trades long-running potential by changing the background color to green or red. Traders can use this information to help define their risk per trade. For example, if the candle coloring matches the background color, they might choose a long-running move, whereas if the candle coloring does not match the background color, they might opt for a scalping trade. The unique feature of this addition is how it gives traders the ability to view the market from different perspectives all on one screen.
Use Alternate Symbol:
Allows for the candle color to be derived from a separate symbol than the current chart .
Candle Color as Line:
Plots a line across the top or bottom of the chart showing the current color which allows users the ability to use an additional indicator that colors candles.
Contrarian Color as Line:
Plots a line across the top or bottom of the chart showing the current candle color which allows users the ability to use an additional indicator that colors candles.
Candle Color as Background:
Colors the chart background the color of the current HTF candle color which allows users the ability to use an additional indicator that colors candles.
Increase Market Sensitivity:
Quickens the response time for candles to change color which can be helpful for scalping on 1 minute charts.
ALERTS
- Get an alert when the candle color changes to green or red
-Get an alert when the enhanced probability color changes to green or red
-Get an alert when the candle color and enhanced probability color align green or red
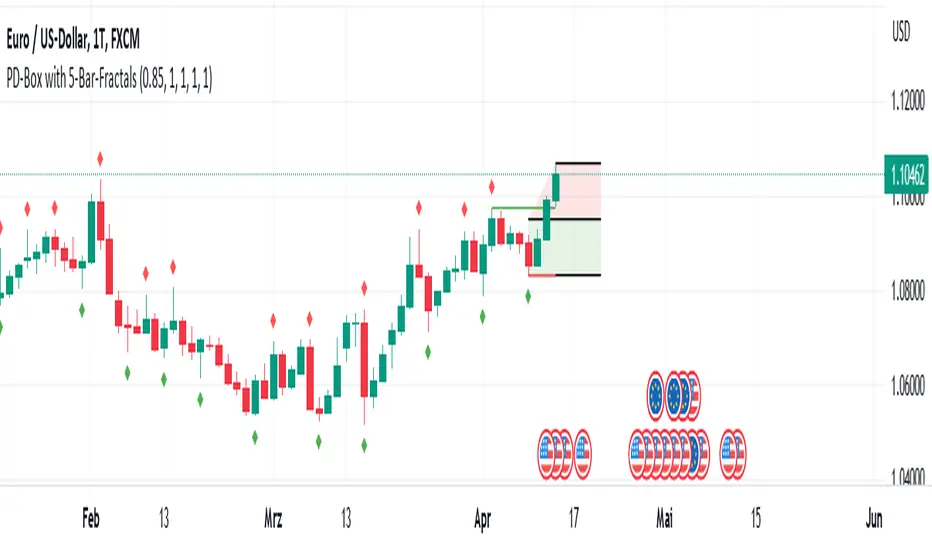
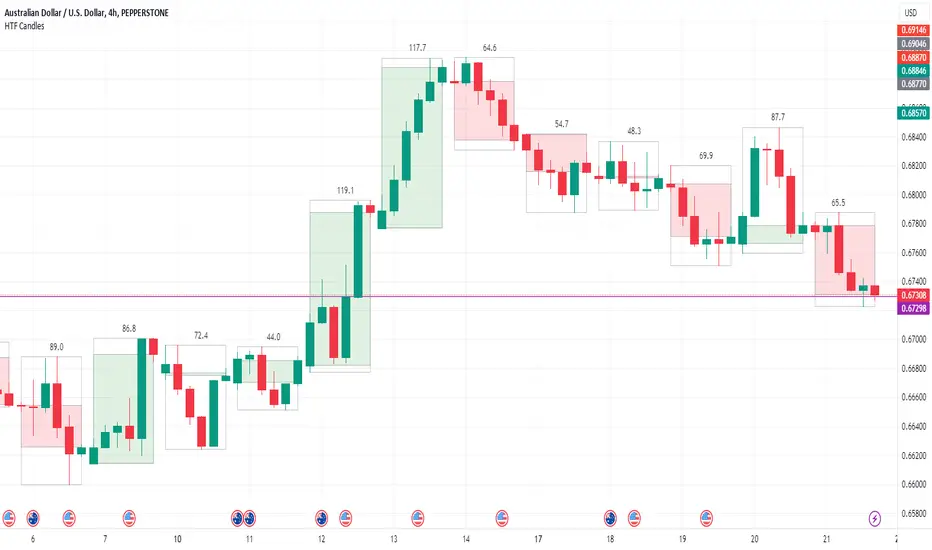
PD-Box with Fractal Points V1 (by Jonny86FXPro)PD-Box with Fractal Points V1 (by Jonny86FXPro)
This indicator has several functions:
Premium/Discount Box: The two most recent fractal highs and lows form a premium/discount box that provides valuable information about potential price movements.
Fractal Breaker Lines: Two fractal breaker lines are integrated for the high and low points to better visually represent the break of a fractal point.
Customizable: The genius of this indicator is that you can customize everything to your own needs. Whether you want to display lines, or change the colors of the box or lines, everything is possible.
Automatic Adjustment: Once a fractal point is broken, the premium discount automatically adjusts to the current price. Once a new fractal point is formed, the box is automatically adjusted again.
HTF Analysis: Use this indicator for your HTF analysis and determine in which direction the price could develop.
Premium Discount Box Information: When the price is in the premium range, there is a higher probability of a sell-off. However, if the price breaks upward, there is a good chance that it will continue to rise. The opposite is true for the discount range.
Power Behind Each Move: It is important how the price hits the fractal point. If there is power behind each move, the chances are very good that it will continue in that direction. If there is no real power behind it, it could be an indication of a trend reversal.
Weak Breaks: In the premium range, a weak upward break could lead to a bearish move, and in the discount range, a weak downward break through the fractal low point could lead to a move in the bullish direction.
As you can see, this powerful indicator has many functions that can help you determine trend direction and potential price movements.
Quick overview of functions:
Designed for higher timeframes such as 4H chart.
Identifies the last two fractal highs and lows to create a premium/discount box.
Includes two fractal breaker lines for the high and low points to better visually represent fractal breaks.
Customizable to fit individual needs, including the ability to show/hide lines and change box/line colors.
Automatically adjusts premium/discount levels to current price when a fractal point is broken.
Can be used for higher timeframe analysis to determine potential price direction.
Premium/discount box provides insight into potential market direction based on price movement within its range.
Fractal break with strong market momentum indicates a higher chance of trend continuation.
Fractal break with weak market momentum may suggest a potential trend reversal.
A powerful indicator that can greatly assist in determining trend direction.
Market Structure & Liquidity: CHoCHs+Nested Pivots+FVGs+Sweeps//Purpose:
This indicator combines several tools to help traders track and interpret price action/market structure; It can be divided into 4 parts;
1. CHoCHs, 2. Nested Pivot highs & lows, 3. Grade sweeps, 4. FVGs.
This gives the trader a toolkit for determining market structure and shifts in market structure to help determine a bull or bear bias, whether it be short-term, med-term or long-term.
This indicator also helps traders in determining liquidity targets: wether they be voids/gaps (FVGS) or old highs/lows+ typical sweep distances.
Finally, the incorporation of HTF CHoCH levels printing on your LTF chart helps keep the bigger picture in mind and tells traders at a glance if they're above of below Custom HTF CHoCH up or CHoCH down (these HTF CHoCHs can be anything from Hourly up to Monthly).
//Nomenclature:
CHoCH = Change of Character
STH/STL = short-term high or low
MTH/MTL = medium-term high or low
LTH/LTL = long-term high or low
FVG = Fair value gap
CE = consequent encroachement (the midline of a FVG)
~~~ The Four components of this indicator ~~~
1. CHoCHs:
•Best demonstrated in the below charts. This was a method taught to me by @Icecold_crypto. Once a 3 bar fractal pivot gets broken, we count backwards the consecutive higher lows or lower highs, then identify the CHoCH as the opposite end of the candle which ended the consecutive backwards count. This CHoCH (UP or DOWN) then becomes a level to watch, if price passes through it in earnest a trader would consider shifting their bias as market structure is deemed to have shifted.
•HTF CHoCHs: Option to print Higher time frame chochs (default on) of user input HTF. This prints only the last UP choch and only the last DOWN choch from the input HTF. Solid line by default so as to distinguish from local/chart-time CHoCHs. Can be any Higher timeframe you like.
•Show on table: toggle on show table(above/below) option to show in table cells (top right): is price above the latest HTF UP choch, or is price below HTF DOWN choch (or is it sat between the two, in a state of 'uncertainty').
•Most recent CHoCHs which have not been met by price will extend 10 bars into the future.
• USER INPUTS: overall setting: SHOW CHOCHS | Set bars lookback number to limit historical Chochs. Set Live CHoCHs number to control the number of active recent chochs unmet by price. Toggle shrink chochs once hit to declutter chart and minimize old chochs to their origin bars. Set Multi-timeframe color override : to make Color choices auto-set to your preference color for each of 1m, 5m, 15m, H, 4H, D, W, M (where up and down are same color, but 'up' icon for up chochs and down icon for down chochs remain printing as normal)
2. Nested Pivot Highs & Lows; aka 'Pivot Highs & Lows (ST/MT/LT)'
•Based on a seperate, longer lookback/lookforward pivot calculation. Identifies Pivot highs and lows with a 'spikeyness' filter (filtering out weak/rounded/unimpressive Pivot highs/lows)
•by 'nested' I mean that the pivot highs are graded based on whether a pivot high sits between two lower pivot highs or vice versa.
--for example: STH = normal pivot. MTH is pivot high with a lower STH on either side. LTH is a pivot high with a lower MTH on either side. Same applies to pivot lows (STL/MTL/LTL)
•This is a useful way to measure the significance of a high or low. Both in terms of how much it might be typically swept by (see later) and what it would imply for HTF bias were we to break through it in earnest (more than just a sweep).
• USER INPUTS: overall setting: show pivot highs & lows | Bars lookback (historical pivots to show) | Pivots: lookback/lookforward length (determines the scale of your pivot highs/lows) | toggle on/off Apply 'Spikeyness' filter (filters out smooth/unimpressive pivot highs/lows). Set Spikeyness index (determines the strength of this filter if turned on) | Individually toggle on each of STH, MTH, LTH, STL, MTL, LTL along with their label text type , and size . Toggle on/off line for each of these Pivot highs/lows. | Set label spacer (atr multiples above / below) | set line style and line width
3. Grade Sweeps:
•These are directly related to the nested pivots described above. Most assets will have a typical sweep distance. I've added some of my expected sweeps for various assets in the indicator tooltips.
--i.e. Eur/Usd 10-20-30 pips is a typical 'grade' sweep. S&P HKEX:5 - HKEX:10 is a typical grade sweep.
•Each of the ST/MT/LT pivot highs and lows have optional user defined grade sweep boxes which paint above until filled (or user option for historical filled boxes to remain).
•Numbers entered into sweep input boxes are auto converted into appropriate units (i.e. pips for FX, $ or 'handles' for indices, $ for Crypto. Very low $ units can be input for low unit value crypto altcoins.
• USER INPUTS: overall setting: Show sweep boxes | individually select colors of each of STH, MTH, LTH, STL, MTL, LTL sweep boxes. | Set Grade sweep ($/pips) number for each of ST, MT, LT. This auto converts between pips and $ (i.e. FX vs Indices/Crypto). Can be a float as small or large as you like ($0.000001 to HKEX:1000 ). | Set box text position (horizontal & vertical) and size , and color . | Set Box width (bars) (for non extended/ non-auto-terminating at price boxes). | toggle on/off Extend boxes/lines right . | Toggle on/off Shrink Grade sweeps on fill (they will disappear in realtime when filled/passed through)
4. FVGs:
•Fair Value gaps. Represent 'naked' candle bodies where the wicks to either side do not meet, forming a 'gap' of sorts which has a tendency to fill, or at least to fill to midline (CE).
•These are ICT concepts. 'UP' FVGS are known as BISIs (Buyside imbalance, sellside inefficiency); 'DOWN' FVGs are known as SIBIs (Sellside imbalance, buyside inefficiency).
• USER INPUTS: overall setting: show FVGs | Bars lookback (history). | Choose to display: 'UP' FVGs (BISI) and/or 'DOWN FVGs (SIBI) . Choose to display the midline: CE , the color and the line style . Choose threshold: use CE (as opposed to Full Fill) |toggle on/off Shrink FVG on fill (CE hit or Full fill) (declutter chart/see backtesting history)
////••Alerts (general notes & cautionary notes)::
•Alerts are optional for most of the levels printed by this indicator. Set them via the three dots on indicator status line.
•Due to dynamic repainting of levels, alerts should be used with caution. Best use these alerts either for Higher time frame levels, or when closely monitoring price.
--E.g. You may set an alert for down-fill of the latest FVG below; but price will keep marching up; form a newer/higher FVG, and the alert will trigger on THAT FVG being down-filled (not the original)
•Available Alerts:
-FVG(BISI) cross above threshold(CE or full-fill; user choice). Same with FVG(SIBI).
-HTF last CHoCH down, cross below | HTF last CHoCH up, cross above.
-last CHoCH down, cross below | last CHoCH up, cross above.
-LTH cross above, MTH cross above, STH cross above | LTL cross below, MTL cross below, STL cross below.
////••Formatting (general)::
•all table text color is set from the 'Pivot highs & Lows (ST, MT, LT)' section (for those of you who prefer black backgrounds).
•User choice of Line-style, line color, line width. Same with Boxes. Icon choice for chochs. Char or label text choices for ST/MT/LT pivot highs & lows.
////••User Inputs (general):
•Each of the 4 components of this indicator can be easily toggled on/off independently.
•Quite a lot of options and toggle boxes, as described in full above. Please take your time and read through all the tooltips (hover over '!' icon) to get an idea of formatting options.
•Several Lookback periods defined in bars to control how much history is shown for each of the 4 components of this indicator.
•'Shrink on fill' settings on FVGs and CHoCHs: Basically a way to declutter chart; toggle on/off depending on if you're backtesting or reading live price action.
•Table Display: applies to ST/MT/LT pivot highs and to HTF CHoCHs; Toggle table on or off (in part or in full)
////••Credits:
•Credit to ICT (Inner Circle Trader) for some of the concepts used in this indicator (FVGS & CEs; Grade sweeps).
•Credit to @Icecold_crypto for the specific and novel concept of identifying CHoCHs in a simple, objective and effective manner (as demonstrated in the 1st chart below).
CHoCH demo page 1: shifting tweak; arrow diagrams to demonstrate how CHoCHs are defined:
CHoCH demo page 2: Simplified view; short lookback history; few CHoCHs, demo of 'latest' choch being extended into the future by 10 bars:
USAGE: Bitcoin Hourly using HTF daily CHoCHs:
USAGE-2: Cotton Futures (CT1!) 2hr. Painting a rather bullish picture. Above HTF UP CHoCH, Local CHoCHs show bullish order flow, Nice targets above (MTH/LTH + grade sweeps):
Full Demo; 5min chart; CHoCHs, Short term pivot highs/lows, grade sweeps, FVGs:
Full Demo, Eur/Usd 15m: STH, MTH, LTH grade sweeps, CHoCHs, Usage for finding bias (part A):
Full Demo, Eur/Usd 15m: STH, MTH, LTH grade sweeps, CHoCHs, Usage for finding bias, 3hrs later (part B):
Realtime Vs Backtesting(A): btc/usd 15m; FVGs and CHoCHs: shrink on fill, once filled they repaint discreetly on their origin bar only. Realtime (Shrink on fill, declutter chart):
Realtime Vs Backtesting(B): btc/usd 15m; FVGs and CHoCHs: DON'T shrink on fill; they extend to the point where price crosses them, and fix/paint there. Backtesting (seeing historical behaviour):

ICT HTF Candles (fadi)Plotting a configurable higher timeframe on current chart's timeframe helps visualize price movement without changing timeframes. It also plots FVG and Volume Imbalance on the higher timeframe for easier visualization.
With ICT concepts, we usually wait for HTF break of structure and then find an entry on a lower timeframe. With this indicator, we can set it to the HTF and watch the develop of price action until the break of structure happens. We can then take an entry on the current timeframe.
Settings
HTF Higher timeframe to plot
Number of candles to display The number of higher timeframe candles to display to the right of current price action
Body/Border/Wick The candle colors for the body, border, and wick
Padding from current candles The distance from current timeframe's candles
Space between candles Increase / decrease the candle spacing
Candle width The size of the candles
Imbalance
Fair Value Gap Show / Hide FVG on the higher timeframe
Volume Imbalance Show / Hide Volume Imbalance on the higher timeframe
Trace
Trace lines Extend the OHLC lines of the higher timeframe and the source of each
Label Show/Hide the price levels of the OHLC

JZ_Chaikin HTF Volatility BreakoutFirst off, all credit to Harry Potter as this is a minor customization of his indicator.
Basic additions:
-- Added a Higher Timeframe that is set to Daily but can be changed. Timeframe does wait until barstate.isconfirmed so won't repaint.
-- Added HMA smoothing line to both Chart and HTF. Can be used as it's own signal, as confirmation or in combination with faster signal line -- Breakout signal & Range Highlight use both.
-- Added optional coloring of HMA based on whether increasing or decreasing.
-- Added a low volatility option that highlights Range/No Trade zones. Defval is off so needs to be selected from inputs.
Breakout Signals are very simple and both take the HTF signal and HMA. When the faster Volatility line rises from below zero and comes within the range of -10 to 0, AND the HMA signals is increasing (and also below zero) for confirmation, generates a breakout signal of an incoming big move. You can alter the breakout threshold to be greater or less than -10, I just found that works best for filtering out the noise and false signals. Won't catch everything, but pretty reliable when it does.
Tested mostly on BTC so can't vouch for other assets and would likely need modification.
I've JUST taught myself coding from scratch (and to say I'm an amateur is an understatement), so apologies in advance if anything is unclear or could be coded better. Open to any suggestions.
MTF Candle [Pt]The Multi-Timeframe (MTF) Candle Tool is a powerful indicator designed for traders who wish to analyze standard candle bars and Heikin Ashi candles of multiple timeframes simultaneously. This tool is ideal for traders who prefer to trade in higher timeframes while keeping a close eye on the lower timeframes for confirmation signals. The indicator works by overlaying standard candle bars or Heikin Ashi candles of a higher timeframe onto the current chart. This allows traders to quickly switch between the current timeframe and the higher timeframe, without having to switch charts.
Features
- Live, real time updating MTF candle
- Custom colors
- Heikin Ashi candle
- Heikin Ashi Inside bar highlight

Simple ICT Order Blocks and Fair Value Gaps by Gowtham KannakajeThis scripts identifies ICT Order Block and ICT Fair Value Gaps
Fair Value Gap:
- Fair Value Gap toggle is off by default
- Users can choose to color the bars having Fair Value Gaps or can select to define the Fair Value Gap using boxes.
- Bar color and box colors can be customized
Order Blocks:
- Order Block box and candle color toggle is on by default
- Users can choose to color the Order Block candles or can select to define the Order Blocks using boxes.
- Bar color and box colors can be customized for bullish and bearish Order Block separately
Note:
- Order Blocks are considered valid only if the candle forming the Fair Value Gap closes away from the Order Block.
- Since Trading View limits the number of boxes to 500, it is advised to use the Color Candle option to identify the Order Blocks or Fair Value Gaps which are very old.
New concept Definitions:
Naked OB : An order block whose immediate next candle forms a Fair Value Gap. Here, the Order Block high or low contributes to the formation of Fair Value Gap.
Covered OB : An order block whose immediate next candle doesn't form a Fair Value Gap. Here, the Order Block high or low doesn't contribute to the formation of Fair Value Gap. Instead it will have other candles in between the Order Block and Fair Value Gap.
Disclaimer: The usage of this indicator might or might not contribute to your profits and losses and the author is not responsible for the same.
Happy Trading.

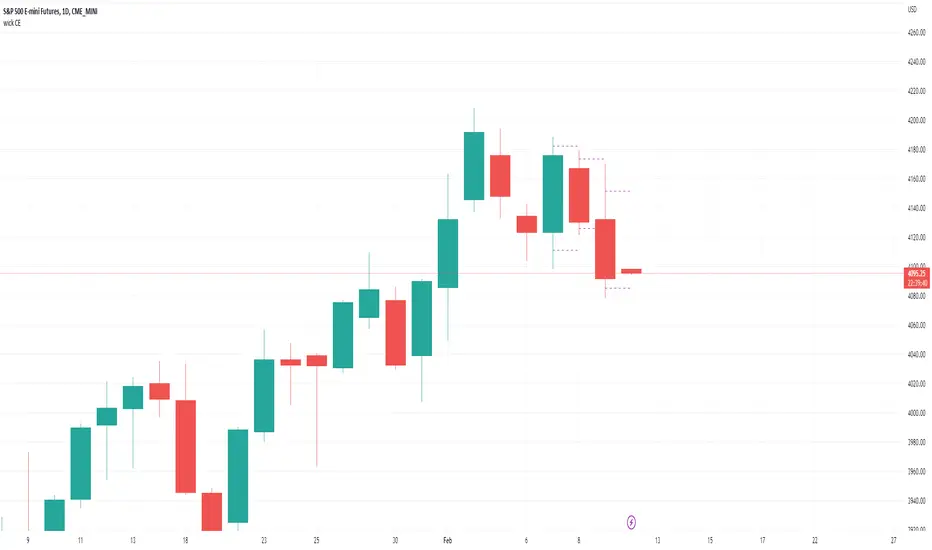
wick CE; plot candle wick and tail midpoint lines-Simple little tool to plot the wick CE: an ICT concept, consequent encroachment i.e. the midpoint line of a wick or tail; it being a potentially sensitive level (depending on context).
-Wrote this to save me time drawing out fib retracement to locate the precise level of the wick CE. Example usage: show indicator, add horizontal ray over favored wick CE level, hide indicator.
~choose how many consecutive bars back to plot wick CE lines.
~choose how many bars forward to extend the wick CE lines.
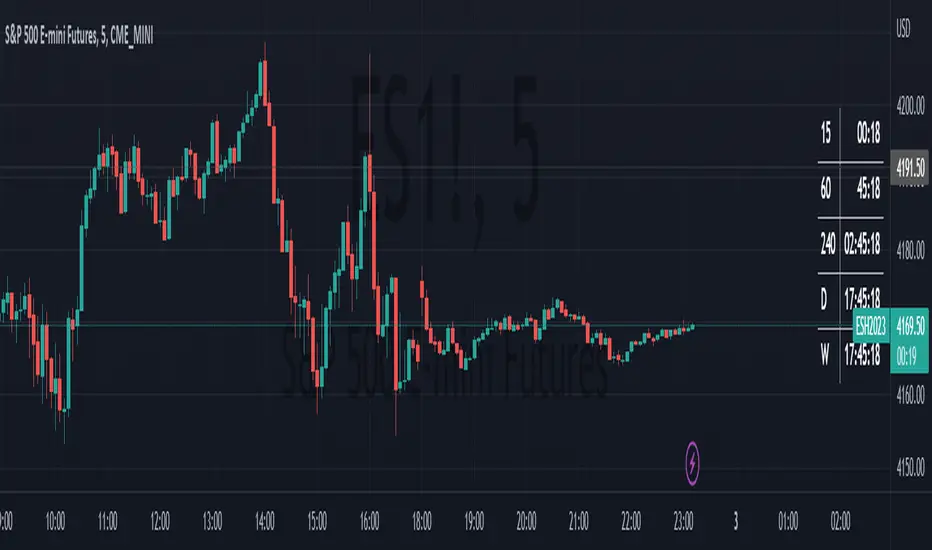
HTF Bar Close CountdownThis simple indicator displays a countdown for the amount of time left until a bar of your chosen timeframe closes.
Displays up to 5 different HTF countdowns.
Fully Customizable to fit any style, change the text colors, background colors, frame colors, display size and border & frame widths.
Flat display option for a sleek look to mesh with your charts.
Notes/Tips:
Higher Time Frames only! This is only intended to view HTF countdowns, will not work when trying to use a timeframe lower than your current chart's.
Some weird timeframes do not work, you'll know when.
Only works on live charts! Will display "Closed" when on an inactive chart.
Does not work for replay! A countdown is pretty pointless on a replay that is not real-time anyways...
Enjoy!
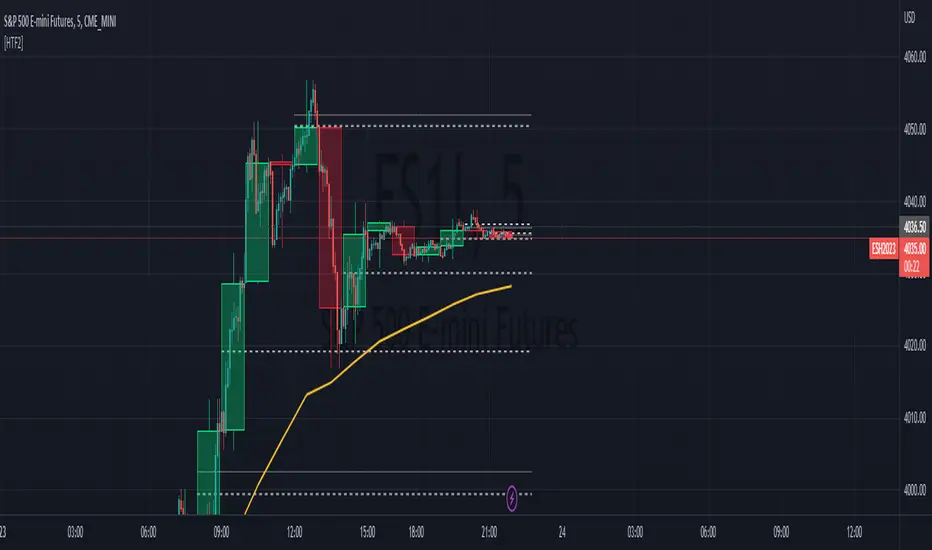
HTF Tool 2HTF Tool 2: Because the previous version was removed for being too powerful.
HTF Tool allows Users to display Higher Timeframe(HTF) Candles on their Chart with retracement lines drawn from the (High/Low) range of the HTF candle, as well as a live HTF MA.
This indicator perfectly handles Requested data to display a non-lagging HTF Moving Average(MA) by bridging a solid historical data stream with the live data stream.
This is done by offsetting plot data backwards to the middle of the last HTF candle, and then drawing a line from the last candle middle, to the live candle middle.
I have manipulated the data display to give the appearance that it consists of only 1 plot line, Whereas in reality, The HTF MA consists of 3 different processes:
- 1 historical plot value, to display the (correct) historical EMA with the same plot points you would see on the HTF chart from the same ema.
- 1 live line, re-drawn at every tick to mimic the way plot values move around while the bar is live.
- 1 live plot value, that is only displayed as a number on the status line and price scale to make it look like these are the outputs from the constantly redrawing line.
Because of this, This indicator displays the exact same way you would see this data on the requested timeframe's chart .
Note: You will see 2 values on the status line, these are the Historic MA, and Live MA values (Left, Right).
When hovering over historic values, a Historic MA value will only display in the middle of the HTF bars (same bar as the HTF wick)
This indicator include:
- HTF Candles, Drawn in the Traditional Candlestick Fashion.
- A User Adjustable HTF EMA / SMA , This Moving Average is accurate the the display you would see on a HTF chart.
- User Adjustable Retracement lines, up to 3 levels. These levels dynamically delete when price crosses them.
- Adjustable Display Range to display more or less HTF candles.
- Toggleable "Safe Mode" to keep the indicator display looking clean at all times.*
All Colors are Customizable to fit your layout style (Candle, Levels, HTF MA)
*Safe mode checks that your current chart's timeframe cleanly multiplies into your requested timeframe an odd number of times. This keeps the HTF candle wicks perfectly centered, and keeps the candle body width perfectly consistent.
If you choose to turn safe mode off here are some things to consider:
All Vertical data is consistent with the HTF requested , ONLY the horizontal alignment of the indicator will be thrown off.
When on low timeframes requesting other relatively low timeframes these issues are extremely more apparent than when requesting substantially larger timeframes.
Example: Safe Mode will likely need to be turned off for any 4h chart request, but as seen in the following image, the bars still look very normal.
Note: If you ONLY want to see the Levels and Moving Average... You ARE capable of requesting the current chart's timeframe. If you do this, the indicator will stop drawing the HTF candles, since your chart already shows that timeframe's candles.
Enjoy!
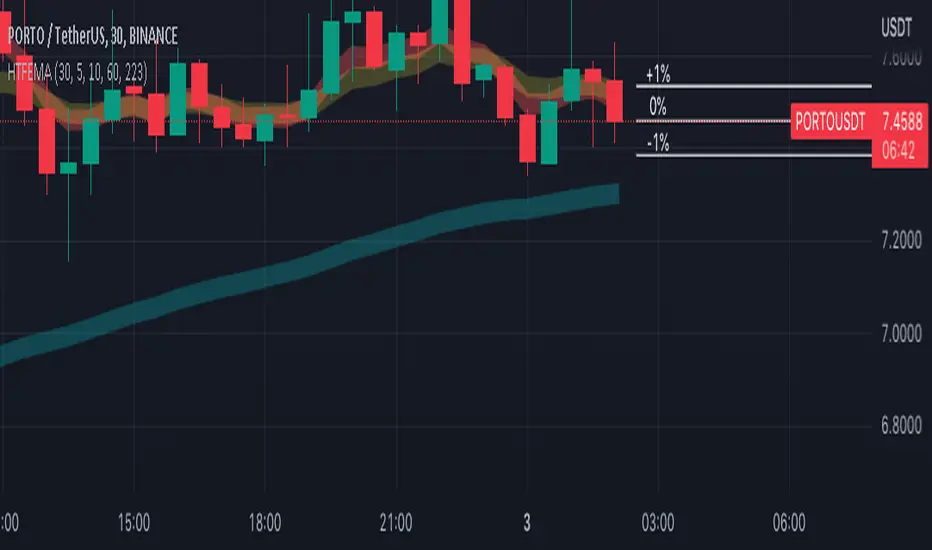
Higher Time Frame EMAs and 1% volatility indicatorSet the "higher time frame" (HTF) from which the EMAs will be calculated in all timeframes.
Example: I chose timeframe 1D and I will see the EMAs from TF 1D also in smaller TF as 1, 5, 30, 60 minutes.
There are 4 EMAs. The default values are 5, 10, 60 and 223 periods from "Scalping the Bull" indicator.
You can change the periods of each EMA.
The indicator have also a volatility indication, showing -1% and +1% price levels.
Rsi/W%R/Stoch/Mfi: HTF overlay mini-plotsOverlay mini-plots for various indicators. Shows current timeframe; and option to plot 2x higher timeframes (i.e. 15min and 60min on the 5min chart above).
The idea is to de-clutter chart when you just want real-time snippets for an indicator.
Useful for gauging overbought/oversold, across timeframes, at a glance.
~~Indicators~~
~RSI: Relative strength index
~W%R: Williams percent range
~Stochastic
~MFI: Money flow index
~~Inputs~~
~indicator length (NB default is set to 12, NOT the standard 14)
~choose 2x HTFs, show/hide HTF plots
~choose number of bars to show (current timeframe only; HTF plots show only 6 bars)
~horizontal position: offset (bars); shift plots right or left. Can be negative
~vertical position: top/middle/bottom
~other formatting options (color, line thickness, show/hide labels, 70/30 lines, 80/20 lines)
~~tips~~
~should be relatively easy to add further indicators, so long as they are 0-100 based; by editing lines 9 and 11
~change the vertical compression of the plots by playing around with the numbers (+100, -400, etc) in lines 24 and 25

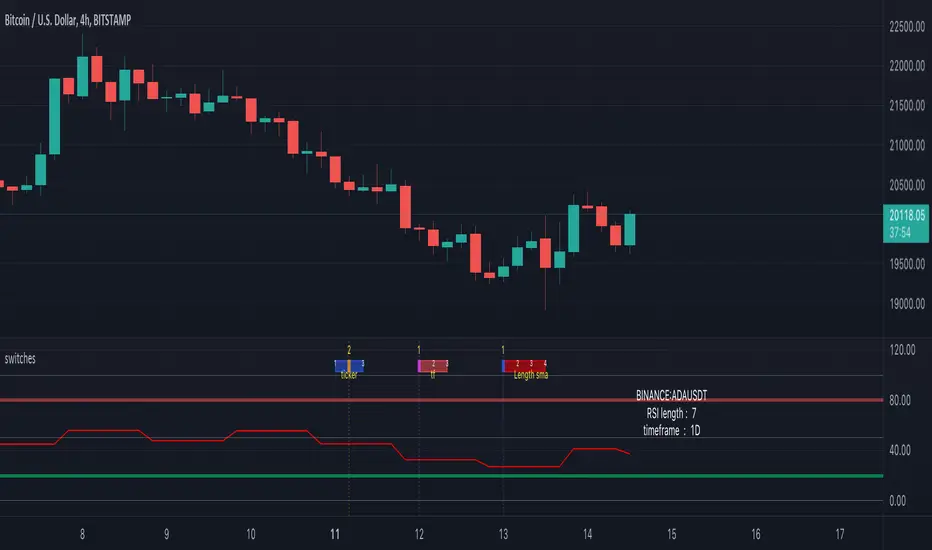
switches [experimental / tools]This scripts shows a tool which enables switching between settings without opening the settings
In this case you can switch between a RSI of 3 different tickers, 3 different higher timeframes, and 4 different lengths.
How does it work?
The position of a 'time line' is compared with the position of a box.
Changing the position of the line changes the settings.
The settings need to be set upfront though,
if you want to switch between length 7, 10, 14, 21 they need to be set first.
Example:
One wants to switch between RSI of SOLUSDT, ADAUSDT and FILUSDT
First set your tickers
-> Settings -> Set 1 -> Ticker
Then tap/click and move the line
And there you go!
The same with Timeframe and Length
Important:
It is not possible to automatically set the boxes/line at current time,
so these (settings -> date at Box, Line) need to be set in the beginning
Cheers!
View HTF CandlesThis script will allow you to see your selected higher timeframe candles while on a lower timeframe. Supported HTFs are: Daily, 4H and 1H.

[BM] HTF Candle Evolution█ OVERVIEW
This script shows how a higher timeframe candle evolves over time.
It was created as a visual aid to #TheStrat and provides a new way of looking at Timeframe Continuity.
█ FEATURES
General
HTF: Higher Timeframe selection with dropdown and ability to manually input a timeframe that is not present in the dropdown.
Label: Show a label with the selected higher timeframe.
Marker: Shows a marker symbol at the start of each new higher timeframe.
Align: Aligns the candles around a selected center line.
The Strat
Multi-timeframe analysis is used extensively in #TheStrat (created by Rob Smith), so the ability to add #TheStrat coloring has been made available.
Scenario: Define the colors for the strat scenario's.
Coloring of: Choose which part of the candles you want the selected strat scenario colors to be applied to.
Band: Display a band that shows the active strat scenario color of the selected higher timeframe.
All features are completely customizable.

HTF Candle Boxes for LTF Charts
This indicator allows you to show an outline of a Higher Time Frame (HTF) candle on a Lower Time Frame (LTF) chart. Options include selecting the HTF interval, and an option to either show a single shaded Box for the candle (High to Low), or a shaded box for the body (Open to Close) with the High to Low shown in an unshaded box. The purpose is to easily visualise what the previous HTF candles look like as you are working on the lower charts, for example was yesterday's candle Bullish, Bearsish, indecision, a Doji etc.
[VDB]HTF-Momentum-SpeedThis script is for plotting momentum and speed of higher timeframe using MACD Histograms.
Settings are hardcoded to 35/70/20 for momentum while speeds change slow length to 100, 200 and 300.
There is an option to use the user defined higher timeframe is case auto selection is inappropriate.
DISCLAIMER: This indicator has been created for educational reference only and do not constitute investment advice. This indicator should not be relied upon as a substitute for extensive independent market research before making your actual trading decisions. Market data or any other content is subject to change at any time without notice. Liability for any loss or damage, including without limitation any loss of profit, which may arise directly or indirectly from use of this indicator is accountability of user using it.

Candles HTF on Heikin Ashi ChartThis script enables calling and/or plotting of traditional Candles sources while loaded on Heikin Ashi charts.
Thanks to @PineCoders for rounding method: www.pinecoders.com
Thanks to @BeeHolder for method to regex normalize syminfo.tickerid.
NOTICE: While this script is meant to be utilized on Heikin Ashi charts it does NOT enable ability to backtest!
NOTICE: For more info on why non standard charts cannot be reliably backtested please see:
NOTICE: This is an example script and not meant to be used as an actual strategy. By using this script or any portion thereof, you acknowledge that you have read and understood that this is for research purposes only and I am not responsible for any financial losses you may incur by using this script!

HTF Candles & PivotsThis indicator displays HTF candles and pivot points.
The candles are displayed in a box and you can select Open-Close, High-Low or both.
You can show all of the past, or just "today only" or "previous day only".
You can also shift one previous candle to the current one.
The pivot point is the normal one.
There is an option to display CPR (Central pivot range).
Example: Shift previous to current

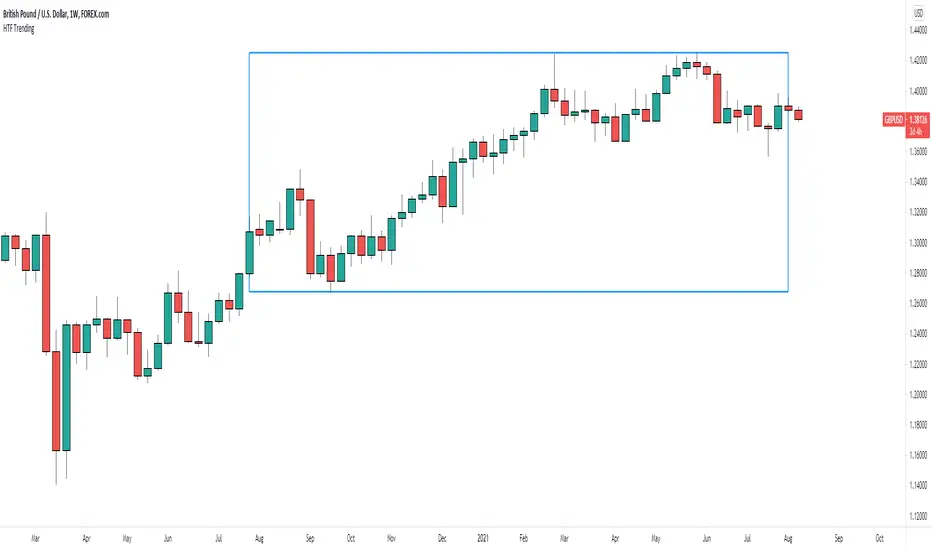
HTF Trending AnalysisThis is a very simple tool I created for historical analysis. Its intent is to simply draw a box from the current date to a month/year that you specify. Maybe you will have some other uses for it
Papercuts Dual PSAR v01Dual PSAR is a trend following script that uses auto-higher timeframe calculation of the current timeframe to create a dual Parabolic Stop And Release.
This is useful because it can determine periods of transition or indecision and can flag those periods with which way it is learning even though it is undecided, what i call "Wait Zones".
When both PSARS are not in alignment, it uses the lower timeframe one to determine which way the wait zone is learning.
You can see below in the chart shows some good trends and some wait zones.
A wait zone can have bullish indication, but then still have a bearish continuation.
A wait zone can have bullish indication, and then enter a bull trend.
Typically I won't make trades in wait zones, and I will exit trades when entering one.
Just wanted to try this out and see how it did. Figured I'd share.

Papercuts Super Trend MTF v02All my scripts are part of a suite called Papercuts .
This one uses one current timeframe supertrend and adds Four Automatic Higher Timeframe Supertrends based on those same parameters to help you determine larger trends while only needing a single chart. This works quite well on 5 and 15 minute charts and will look up in time. Confident trends can be identified by having two or more lines in the same direction.
When unified, the intensity of the glow should increase a trends confidence. Unify collapses the 3 highest timeframe supertrends into the first higher timeframe supertrend. Without Unify on, the overall trends are usually easier to see at just a glance. Higher timeframe supertrends can show support or resistance and act as stop loss limit ranges if you choose. Unify keeps things a bit cleaner and more compact.
V02 updated to fsecurity for no repainting and added a 3MA trend option as well.
Thanks to @Pinecoders for helping me better understand the security function!
Here is a view with Unify on....
Here is a view with Unify off...
