[LJ] RSIM + ICT KillzonesIndicator Summary
This Pine Script indicator is a comprehensive, all-in-one toolkit designed for traders utilizing Inner Circle Trader (ICT) concepts. It visually maps out crucial time-based trading sessions, killzones, and key opening price levels directly on the chart. Alongside the time and price tools, it features a real-time "RSIM" (MTF RSI Monitor) dashboard to track market momentum across multiple timeframes, all while maintaining a lag-free chart through automated drawing cleanup.
Core Functionalities
ICT Killzones & Silver Bullets:
Visually demarcates specific high-probability trading windows—including the Asian, London, and New York (AM & PM) killzones, as well as the UK and US "Silver Bullet" times—using vertical lines and colored background highlights.
Key Opening Price Levels:
Automatically plots horizontal lines for significant opening prices, such as the New York Midnight Open (often used as true day open), CME Open, and NY AM/PM Opens. It also includes Higher Time Frame (HTF) levels for Weekly and Monthly opens.
Session High/Low Tracking:
Actively tracks and draws horizontal price levels for the High and Low of the current day, previous day, and individual Globex, Asian, London, and NY sessions.
Multi-Timeframe RSI Dashboard (RSIM):
An on-chart table that displays the current Relative Strength Index (RSI) values and a live countdown timer ("time to close") for the 5-minute, 15-minute, 1-hour, 4-hour, Daily, and Weekly timeframes.
Lunch "No-Trade-Zone":
Specifically highlights the New York Lunch period, visually warning traders of potential low-volume or erratic price action.
Automated Housekeeping:
A built-in memory management system that automatically deletes drawings (lines and labels) older than a user-defined number of days to prevent chart clutter and performance lag.
Built-in Debug Logger:
An optional on-chart logging table that tracks session triggers and script events, helping traders verify that times and levels are plotting correctly for their selected asset.
Horizontallines

OHLC ToolOHLC Tool allows you to display Current or Historical OHLC Values as horizontal lines that extend to the right on your chart.
Features
Variable Lookback to display a specific historical bar's values. Default = 1 (Previous Candle)
Customizable Timeframe to view HTF Candle values.
Custom Line Colors, Styles, and Thicknesses.
Price Scale Value Display Capability.
For displaying the line values and labels on the price scale you will need to enable:
"Indicator and financials name labels"
and
"Indicator and financials value labels"
These options are found in the Price Scale Menu under Labels. Price Scale Menu > Labels
When you do this you will notice your other indicator values will also be on the price scale,
if you wish to disable these, go to the indicator settings under the "Style" Tab, Uncheck the "Labels on price scale" box.
Indicator Settings > Style > "Labels on price scale"
Enjoy!

Auto Horizontal Lines_Arshak_TcAdjust the time as per your purpose.Turn off second line option if you don't need it.

OS HiLo TrackingIndicator plots a dynamic horizontal line for tracking the highest high and/or lowest low in your desired time-period.
You can select both the period, and whether an alert is produced when the price crosses the last highest high or lowest low.
When used when other Williams indicators, this can help you set your trailing stop for profit-taking.

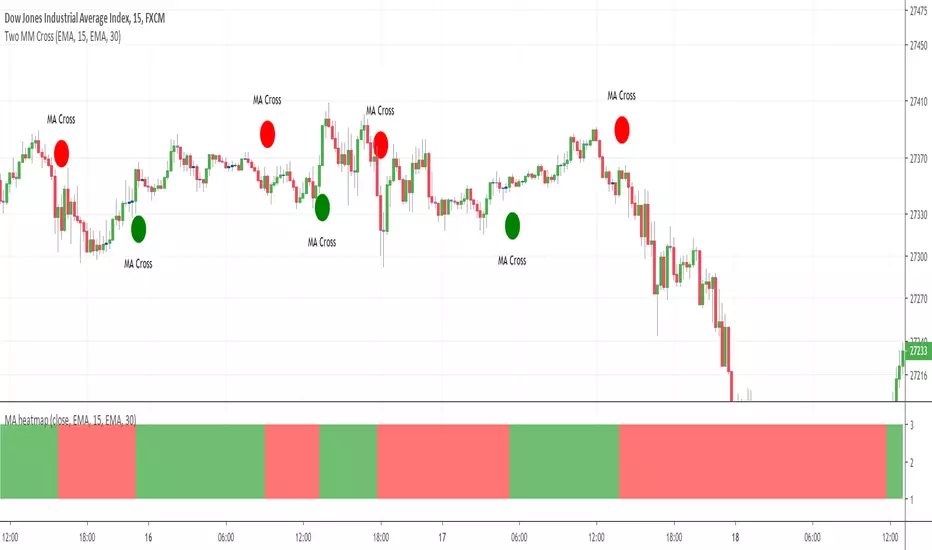
MA heatmap (Double cross edition)Hello my friends
Sorry yesterday I couldn't post an indicator because I was travelling. So here's the today indicator inspired from that one Moving-Average-Heatmap-Visualization/
This will gives an interesting representation of a Double Moving Average cross
That's all for me
Let's resume the free indicators publishing next Monday with the MA heatmap (Triple cross edition) and then the 4 cross ... until the 100 cross edition .... "wait are you joking sir ?"... Totally YES :)
But the Triple cross edition will be released as it's interesting from a Pine script perspective
Enjoy your weekend and stay safe
Dave
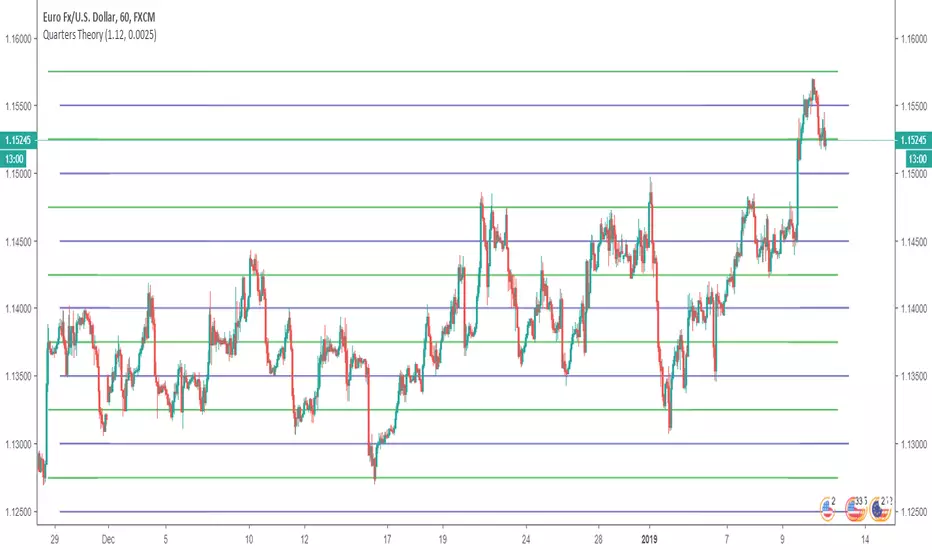
Horizontal LinesHorizontal lines help you to put Quarter Theory lines on your chart. It's defaults are meant for EURUSD , but you can change it for other charts. There are 16 lines in this indicator.
For EURUSD recommended settings right now are: Starting Price (Bottom):1.12 and Gap: 0.0025
USDCAD: Starting Price (Bottom):1.315 and Gap: 0.005
EURAUD: Starting Price (Bottom):1.59 and Gap: 0.005
USDJPY: Starting Price (Bottom):107 and Gap: 0.5
USDCHF: Starting Price (Bottom):0.97 and Gap: 0.0025
BTCUSD: Starting Price (Bottom):3200 and Gap: 100
XAUUSD: Starting Price (Bottom): 1230 and Gap: 5
These settings are the ones I use, but you could find better settings for yourself. It works very well on JPY pairs.