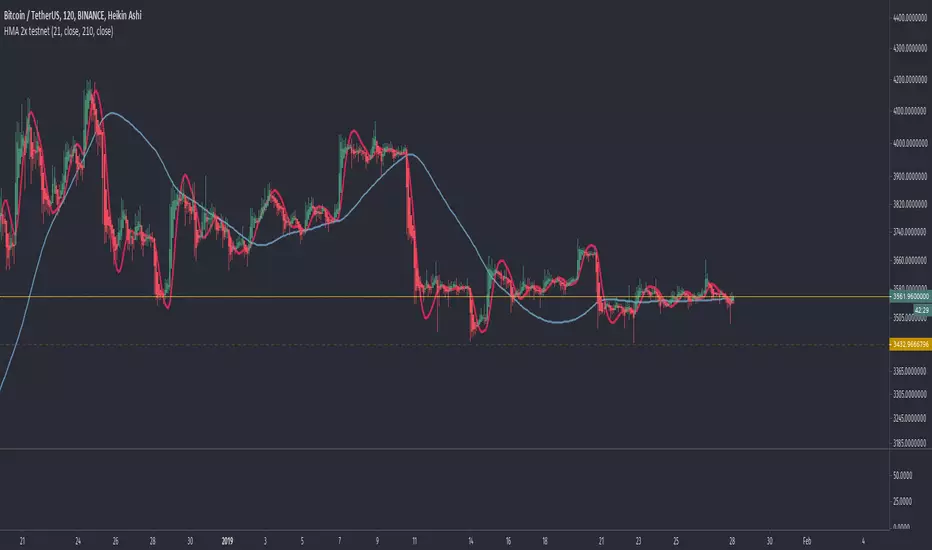
HMA

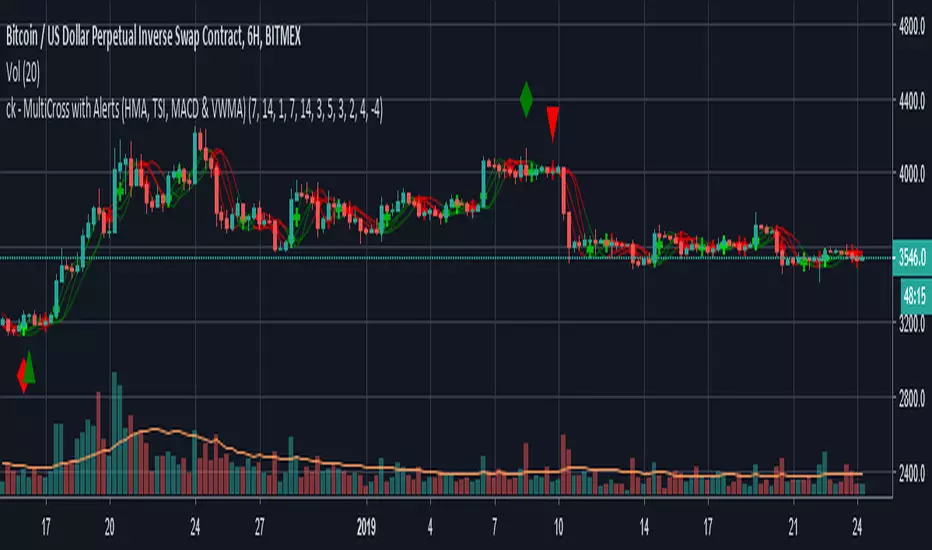
ck - MultiCross with Alerts (HMA, TSI, MACD & VWMA)Hello again everyone!
I hope you enjoy this "Multicross" Indicator.
Feature packed indicator with Alerts, that includes:
Double Hull MAs (fast and slow)
TSI (fast, slow, Long trigger & Short triggers definable)
VWMA
MACD (fast and slow)
Visual output plots line crosses from the indicators and provides visual Long and Short triangles and Alerts for bot users!
Enjoy!
Special thanks to Magnus Söderberg for the idea behind this.
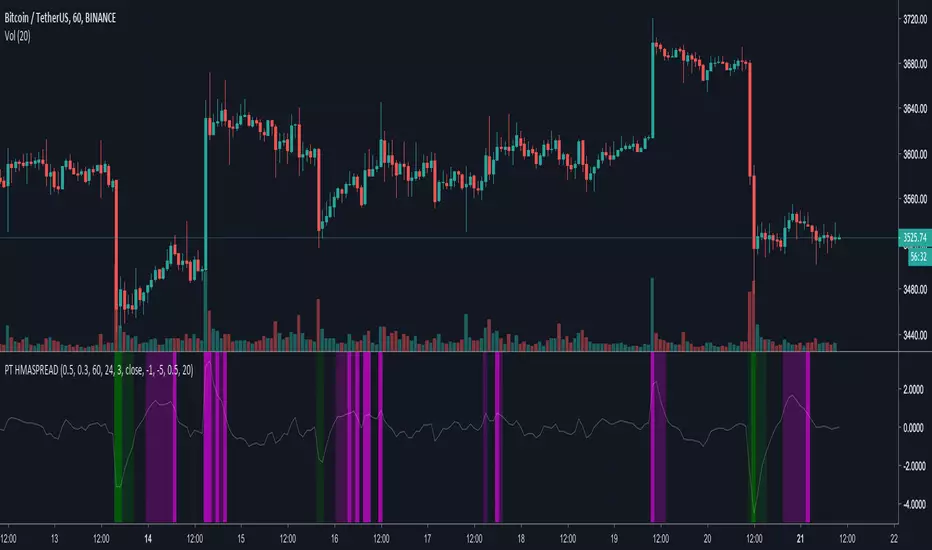
[ProfitTrailer] HMASPREAD Buy/Sell studyProfitTrailer buy/sell study for HMASPREAD strategy.
The script highlights the region where trailing is most likely to succeed.
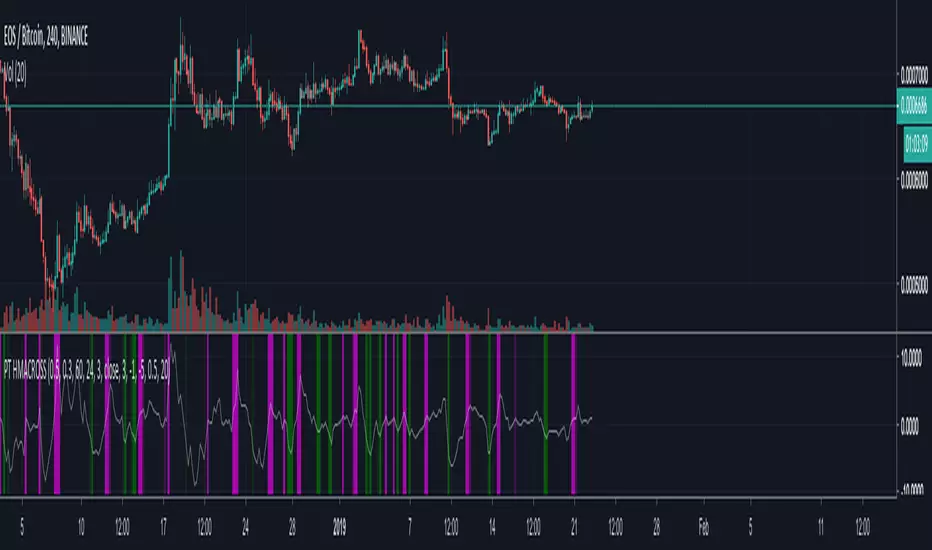
[ProfitTrailer] HMACROSS Buy/Sell StudyProfitTrailer buy/sell study for HMACROSS strategy.
The script highlights the region where trailing is most likely to succeed.
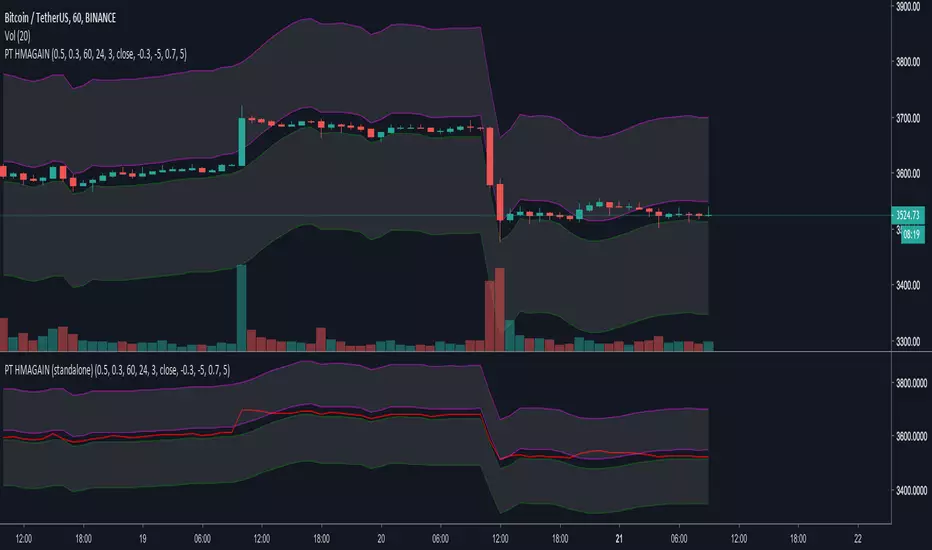
[ProfitTrailer] HMAGAIN Buy/Sell Study (standalone)ProfitTrailer buy/sell study for HMAGAIN strategy (standalone indicator).
The script highlights the region where trailing is most likely to succeed.
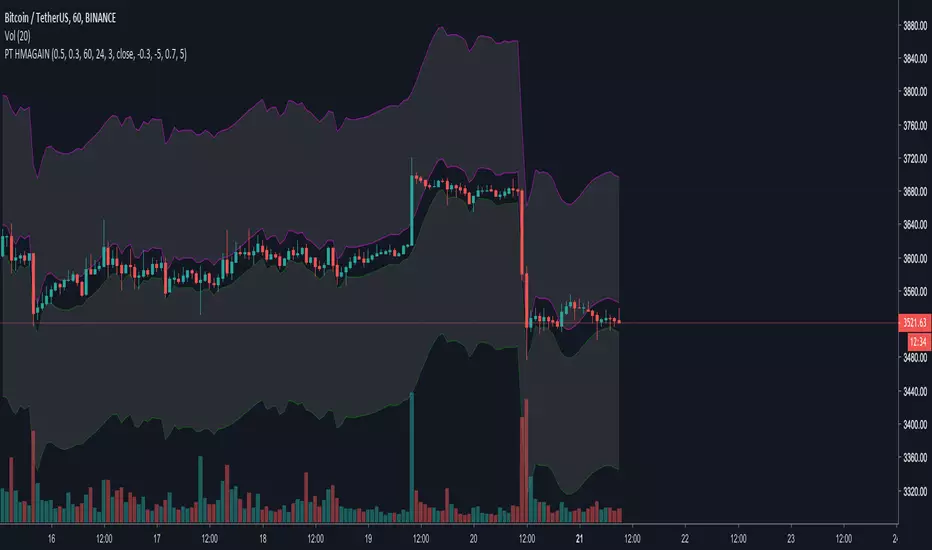
[ProfitTrailer] HMAGAIN Buy/Sell StudyProfitTrailer buy/sell study for HMAGAIN strategy.
The script highlights the region where trailing is most likely to succeed.
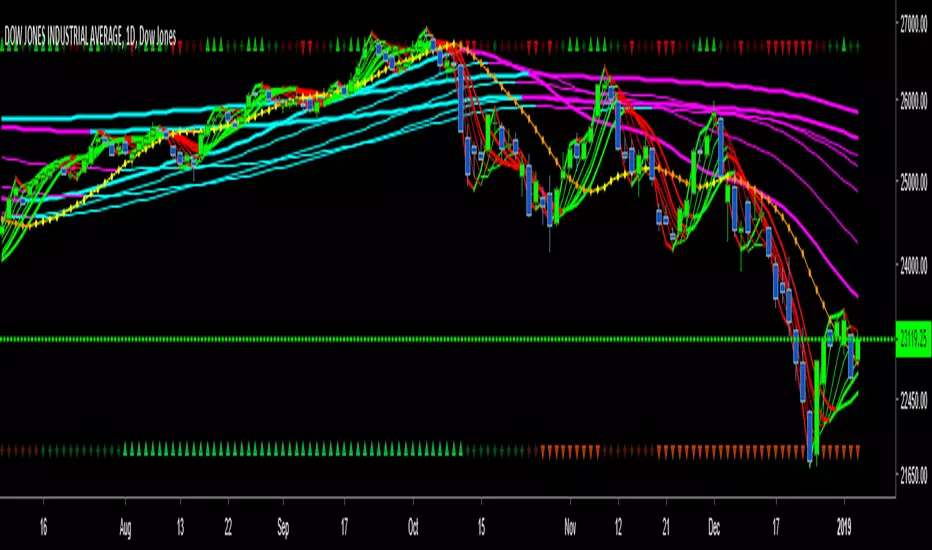
4 Hull MAThe Hull Moving Average (HMA) was developed by Alan Hull in 2005 for the purpose of reducing lag, increasing responsiveness while at the same time eliminating noise. Its calculation is elaborate and makes use of the Weighted Moving Average (WMA). It emphasizes recent prices over older ones, resulting in a fast-acting yet smooth moving average that can be used to identify the prevailing market trend. It can also be used for entry and exit signals. I have integrated 4 HMA's into one which can be used for taking entry and exits similar to 4 EMA strategies. All credit goes to Alan Hull for developing this technique.

Bestest Vol boxI do not like how the default volume indicator crowds my chart. So, I made this little thing just for fun. It's the bestest!

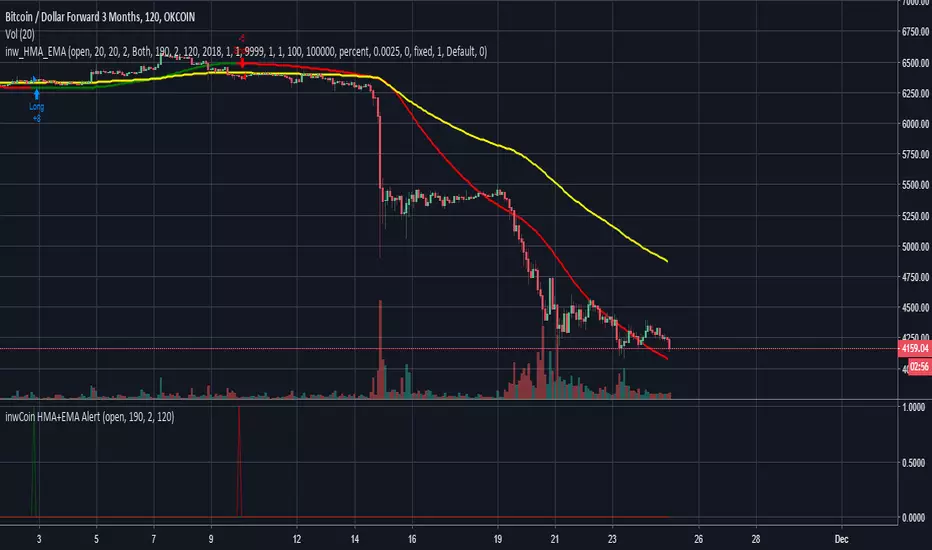
inwCoin HMA+EMA AlertJust simple HMA + EMA120 alert for same strategy
Work well with TF 2H
Tried BTC on OKex and Bitmex and it looking good.
Best for hand trade.
If you want to try, just comment, i'll grant you a permission for 2 days
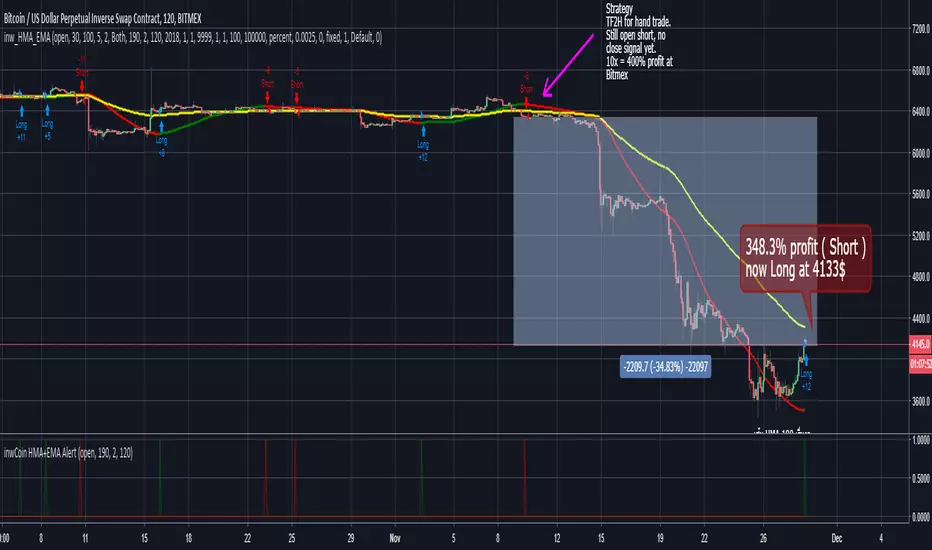
inwCoin HMA + EMA StrategyJust simple HMA + EMA120 strategy
Work well with TF 2H
Tried BTC on OKex and Bitmex and it looking good.
Best for hand trade.
If you want to try, just comment, i'll grant you a permission for 2 days
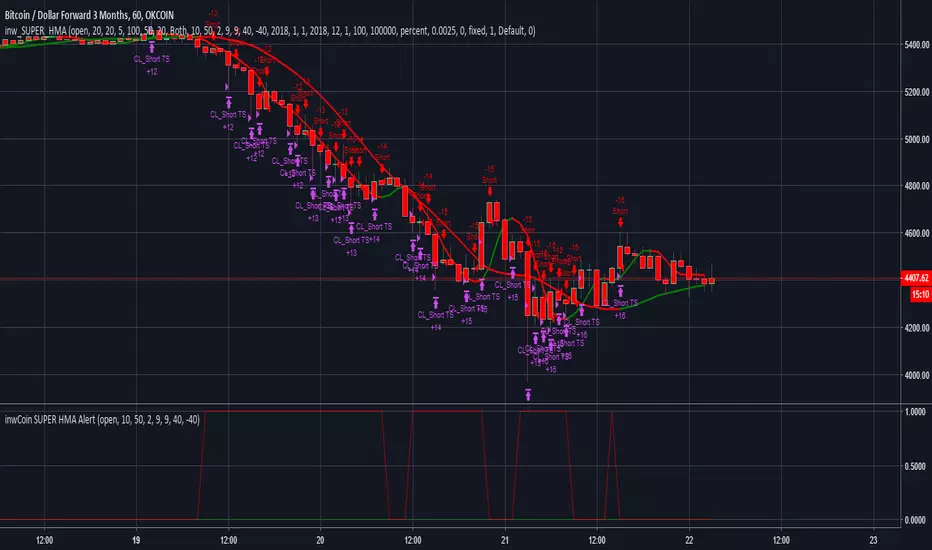
inwCoin SUPER HMA AlertinwCoin Super HMA alert for Super HMA strategy ( )
If you want sourcecode, I can give you for 0.01 BTC :) Send BTC to address below and IM me for acknowledgement.
BTC : 3BmqVW8eqE3qAGdtCdYGFYKbMwEALAhSEp
Check some backtest result here : imgur.com
Backtest result for various trade% : imgur.com
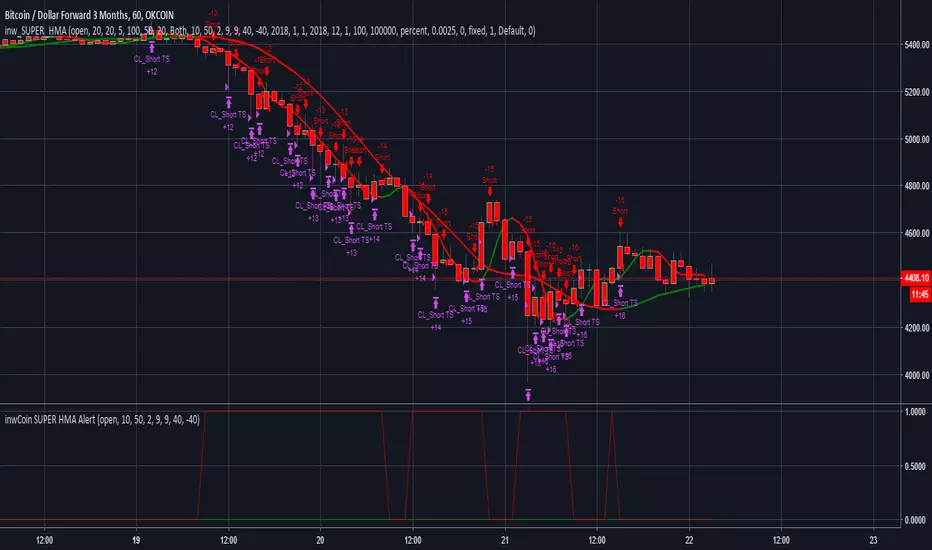
inwCoin SUPER HMA StrategyImproved version of inwCoin HMA Aggressive Strategy.
Filter out random trade from sideway period and wait for trend only.
Work very well on BTCUSD3M at OKEX with leverage 20x ( with the help of trailing start/stop bot, of course )
If you have OKex bot/ Or plan to write one. This strategy is the best bet.
If you want sourcecode, I can give you for 0.1 BTC :) Send BTC to address below and IM me for acknowledgement.
BTC : 3BmqVW8eqE3qAGdtCdYGFYKbMwEALAhSEp
Check some backtest result here : imgur.com
Backtest result for various trade% : imgur.com
Hull & Candle CrossoverA Hull moving average and candle crossover.
(2 hullMA's and present to past candle value calculation and smoothing function)
Enters order on Hull1 vs Hull2 crossover, Exits order on Price vs Candle crossover
Strategy looks at the previous(1) candle value to calculate current price so it lags 1 candle (to avoid repainting)
Any timeframe and pair ok, just change settings to suit
commission is included in the default result

inwCoin HMA AlertSimple alert to go along with the inwCoin HMA Strategy
Please not that the alerts are persistent 2.70% , if you already enter the position,
just ignore the rest of the same alert until the opposite alert show up
( long then short / or short then long , if change, just close and enter opposite position )
You can set the alert and let it tell you to iOS app via TradingView app ( yey! )
Please note that, if you don't have bot to track your trailing start/stop. you have to enter the TP/SL manually ( also tracking the position )
So... be careful to follow this alert. just try it with small amount of money first.
and make sure to set stop loss every time because OKEX is a portfolio killer if you don't have any stop loss.
** if you cannot trailing stop bot, just uncheck the "Aggressive Strategy" in both strategy and alert to reduce alert to minimum level.

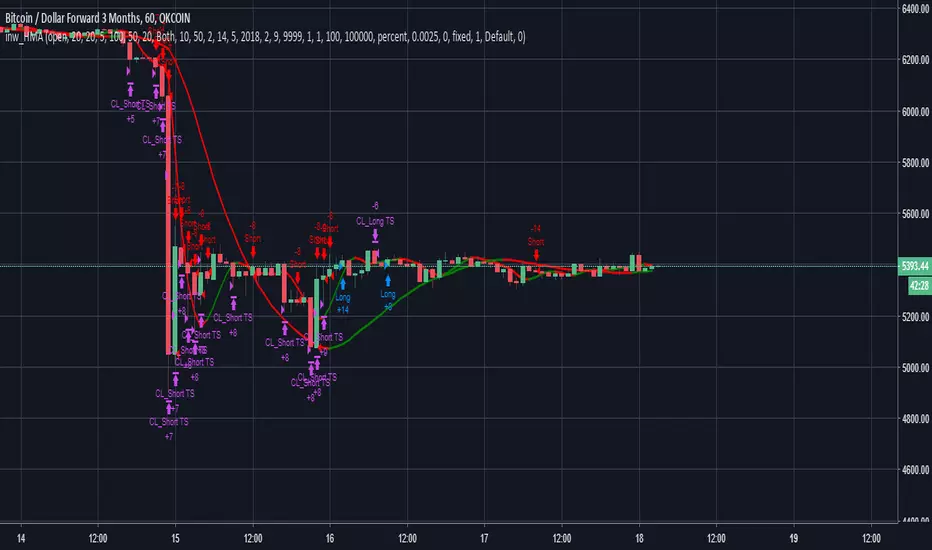
inwCoin HMA StrategySuper duper strategy using HMA ( Hull Moving Average ) 10 and 50 for decided entry ( short / long )
There are 2 type of strategies, you can choose with checkbox.
(1) Aggressive Strategy Ticked
* If ticked, strategy will enter position again if the condition met. ( both line red ) after Taking Profit ( or Stop Loss )
* It will use trailing start/stop so the profit is kinda crazy ( and yes, impossible in real world lol )
* The problem is, it will enter position like crazy and you might get a lot of loss from fee
(2) Aggressive Strategy not Ticked
* It will enter once only ( HMA10 just changed color to the same as HMA50 )
* If TP or SL already, it will wait for next signal
* Less trade, less profit, but safer. ( wait for right signal )
** For Aggressive Strategy, you can't select the date from 1/1/2018 because the trade record is way too much .... lol
** You can experiment yourself with other exchange/coin as your like.
=============================================
Test Data Detail
=============================================
Exchange : OKEX
Coin : BTCUSD3M
Timeframe : 1H
Date range : 2018/2/9 - 2019/1
For : Trailing with bot ( If you have one :P )
Config
Trade % = 20 ( You can increase trade size of your total port but it will get you into more risky trade. ( but yes, more profit ) ... u can increase trade size if you have enough profit
Trailing Start = 20 ( If you can write bot, it will start trailing when the profit % reach this value )
Trailing Stop = 5 (If you can write bot, it will take profit if the profit drop below this value from trailing start.)
Take Profit = It will set fixed TP for whipsaw case ( rarely reach this target )
Stop % = 50 ( so this trade is RR = 2 nice! )
Leverage = 20 ( so we can withstand the price fluctuation and not get liquidated, if you trade spot, please choose 1 also, please adjust TP and stop accordingly eg. leverage 1 / TP = 20 / SL = 10 )
Trade Direction = Both ( for margin market, if you want to trade spot like Binance you can choose long only )
Hull 1 Length = 10 ( Fast HMA length)
Hull 2 Length = 50 ( Slow HMA length)
Hull trend test length = 2 ( hull test range for rising or down trend )
Aggressive Strategy = YES ( enter next position if condition met immediately )
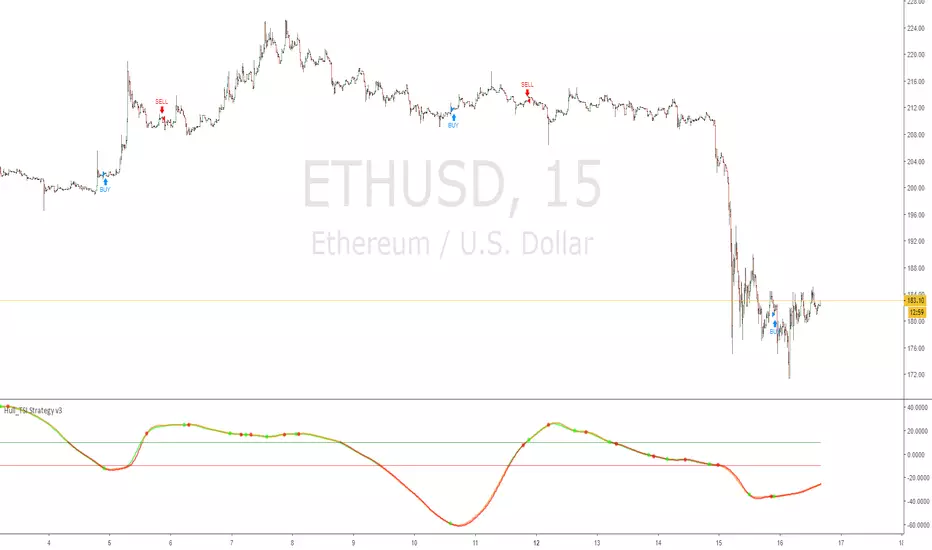
Hull_TSI Strategy v3True Strength Index, but Exponential Moving Average taken out and replaced with Hull Moving Average
this version uses 3 Hull MA's as well as the TSI value crossovers above or below the upper/lower lines
This version is the closest to the API bot featured at gekkoplus.com
Hull_TSI bot is competing in the competition
" Gekko Plus is hosting a strategy contest. Submit the best performing Gekko strategy and win 0.1 BTC! "
15 Nov 2018: Strategy contest start
10 Dec 2018: Strategy contest end
12 Dec 2018: Contest evaluation, announcement of winners!
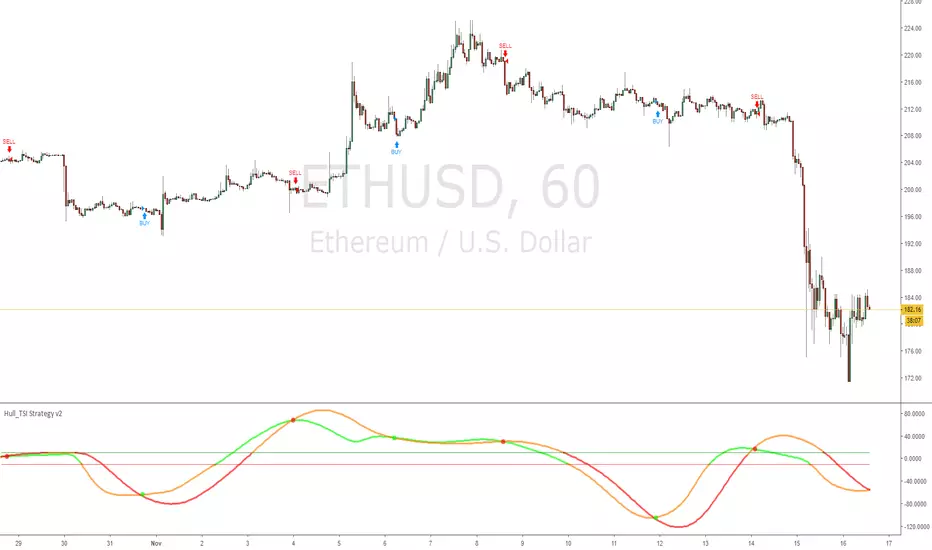
Hull_TSI Strategy v2True Strength Index, but Exponential Moving Average taken out and replaced with Hull Moving Average
this version uses only the crossover of the TSI values
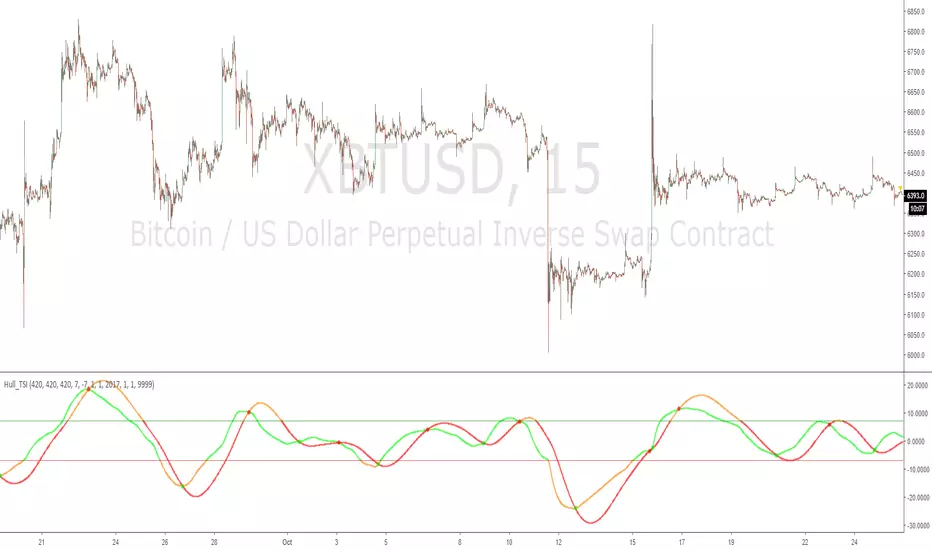
Hull_TSITrue Strength Index, but Exponential Moving Average taken out and replaced with Hull Moving Average
increase the values for increased timeframes i found good on 1hour chart 700,700,700 (instead of 420)
this is the indicator version, hopefully Alert friendly with each plot named
HMA 55/80 Crossover Strategy - Multiple Crossing OptionsThis strategy concept is from ismail_tarim on TradingView, and on Twitter as @ismailtarim977. It is intended to be implemented on the daily chart . The original strategy is reflected, to the best of my ability and understanding, in the default settings.
There is an option to toggle plots being displayed. The plots accurately indicate when the events take place, rather than the delay from the strategy display.
// SYMBOL LEGEND //
Green 'X' indicates when price crosses up the desired HMA .
Green 'Up Arrow' shows the pullback entry on the crossed HMA .
Red "Down Arrow" shows the exit when prices closes below the HMA 55, or "Fast HMA".
If you notice something that needs to be changed or that could be added, please share it in the comments below. Thanks!

HULL_FIB Strategy2 Hull Ma's
Long Hull MA FIB Lines
It will Sell when reaches upper 0.618 Fib and Hull(short_period)has crossed over to selling
it will close sell by TP or SL or when reaches lower 0.618 Fib
Buy is opposite that
here is how it makes the FIBS:
================================================
mult = input(3.0, minval=0.001, maxval=50)
basis = func_hma(price, HMAlengthLong)
dev = mult * stdev(price, HMAlengthLong)
upper_1= basis + (0.236*dev)
upper_2= basis + (0.382*dev)
upper_3= basis + (0.5*dev)
upper_4= basis + (0.618*dev)
upper_5= basis + (0.764*dev)
upper_6= basis + (1*dev)
lower_1= basis - (0.236*dev)
lower_2= basis - (0.382*dev)
lower_3= basis - (0.5*dev)
lower_4= basis - (0.618*dev)
lower_5= basis - (0.764*dev)
lower_6= basis - (1*dev)
plot(basis, color=orange, linewidth=2)
p1 = plot(upper_1, color=gray, linewidth=1, title="0.236")
p2 = plot(upper_2, color=gray, linewidth=1, title="0.382")
p3 = plot(upper_3, color=gray, linewidth=1, title="0.5")
p4 = plot(upper_4, color=black, linewidth=2, title="0.618")
p5 = plot(upper_5, color=gray, linewidth=1, title="0.764")
p6 = plot(upper_6, color=red, linewidth=2, title="1")
p13 = plot(lower_1, color=gray, linewidth=1, title="0.236")
p14 = plot(lower_2, color=gray, linewidth=1, title="0.382")
p15 = plot(lower_3, color=gray, linewidth=1, title="0.5")
p16 = plot(lower_4, color=black, linewidth=2, title="0.618")
p17 = plot(lower_5, color=gray, linewidth=1, title="0.764")
p18 = plot(lower_6, color=green, linewidth=2, title="1")
=================================================
