HighLowBox 1+3TF Enclose in a square high and low range in each timeframe.
Shows price range and duration of each box.
In current timeframe, shows Fibonacci Scale inside(23.6%, 38.2%, 50.0%, 61.8%, 76.4%)/outside of each box.
Outside(161.8%,261.8,361.8%) would be shown as next target, if break top/bottom of each box.
1st box for current timeframe.(default: Chart)
2nd-4th box for higher timeframes.(default: higher1,higher2,higher3)
static timeframes can also be used.
Highlow
*Zig Zag Price, % Change w/RSI*With immense help from ©SimpleCryptoLife who reimagined this script for me, and to ©mmoiwgg and ©ocaptain who's ideas led to this updated version 5.
This indicator is fairly straight-forward and visually appealing because you get a running zig zag price, price % change with an added bonus - RSI. However you won't find zig zag lines but the script reacts the same by changing the inputs. The higher the value the less data points you'll see on the screen.
The main objective of this indicator is to be able to spot high and low prices easily with the price % change between the same 2 data sets. Additionally and arguably more importantly, with the RSI values associated with the high and low prices, you can spot divergences easily - meaning the price is making a higher high while conversely the RSI value at the next pop (around the same price as previous high) is lower which can mean that momentum has exhausted for the time being and a reversal could be imminent.
This script is meant only as a tool to try to enrich your trading journey and I hope it helps you become a more consistent and profitable trader. If you find it invaluable drop a like and comment. Good luck!

ICT HTF Liquidity Levels /w Alert [MsF]Japanese below / 日本語説明は英文の後にあります。
-------------------------
*This indicator is based on sbtnc's "HTF Liquidity Levels". It's a very cool indicator. thank you.
It has 3 functions: visualization of HTF liquidity (with alert), candle color change when displacement occurs, and MSB (market structure break) line display.
=== Function description ===
1. HTF liquidity (with alert)
Lines visualize the liquidity pools on the HTF bars. Alerts can be set for each TF's line.
Once the price reaches the line, the line is repaint.
To put it plainly, the old line disappears and a new line appears. The line that disappeared remains as a purged line. (It is also possible to hide the purged line with a parameter)
The alert will be triggered at the moment the line disappears. An alert will be issued when you touch the HTF's liquid pools where the loss is accumulated, so you can notice the stop hunting with the alert.
This alert is an original feature of this indicator.
The timeframe of the HTF can't modify. You can get Monthly, weekly, daily and H1 and H4.
Each timeframe displays the 3 most recent lines. By narrowing it down to 3, it is devised to make it easier to see visually. (This indicator original)
2. Displacement
Change the color display of the candlesticks when a bullish candle stick or bearish candle stick is attached. Furthermore, by enabling the "Require FVG" option, you can easily discover the FVG (Fair Value Gap). It is a very useful function for ICT trading.
3. MSB (market structure break)
Displays High/Low lines for the period specified by the parameter. It is useful for discovering BoS & CHoCH/MSS, which are important in ICT trading.
=== Parameter description ===
- HTF LIQUIDITY
- Daily … Daily line display settings (color, line width)
- Weekly … Weekly line display settings (color, line width)
- Monthly … Monthly line display settings (color, line width)
- INTRADAY LIQUIDITY
- 1H … 1H line display settings (color, line width)
- 4H … 4H line display settings (color, line width)
- PURGED LIQUIDITY … Display setting of the line once the candle reaches
- Show Purge Daily … Daily purged line display/non-display setting
- Show Purge Weekly … Weekly purged line display/non-display setting
- Show Purge Monthly … Monthly purged line display/non-display setting
- Show Purge 1H … 1H purged line display/non-display setting
- Show Purge 4H … 4H purged line display/non-display setting
- MARKET STRUCTURE BREAK - MBS
- Loopback … Period for searching High/Low
- DISPLACEMENT FOR FVG
- Require FVG … Draw only when FVG occurs
- Displacement Type … Displacement from open to close? or from high to low?
- Displacement Length … Period over which to calculate the standard deviation
- Displacement Strength … The larger the number, the stronger the displacement detected
-------------------------
このインジケータはsbtncさんの"HTF Liquidity Levels"をベースに作成しています。
上位足流動性の可視化(アラート付き)、変位発生時のローソク色変更、MSB(market structure break)ライン表示の3つの機能を有します。
<機能説明>
■上位足流動性の可視化
上位足の流動性の吹き溜まり(ストップが溜まっているところ)をラインで可視化します。ラインにはアラートを設定することが可能です。
一度価格がラインに到達するとそのラインは再描画されます。
平たく言うと、今までのラインが消えて新しいラインが出現する。という事です。
消えたラインはpurgeラインとして残ります。(パラメータでpurgeラインを非表示にすることも可能です)
アラートはラインが消える瞬間に発報します。上位足の損切り溜まってるところにタッチするとアラートを発報するので、アラートにてストップ狩りに気づくことができます。
このアラート発報については本インジケータオリジナルの機能となります。
表示可能な上位足のタイムフレームは固定です。月足、週足、日足およびH1とH4を表示することができます。
各タイムフレーム、直近から3つのラインを表示します。3つに絞ることで視覚的に見やすく工夫しています。(本インジケータオリジナル)
■変位発生時のローソク色変更
大きな陽線、陰線を付けた場合に、そのローソク足をカラー表示を変更します。
さらに"Require FVG"オプションを有効にすることで、FVG(Fair Value Gap)を容易に発見することができます。ICTトレードにを行うにあたり大変有用な機能となっています。
■MSB(market structure break)ライン表示
パラメータで指定した期間のHigh/Lowをライン表示します。ICTトレードで重要視しているBoS & CHoCH/MSSの発見に役立ちます。
<パラメータ説明>
- HTF LIQUIDITY
- Daily … 日足ライン表示設定(色、線幅)
- Weekly … 週足ライン表示設定(色、線幅)
- Monthly … 月足ライン表示設定(色、線幅)
- INTRADAY LIQUIDITY
- 1H … 1時間足ライン表示設定(色、線幅)
- 4H … 4時間足ライン表示設定(色、線幅)
- PURGED LIQUIDITY … 一度到達したラインの表示設定
- Show Purge Daily … 日足ライン表示/非表示設定
- Show Purge Weekly … 週足ライン表示/非表示設定
- Show Purge Monthly … 月足ライン表示/非表示設定
- Show Purge 1H … 1時間足ライン表示/非表示設定
- Show Purge 4H … 4時間足ライン表示/非表示設定
- MARKET STRUCTURE BREAK - MBS
- Loopback … High/Lowを探索する期間
- DISPLACEMENT FOR FVG
- Require FVG … FVG発生時のみ描画する
- Displacement Type … openからcloseまでの変位か?highからlowまでの変位か?
- Displacement Length … 標準偏差を計算する期間
- Displacement Strength … 変位の強さ(数字が大きいほど強い変位を検出)

Supply and DemandThis is a "Supply and Demand" script designed to help traders spot potential levels of supply (resistance) and demand (support) in the market by identifying pivot points from past price action.
Differences from Other Scripts:
Unlike many pivot point scripts, this one offers a greater degree of customization and flexibility, allowing users to determine how many ranges of pivot points they wish to plot (up to 10), as well as the number of the most recent ranges to display.
Furthermore, it allows users to restrict the plotting of pivot points to specific timeframes (15 minutes, 30 minutes, 1 hour, 4 hours, and daily) using a toggle input. This is useful for traders who wish to focus on these popular trading timeframes.
This script also uses the color.new function for a more transparent plotting, which is not commonly used in many scripts.
How to Use:
The script provides two user inputs:
"Number of Ranges to Plot (1-10)": This determines how many 10-bar ranges of pivot points the script will calculate and potentially plot.
"Number of Last Ranges to Show (1-?)": This determines how many of the most recent ranges will be displayed on the chart.
"Limit to specific timeframes?": This is a toggle switch. When turned on, the script only plots pivot points if the current timeframe is one of the following: 15 minutes, 30 minutes, 1 hour, 4 hours, or daily.
The pivot points are plotted as circles on the chart, with pivot highs in red and pivot lows in green. The transparency level of these plots can be adjusted in the script.
Market and Conditions:
This script is versatile and can be used in any market, including Forex, commodities, indices, or cryptocurrencies. It's best used in trending markets where supply and demand levels are more likely to be respected. However, like all technical analysis tools, it's not foolproof and should be used in conjunction with other indicators and analysis techniques to confirm signals and manage risk.
A technical analyst, or technician, uses chart patterns and indicators to predict future price movements. The "Supply and Demand" script in question can be an invaluable tool for a technical analyst for the following reasons:
Identifying Support and Resistance Levels : The pivot points plotted by this script can act as potential levels of support and resistance. When the price of an asset approaches these pivot points, it might bounce back (in case of support) or retreat (in case of resistance). These levels can be used to set stop-loss and take-profit points.
Timeframe Analysis : The ability to limit the plotting of pivot points to specific timeframes is useful for multiple timeframe analysis. For instance, a trader might use a longer timeframe to determine the overall trend and a shorter one to decide the optimal entry and exit points.
Customization : The user inputs provided by the script allow a technician to customize the ranges of pivot points according to their unique trading strategy. They can choose the number of ranges to plot and the number of the most recent ranges to display on the chart.
Confirmation of Other Indicators : If a pivot point coincides with a signal from another indicator (for instance, a moving average crossover or a relative strength index (RSI) divergence), it could provide further confirmation of that signal, increasing the chances of a successful trade.
Transparency in Plots : The use of the color.new function allows for more transparent plotting. This feature can prevent the chart from becoming too cluttered when multiple ranges of pivot points are plotted, making it easier for the analyst to interpret the data.
In summary, this script can be used by a technical analyst to pinpoint potential trading opportunities, validate signals from other indicators, and customize the display of pivot points to suit their individual trading style and strategy. Always remember, however, that no single indicator should be used in isolation, and effective risk management strategies should always be employed.

Multi-Timeframe High Low (@JP7FX)Multi-Timeframe High Low Levels (@JP7FX)
This Price Action indicator displays high and low levels from a selected timeframe on your current chart.
These levels COULD represent areas of potential liquidity, providing key price points where traders can target entries, reversals, or continuation trades.
Key Features:
Display high and low levels from a selected timeframe.
Customize line width, colors for high and low levels, and label text color.
Enable or disable the display of high levels, low levels, and labels.
Receive alerts when the price takes out high or low levels.
How to use:
It is important to note that using this indicator on it's own is not advisable. Instead, it should be combined with other tools and analysis for a more comprehensive trading strategy.
Possibly look to use my MTF Supply and Demand Indicator to look for zones to trade from at these levels?
If the price breaks above a high level, you might consider entering a long position, with the expectation that the price will continue to rise. Conversely, if the price breaks below a low level, you may think about entering a short position, anticipating further downward movement.
On the other hand, you can also use high or low levels to look for reversal trades, as these areas can represent attractive liquidity zones.
By identifying these key price points, you could take advantage of potential market reversals and capitalise on new trading opportunities.
Always remember to use this indicator in conjunction with other technical analysis tools for the best results.
Additionally, you can enable alerts to notify you when the price takes out high or low levels, helping you stay informed about significant price movements.
This indicator could be a valuable tool for traders looking to identify key price points for potential trading opportunities.
As always with the markets, Trade Safe :)

Draw Several Horizontal Lines [MsF]Japanese below / 日本語説明は英文の後にあります。
-------------------------
This indicator that automatically draws a horizontal line by copying from the input High/Low. Useful for doing horizon analysis. It's possible to display Fibonacci based on the entered High/Low. You can get the alert of each Fibonacci point.
- Parameter
Input Upper Value: Enter the High value
Input Lower Value: Enter the Low value
Band Range Count : Enter the number of horizontal lines
Fibonacci : visible or invisible
-------------------------
入力したHigh/Lowを起点に水平線を上下にコピーして自動で描画するインジケーターです。水平線分析を行うのに役立ちます。
また、入力したHigh/Lowを元にfibonacciを表示することも可能です。fibonacciについては、各ポイント毎にアラートの設定も可能です。
<パラメータ説明>
Input Upper Value:起点となるHighを入力してください
Input Lower Value:起点となるLowを入力してください
Band Range Count :水平線を上下にコピーする本数を入力してください
Fibonacci :フィボナッチが不要な場合はfalseにしてください
Take Session High/Low Alert [MsF]Japanese below / 日本語説明は英文の後にあります。
-------------------------
This indicator that displays High/Low lines for each session. The Key Levels of each session can be visually recognized, which is useful for PD Array analysis. You can display the last 3 days. Based on trinity by ICT.
The biggest feature is that the color shape of the line changes when reaching High/Low. Of course, you can also set alerts.
Unreached High/Low lines can be extended to the right. hides all timeframes over 1 hour. (alert is alive)
You can choose 4 sessions. If you only want to use 3 sessions, you can do that by setting the same session time for 2 of the 4 session settings.
About Parameter Settings
Session Time: Please set it to be a 24-hour cycle. You can also specify the time zone. The default is NY time.
Basis/Other color: The first time specified in "Session Time" in this indicator's parameter is the "Basis color". "Other color" is a line other than that.
Enable Time Lines: You can turn on/off the display of vertical lines.
High/Low color: High/Low line setting that has not been reached.
Taken color: High/Low line setting that has already been reached.
Extend Lines: Allows unreached High/Low lines to be extended to the right in the chart.
-------------------------
セッションごとのHigh/Lowをライン表示するインジケーターです。
過去約3日分を表示することができます。
最大の特徴はHigh/Low到達時にラインの色形が変わることです。もちろんアラート設定も可能です。
未到達のHigh/Lowラインは右側に延長することができます。
チャート表示がビジーとなる為、1時間を超える時間足ではすべて非表示とする仕様です。(アラートは生きてます)
セッションは4つ指定できます。
もしセッションを3つのみ使用したい場合は、4つのセッション設定の内2つに同じセッション時間を設定することで実現可能です。
■パラメータ設定
Session Time:24時間周期となるように設定してください。またタイムゾーンが指定できます。デフォルトはNY timeです。
Basis/Other color:パラメータの"Session Time"にて一番最初に指定した時間が基準=Basisとなります。Otherはそれ以外のラインとなります。
Enable Time Lines:垂直ラインの表示ON/OFFが可能です。
High/Low color:未到達のHigh/Lowライン設定となります。
Taken color:到達済みのHigh/Lowライン設定となります。
Extend Lines:未到達のHigh/Lowラインを右に延長できます。

RSI Objective LinesThe RSI is a contrarian indicator bounded between 0 and 100 where values close to the area of 30 represent an oversold condition and values close to the area of 70 represent an overbought condition.
Generally, we use the area of 70/75 and the area of 30/25 as extremes that signal a market reversal or a correction. But what if we calculate a simple way to make these levels more dynamic?
The main idea from these objective support and resistance levels is that market regime and dynamics move and as such fixed levels are unlikely to always provide value which means that we can try creating variable levels. The objective support and resistance levels are created following these steps:
* Calculate a 14-period RSI on the close price, let's call this RSI_Close.
* Calculate a 14-period RSI on the high price, let's call this RSI_High.
* Calculate a 14-period RSI on the low price, let's call this RSI_Low.
* Calculate the maximum range which is the highest value of RSI_High in the last 200 periods minus the lowest value of RSI_Low in the last 200 periods. Let's call this Max_Range
* Define the range width. By default, it is set to 5%. Let's call this Threshold.
* The objective support is calculated as the sum of the RSI_Low + (Max_Range * Threshold).
* The objective resistance is calculated as the sum of the RSI_High - (Max_Range * Threshold).
The levels are used in the same way as the oversold and overbought levels. They are more dynamic as they take into account the fluctuations of the RSI so you might see at some point in time a support at 20 and at another at 35.

Divergence and Pivot - Detector For Any IndicatorI present to you an indicator capable of determining the divergence and convergence points for any indicator you choose. It will also determine Pivot points.
All you need to do is add the indicator to your favorites and call it. Next, you need a second indicator for which you want to find divergences or pivots. Next you need choise 'Oscillator Source' section in my indicator, after that you need to choose the name of the indicator for which you want to find divergences . - Done!
Thanks to the developers of TradingView for posting the source code of the "Divergence Indicator" indicator.

SFC Smart Money Manipulation - Liquidity, StructureThis indicator shows very important information about the market.
Features:
- Market structure
- Important Ranges
- Liquidity
- Trading session
- Daily Checklist
Market structure
Market structure is the behaviour, condition, and current flow of the market. It highlights support and resistance levels, swing highs, and swing lows. A trend is simply a consistent direction of price movement over time. Market structure can tell you if the market is trending or not.
Market structure is a lagging indicator, because Highs and Lows must to be created in order to define the structure properly. The structure provide the most important information about the market.
Market structure can provide early signals about the trend.
- If the structure continues to break in the same direction, it means that the trend is healthy and will continue (BoS).
- If the structure break in the opposite direction, means that the trend may reverse or pause for a while (CHoCH).
Important ranges
- Asia Range - it is important intraday range and can provide early information if the day will be bullish or bearish.
- Most recent High/Low - determine the last swing
- Premium/ Discount zone with Fibonacci levels - the institutions always want to buy in discount and sell in premium.
Liquidity
Areas where a lot of traders get into the market and theirs stop losses are obvious. So the banks will manipulate the price to clear these stop losses, before price go in real direction. The banks will always hunt the liquidity.
The major liquidity is:
- Doji candle - displayed
- Double/Triple Highs or Lows - displayed
- Fair value gaps - displayed
- Imbalances - displayed
- Trend lines
- Big wicks
Trading Sessions
Price and Time theory is very significant in Smart Money Concept. The banks do not just place orders chaotically. They place it in specific time.
The indicator shows the Asia, London and New York intraday sessions and the kill zones.
Kill Zone - most manipulated time in the day, where institutions try to wipe out the retail traders and establish the true move.
Daily Checklist
Simple, but very useful checklist. It shows the most important daily steps in order qualitative analysis to be created.
How to use
1) Use the swing highs and lows and check the current structure.
2) Look where is the major liquidity. By default orange colour. When liquidity is retested from the price ,it change the colour from orange to gray. Retested liquidity is no more significant for the banks.
3) Use the important ranges to define the pullbacks or reversals or trading ranges.
4) Use the trading sessions and kill zones to place orders in the right time.
5) Use the "daily checklist" every day - step by step. It helps trader to analyse the current market.
Settings
-Show pivots, Pivot confirmation candles, Equal Highs/Lows sensitivity
-Show structures breaks
-Show most recent high/low
-Show Asia range
-Show premium/discount zone with Fibonacci levels
-Show liquidity, Colour of liquidity, Color of retested liquidity, Doji settings
-Show Trading sessions
-Show daily checklist

MapMap - an indicator that shows the highest and lowest points on the price movement road.
The calculation is based on the type of price data specified in the "Source" parameter and the length of the time interval specified in the "Length" parameter.
The indicator helps to visually find a local trend and rebound points.
Thanks for your attention!

High/Low Historical Volatility Bands [Loxx]High/Low Historical Volatility Bands are constructed using:
Average as the middle line.
Upper and lower bands using the Historical Volatility high/low (instead of "regular" Historical Volatility) for bands calculation.
What is Historical Volatility?
Historical Volatility (HV) is a statistical measure of the dispersion of returns for a given security or market index over a given period of time. Generally, this measure is calculated by determining the average deviation from the average price of a financial instrument in the given time period. Using standard deviation is the most common, but not the only, way to calculate Historical Volatility .
The higher the Historical Volatility value, the riskier the security. However, that is not necessarily a bad result as risk works both ways - bullish and bearish , i.e: Historical Volatility is not a directional indicator and should not be used as other directional indicators are used. Use to to determine the rising and falling price change volatility .
SH is stock's High price in t day.
SL is stock's Low price in t day.
High/Low Return (xt^HL) is calculated as the natural logarithm of the ratio of a stock's High price to stock's Low price.
Return:
And Parkinson's number: 1 / (4 * math.log(2)) * 252 / n * Σ (n, t =1) {math.log(Ht/Lt)^2}
An important use of the Parkinson's number is the assessment of the distribution prices during the day as well as a better understanding of the market dynamics. Comparing the Parkinson's number and periodically sampled volatility helps traders understand the tendency towards mean reversion in the market as well as the distribution of stop-losses.
The color of the middle line, unlike the bands colors, has 3 colors. When colors of the bands are the same, then the middle line has the same color, otherwise it's white.
Included
Alerts
Signals
Loxx's Expanded Source Types
Bar coloring
Related indicators:
Parkinson's Historical Volatility Bands
Historical Volatility Bands

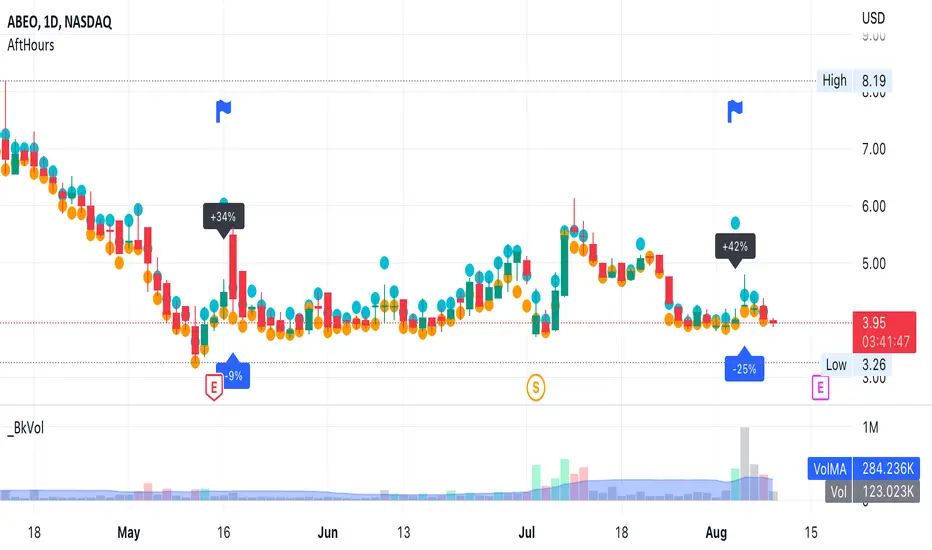
AfterHours Spike DetectorThe script pulls Lower Timeframe (30min) data to draw High/Low of Out-of-hours/AfterHours session (post-market session & next day pre-market session) on the Daily regular session chart. It then identifies significant AfterHours price changes and what happens to these price Spikes by the Open of the next day regular session.
You can change:
wether to show AfterHours High/Lows
wether to show AfterHours price Spikes
the AfterHours price Spike threshold (default = +/- 10%)
Current price & Daily openFor those who likes clean chart:
I made a simple script that shows Current price based on the last candle color.
Also can show Daily open line based on the daily candle color.
Daily open line is same as strong support and resistance levels.
Mostly price shows strong responces on daily open line.
1: Daily open line color is blue if current price is above the daily open line.
And daily open line is red if current price is below the daily open line.
This means blue daily open line represents bullish daily candle and red daily open line represents bearish daily candle.
Simply you can expect Buy setup on the daily open line if it is blue and vice versa. That means you are following the daily trend, nothing else.
Always double confirm with your own trading style. It's not guaranteed.
You can use this script when you want to see daily price action or to find daily high lows.
This script helps to identify the following day high and lows too on the lower timeframe.
2: When you add drawing tools on your chart price labels are overlapping or if you choose not overlap then price moves up or down so you are not able to see current price easily.
This script helps to show current price on the last candle. You can easily see the current price.
Current price color is blue when last candle is bullish and it's red when last candle is bearish .
It always calculates last candle. So it could be weekly or 1 minute candle, whatever timeframe you working on.
Thank you.

Session High Low
This indicator shows Session High Low line and prices.
1: Session range is adjustable based on your timeframe. Nomore confusing timezone settings.
You can choose your timezone then set your Session start and end time.
Script will show you the following session high and low lines which is extendable until next session.
2: All historical lines and price levels are can be partially or fully hidden.
And line colors are adjustable so you can use suitable color on your chart.
Based on session you choose this script can be used as a session break strategy AKA (Asian session break, London session break strategy).
You can create your own trading Session and high lows.
Personally I monitor how price reacts on London session high lows during the NewYork trading session.
In this chart Session starts at 8am (London open) and closes at 12:30 (NewYork open). Script is showing high lows only in this session range.
Always double confirm with your trading style. It's not a Financial advice.
Inputs:
1: Hide history - Hides all historical lines and prices that means you can see only todays session.
2: Show price - Shows price level of session high lows. You can hide price level if you want to see only lines.
3: Session time - You can set your time range of session.
4: Start time - Session start time. You can see vertical line on your chart or you can hide line.
5: End time - Session end time. You can see vertical line on your chart or you can hide line.
6: Line extend time - End of the high low lines. You can draw line until the end of the session or you can draw short line.
7: All line and price colors are optional.
Thank you.

HIGH LOW CLOSE Moving Average ExponentialThe Script is prepared for testing purpose the Added single indicator for getting high low and close.
ViVen - EXP - Signals with AlertsHi Friends,
Here the trading made easy with Signals...
The main purpose of this indicator is to identify the Support and Resistance levels well in advance to make ourselves ready for the Entries with confidence..
With this indicator we will be able to identify the Market Structure and Trend to initiate our trades.
Multi Timeframe Concepts are considered in some cases to capture the Golden Zones.
Details of the Indicator:
Method of Trading – Intraday, Positional or Swing – Indices, Stocks and Commodity Markets
Golden Zones : When two or more indicator levels are confluences at one price point which will act as Strong Support and Resistance in the Market. That is called Golden Zone.
CPR & Pivot (Daily / Weekly / Monthly) – Based on the previous Timeframe values, it will automatically calculates the Support and Resistance values for the upcoming Sessions.
BUY / SELL Levels (W-Refers the Weekly levels) – Possible Reversal in the market we can expect at this price level. Depends on the Time frame (Daily/Weekly)
Bull BO / Bear BO (W-Refers the Weekly levels) – Possible Breakout level, If breakout happens price will move to reach the Target 1 and 2 Points based on which side the price breaks ( BULLISH / BEARISH ). We can initiate our BUY/SELL Entries.
Target 1 & Target 2 – Once the Price breaks the Breakout (Bull BO / Bear BO) levels, it will try to reach the Target Points where we can book our profits.
Tomorrow Levels - This will help us to enable the next day trading session Support and Resistance Levels in advance to do pre-analysis to prepare for the Entry and Exits.
Colored Candles : Lime Green and Violet colored candles will indicate the Possible Trend Reversals.
Triangles : Orange and Violet triangles will indicate the Confirmation of Trend Reversal.
BUY / SELL Signal – Considering the momentum and the Trend change it will suggest the possible entry time.
Dashboard :
1. Weekly Trend : This will indicate how the current week trend is going to be – Trending / Sideways
2. Today – Current Session expectation in the Market ( Bullish / Bearish )
3. Sentiment – Indicates the Traders mind set (Positive/Negative Side)
4. Range - This will indicate how the current Day trend is going to be – Trending / Sideways
5. MB / MA Trend – This identifies the major trend (Is the Stock / script in Up Trend or Down Trend)
6. Other Parameters – Will indicates the present situation in the market
7. RSI Values – This is to know and understand the momentum of the particular script
Levels Name Explanations:
1. DPP – Daily Pivot Point
2. WPP – Weekly Pivot Point
3. WTC – Weekly Top Central Pivot
4. WBC – Weekly Bottom Central Pivot
5. PDH – Previous Day High
6. PDL – Previous Day Low
7. PWH – Previous Week High
8. PWL – Previous Week Low
9. PMH – Previous Month High
10. PML - Previous Month Low
11. WR1, WR2 – Weekly Resistance Levels 1 & 2
12. WS1, WS2 – Weekly Support 1 & 2
13. 5m 200 EMA – 5 Minutes 200 Period Exponential Moving Average
14. 15m 200 EMA – 15 Minutes 200 Period Exponential Moving Average
15. 1H 200 EMA – 1 Hour 200 Period Exponential Moving Average
16. 1H 200 SMA – 1 Hour 100 Period Simple Moving Average
17. 1D 200 EMA – Daily TF 100 Period Exponential Moving Average
Settings:
To turn ON and OFF any of these levels if it does not require, Go to Indicator Settings and disable the specific levels.
Alerts:
You can enable the Buy / Sell signal Alerts by creating new alert.
To Access the Indicator:
If you want to know more about the indicator & to access for your trading please check the link in the signature below.
If you have any doubts please mention it in the comment section.
Looking forward your valuable comments and feedbacks to improve further in accuracy of our Trading.
Thanks!!

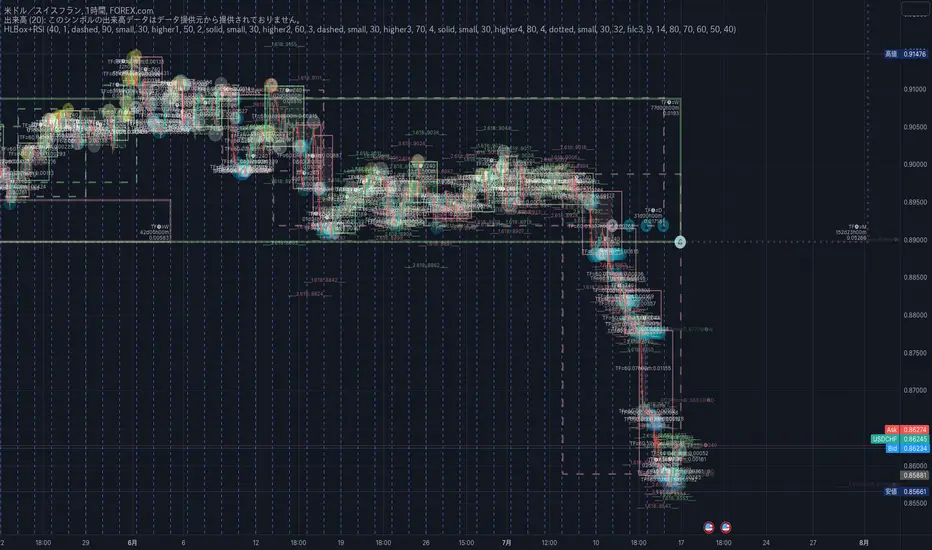
HTF Liquidity Levels█ OVERVIEW
The indicator introduces a new representation of the previous days, weeks, and months highs & lows ( DWM HL ) with a focus on untapped levels.
█ CONCEPTS
Untapped Levels
It is popularly known that the liquidity is located behind swing points or beyond higher time frames highs/lows (in a sense, an intraday swing point is a day high/low). These key areas are said "liquid" because of the accumulation of resting orders, mainly in the form of stop-loss orders. And this more significantly on higher time frames which have more time for stacking orders. As the result, the indicator aims to keep track of untapped levels that have their liquidity states intact.
Liquidity Pools
Once a liquidity level identified, or better, a cluster of liquidity levels work as magnets for the market. The price is more likely to make its way towards heavier pockets of liquidity, by proximity (the closest liquidity pool), and by difficulty (path with less obstacles). This phenomenon is referred as liquidity run, raid, purge, grab, hunt, sweep, you name it. Consequently, the indicator can help you frame a directional bias during your trading session.
█ NOTES
Drawings
Once a level is tapped, it is highlighted. At the end of each day, all tapped levels are cleared.

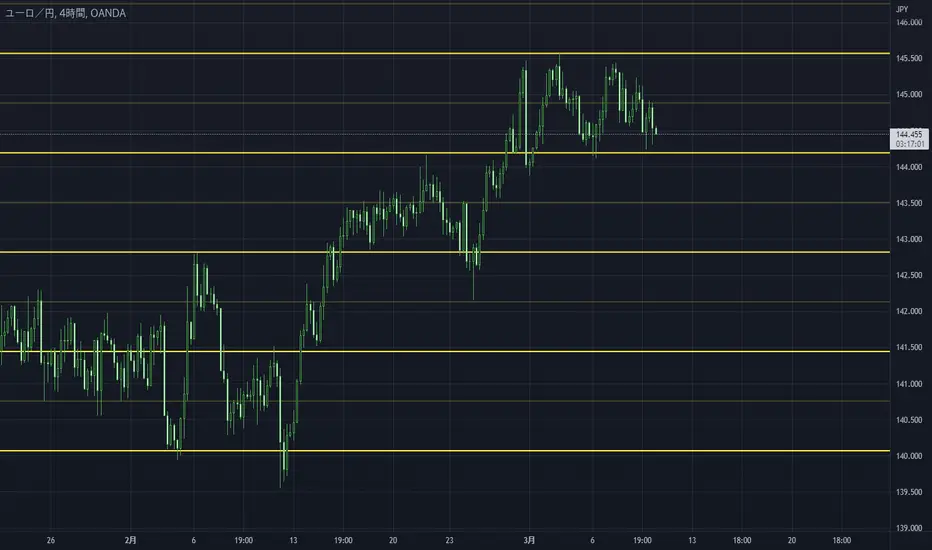
Session LevelsThis indicator plots important session (intraday) levels for the day. It plots high and low of previous day, week, month, 52 week and all time. Also plots the vix range which shows the daily expected trading range of the instrument. These levels acts as important support/resistance for the day.
For example, if price closes above previous day, week, or month high/low it indicates bullish sentiment and vice versa for bearish.
Vix Range plots top, center, bottom line for expected trading range for the day. It is calculated based on the volatility index selected (NSE:India VIX is used by default).

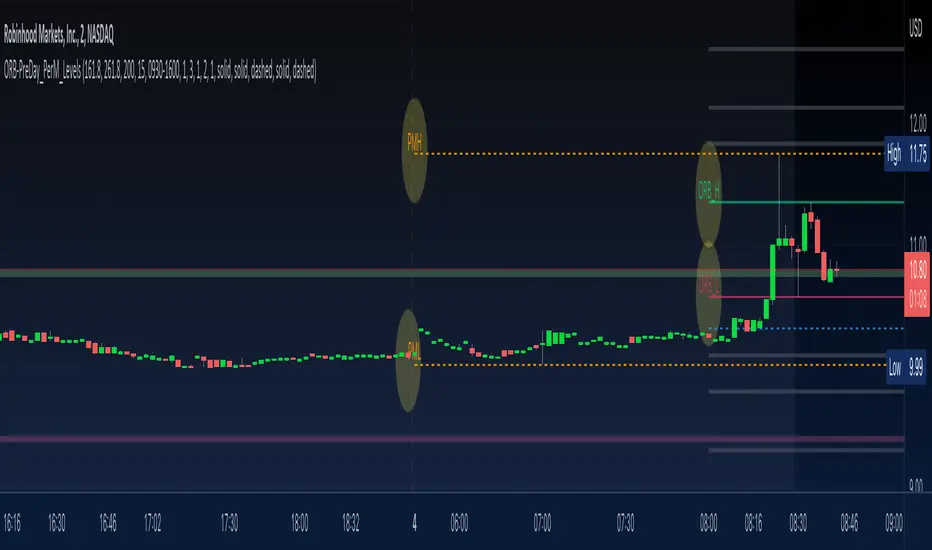
ORB-PreDay_PerM_LevelsThis script provides following levels:
1. ORB Level - You can adjust the timeframe of Opening Range (plots from 9am to 4pm)
2. ORB Fib Extension - 1.618 and 2.618 Fibonacci Extension of ORB High and Low (plots from 9am to 4pm)
3. Previous Day High/Low/Close - You can adjust color/thickness of the lines (plots from two days ago so that you can clearly see the levels)
4. Previous Two Days High/Low (plots from two days ago so that you can clearly see the levels)
5. Pre-Market High/Low (plots from 6:30am to 11am)
All in one indicator gives much better clarity of where current instrument is trading in relation to ORB, Previous Day Levels and Previous Two Days Levels along with Pre Market Levels.
You could combine these levels with your favorite EMA or EMA Cloud to create a trading system.
You could combine these levels with MA Cloud and ATR vs DTR script to gauge the move.
Look at the TWTR Chart today and see how these levels are respected.
Previous N Days/Weeks/Months High LowJapanese below / 日本語説明は下記
This indicator displays previous N days/weeks/months’ highs and lows simultaneously.
N is user input and users can separately input different N for highs and lows.
For instance, if you would like to show past 20days high and 10days low, you specify 20 for high and 10 for low.
Similar to highs and lows of yesterday, last week and last month which I previously developed a indicator for(see the link below), highs and lows of specific terms such as quarters are also respected as supports and resistances.
A legendary trader group, Turtles also uses 20days high/low break as one of their strategies.
Alerts can be set with the conditions below.
-Crossing over previous day’s high
-Crossing under previous day’s low
-Crossing over previous week’s high
-Crossing under previous week’s low
-Crossing over previous month’s high
-Crossing under previous month’s low
Please note that when we say past 2 days in this indicator, past 2days mean yesterday and day before yesterday, so “today” is not included as “today’s” high/low have yet to be fixed.
Related indicator: High/Low Yesterday&Last week&Last month&Last Year
By combining with this indicator, you can highlight important support and resistance.
—————————————————————
過去N日/N週間/Nヶ月の高値·安値を同時に表示することのできるインジケーターです。
Nはパラメーターとなっており、また高値と安値で異なる期間を指定することができます。
例えば、過去20日間の高値と過去10日間の安値という指定が可能です。
昨日、先週、先月の高値·安値と同様に、四半期などの過去一定期間の高値·安値はサポート·レジスタンスとして良く意識されます。
伝説のトレーダー集団タートルズも20日間の高値·安値のブレイクを取引ルールの一つとして使用していたことで有名です。
また、以下の条件でアラート設定が可能です。
-過去N日高値の上方ブレイク
-過去N日安値の下方ブレイク
-過去N週間高値の上方ブレイク
-過去N週間安値の下方ブレイク
-過去Nヶ月高値の上方ブレイク
-過去Nヶ月安値の下方ブレイク
このインジケーターで過去2日間の高値·安値といった場合、過去2日間とは昨日と一昨日の2日間を指します。まだ高値·安値の確定していない本日は含まないことに注意してください。
関連インジケーター: High/Low Yesterday&Last week&Last month&Last Year
当インジケーターと合わせて使用することで、主要なサポートレジスタンスを表示することができます。

HighLow Box Highlight between EarningsHighLow Box Highlight between Earnings
This is an indicator to highlight area between two earning periods and their highest and lowest points.
It also alternates the highlight color in each subsequent block.
Tested to work in 1D charts and 1M charts
Just drop a message, if you want this further developed with more features.
Note: This was requested by user Meatpye on a forum.

Price Clouds Oscillator (PCO)This is the oscillator version of Price Clouds (PS). Use this with (PS) for best results.
This indicator shows you over bought and over sold regions similarly to to rsi or stochastic. This indicator centers a moving average around the hl2 of the price. This is calculated as the difference of four moving averages. The signal line shows you how much momentum in any given direction you have. You can also see how much volatility there is by the band width. Just like the Bollinger band high volatility comes before low volatility and visa versa. You can also see what the market is doing based on the signal crosses. If the fast line is above the slow line you are going up and visa versa. This indicator works in most markets, especially crypto. There is a tool tip for every aspect of this indicator explaining how everything works.
Key Feature:
>See where the price is relative to a mean price
>Measure volatility
>Clean global settings
>Normalization feature lets you scale the band from 0 to 1. You loose some information but its easier to use if you aren't measuring volatility.
I hope you are very profitable with this one!
If you find this indicator is useful to you, Star it, Follow, Donate, Like and Share.
Your support is a highly motivation for me.
PCO
----------------------/\-----
-------------/\----/----\---
\----------/----\/--------\-
--\------/------------------
----\_/---------------------
