Trend FilterTrend Filter
Summary
Trend Filter is a multi-factor trend-confidence indicator that produces a simple, actionable output: Direction (Up / Down / Ranging) and a normalized Confidence %. It is intended as a decision-support overlay to help traders quickly identify whether a market is trending or rangebound, and how strong that directional bias is.
What it shows
A single line in the on-chart table: Direction (Up / Down / Ranging).
A Confidence % (0–100) that combines multiple normalized market signals into a single score.
Optional notification row when a manually-selected reference timeframe does not match the chart timeframe.
Alert conditions when direction changes to Up, Down, or Ranging.
How the indicator works (concise, non-proprietary explanation)
Trend Filter computes a weighted confidence score from several complementary components, each normalized to a 0–100 scale and combined into a single confidence value. The components and their roles are:
EMA structure & spread (trend breadth)
-Uses three EMAs (fast / mid / slow) computed at lengths that scale with the selected/reference timeframe. The EMA spread (fast vs slow) quantifies directional separation.
HH/HL structure and streaks (price structure)
-Counts higher highs/higher lows (and the reverse) across a scaled lookback to measure whether price structure is predominantly bullish, bearish or mixed.
EMA slope (momentum of trend)
-A robust slope approximation (smoothed) measures whether the short EMA is rising/falling relative to its own smoothed history.
ADX / DMI (trend strength)
-Uses a standard ADX-style component to capture directional persistence and dampen the confidence score when the ADX is weak.
ATR (volatility context)
-ATR expressed as a percentage of price helps detect abnormal volatility regimes which affect the validity of trend signals.
Volume context
-Simple volume vs a short SMA gives a participation signal that increases confidence when moves occur with higher volume.
Each component is capped to avoid outsized influence. Components are scaled by a set of weights (configurable in code) and then combined. The final confidence is lightly smoothed before being used to determine direction and to feed alert conditions.
Important implementation & safety design choices (why it’s not a simple mashup)
Adaptive timeframe scaling: EMA lengths and lookbacks are proportionally scaled based on the chosen reference timeframe (Auto or manual). This preserves relative indicator behavior across 1-minute → Daily timeframes without manual retuning of each parameter.
HH/HL structure plus streaks: Instead of relying solely on moving averages or ADX, the script explicitly measures price structure (HH/HL counts and streaks) and blends that with slope/ADX. This reduces false trending signals on noisy price action.
Normalized, weighted combination with caps: Each component is normalized (0–100) and combined by predefined weights; cap thresholds prevent extreme component values from dominating the result. This is a design intended to produce interpretable confidence % rather than opaque binary outputs.
History and loop safety: The code enforces a cap and protects loop lengths against available historical bars to avoid runtime errors and to ensure the script remains stable on short data series.
Practical guardrails: The script includes notification behavior to highlight manual timeframe mismatches and avoids dynamic indexing patterns that can cause unreliable results on small bar histories.
These design decisions — adaptive scaling, structural HH/HL scoring, capped normalization and explicit safety limits — are the elements that distinguish Trend Filter from simple, single-indicator overlays (EMA-only, ADX-only, etc.) and form the basis for why closed-source protection is reasonable for commercial/invite-only publication.
User controls & recommended usage
Reference Timeframe: Auto (uses chart TF) or choose a manual reference TF (1min → D). When manual TF is selected, the table shows a mismatch warning if the chart TF differs.
Table placement & colors: Positioning and appearance of the on-chart table are configurable.
Confidence thresholds: The indicator uses internal thresholds to mark high/medium/low confidence. Users can interpret the Confidence % relative to those ranges.
Alerts: Built-in alerts fire only on direction changes (to Up, Down, or Ranging). Use alerts as a signal to review the chart rather than an instruction to trade automatically.
How traders typically use it
Add Trend Filter as an overlay to your chart.
Confirm that the recommended reference timeframe is appropriate (Auto will adjust automatically).
Use Direction and Confidence % together: high Confidence + Up (or Down) suggests staying with trend; Ranging suggests avoiding trend-following entries.
Combine this filter with your entry/exit rules (price structure, support/resistance, or your preferred signal generator).
Disclaimers & limitations
This is a decision-support indicator, not an automated execution strategy. It does not place orders and does not provide P/L or backtesting statistics.
Confidence % is an aggregated measure — treat it as context, not a guarantee.
Results vary across symbols and timeframes; use appropriate position sizing and risk controls.
The code intentionally includes history and loop safeguards; on very short histories the indicator may display conservative results.
Higherlow

Higher High Lower Low Higher High Lower Low 🦉{Phanchai} — TradingView Description
Structure detector with dynamic Support/Resistance, customizable labels, and ready-made alerts (Pine v6).
This script marks market structure turning points — HH (Higher High), HL (Higher Low), LH (Lower High), LL (Lower Low) — and builds segmented Support/Resistance lines from those turns. Labels and colors are fully customizable and the script ships with multiple alert conditions.
What it does
Detects swing pivots using left/right bar windows, then classifies each confirmed swing as HH/HL/LH/LL.
Plots compact labels at the confirmed pivot bars with tooltips (English).
Derives dynamic Support / Resistance : every time structure flips, the previous level is closed and a new segment starts, extending to the right .
Provides alert conditions for any label and for specific first-occurrence shifts (e.g., first HH after a bearish label).
How it works (in short)
A pivot high/low confirms only after Right Bars candles have closed; labels and S/R appear at that confirmation bar.
An internal backbone (zigzag-like) is built from confirmed pivots, with light consistency checks to avoid contradictory sequences.
Structure rules compare the recent five pivots (A…E) to decide HH/HL/LH/LL.
S/R is updated from structure: e.g., in an up leg, new HLs refresh Support; in a down leg, new LHs refresh Resistance.
Alerts included
Any structure label (HH/HL/LH/LL) — Fires on any new label.
First LL after HL/HH — First bearish break after a bullish label.
First HH after LL/LH — First bullish break after a bearish label.
LL or HL formed — Any low-side label.
LH or HH formed — Any high-side label.
HL formed
HH formed
LL formed
LH formed
How to use (quick start)
Add the indicator to your chart.
Choose Left/Right Bars for your timeframe (e.g., 5–10 for intraday; larger for higher timeframes).
Pick your label colors/sizes and S/R style.
Right-click the chart → Add alert… → Condition: this indicator → select the desired alert.
Notes & tips
Because pivots require Right Bars to confirm, labels and S/R appear with a natural delay of that many bars. This avoids repainting.
Raising Left/Right Bars reduces noise and increases the average distance between pivots; lowering them increases sensitivity.
Structure is strict: sometimes you may see two HL (or two LH) in a row if the intermediate opposite swing didn’t qualify as HH/LH (or LL/HL).
S/R segments are drawn with line objects ; they are controlled via Inputs (style/width/color), not the Style tab.
This tool highlights structure; it’s not a standalone entry/exit system. Combine with volume, trend, or risk management rules.
Built with Pine v6. Clean, compact labels; segmented S/R that updates only on confirmed changes; comprehensive alerts ready for automation.

WLI Swing High/Low advnc indicatorfor Class members
else
label.set_xy(lowMsg, bar_index, close)
label.set_text(lowMsg, "making New Low")
label.set_color(lowMsg, newSwingLowColor)
label.set_textcolor(lowMsg, color.white)
else
if not na(lowMsg)
label.delete(lowMsg)
lowMsg := na

*Zig Zag Price, % Change w/RSI*With immense help from ©SimpleCryptoLife who reimagined this script for me, and to ©mmoiwgg and ©ocaptain who's ideas led to this updated version 5.
This indicator is fairly straight-forward and visually appealing because you get a running zig zag price, price % change with an added bonus - RSI. However you won't find zig zag lines but the script reacts the same by changing the inputs. The higher the value the less data points you'll see on the screen.
The main objective of this indicator is to be able to spot high and low prices easily with the price % change between the same 2 data sets. Additionally and arguably more importantly, with the RSI values associated with the high and low prices, you can spot divergences easily - meaning the price is making a higher high while conversely the RSI value at the next pop (around the same price as previous high) is lower which can mean that momentum has exhausted for the time being and a reversal could be imminent.
This script is meant only as a tool to try to enrich your trading journey and I hope it helps you become a more consistent and profitable trader. If you find it invaluable drop a like and comment. Good luck!

Buy and Sell Indicator This indicaor is draw time(ex 09:15 nifty 50) high and low of candle ..
for buy condition -
1) when price is crossing time candle high open a long trade
2) check for condition is this trade open less thn previous trade
if both condition are true thn open a buy trade
for sell condition -
1) when price is crossing time candle low open a short trade
2) check for condition is this trade open grater thn previous trade
if both condition are true thn open a sell trade
to build logic of 2nd condition @fikira help me thnx mate ...

Williams Fractals - LH/HLSame of original Williams Fractals, but with the following changes
- changed arrow directions
- added option to show Lower Highs and Higher Lows
- added alerts for Lower High and Higher Low
Enjoy~~

Dow Theory Trend Direction VisualizerJapanese below / 日本語説明は下記
Overview
What is difficult for beginner traders is to identify trend occurrence, continuation and reversal.
This indicator visualizes market direction by changing background colors based on Dow Theory so that traders can visually grasp trends.
Sample chart
Functions
1.MTF Higher High/Lower High/Higher Low/Lower Low(HH/LH/HL/LL)
Indicator shows HH/LH/HL/LL of an upper timeframe(MTF) and those of chart’s timeframe at the same time.
As usual, HH/LH/HL/LL of chart’s timeframe can be used to identify trend continuation based on Dow Theory while MTF HH/LH/HL/LL can be used as support/resistance.
Auto and manual mode for MTF
When you select “Auto” mode, then an upper timeframe will be automatically determined as MTF based on chart’s timeframe. If “Manual “ mode selected, then you need to specify MTF timeframe.
MTF HH/LH/HL/LL are displayed only below the selected MTF timeframe so it will not disturb when you open higher timeframe.
For instance, if you select daily timeframe as MTF, then HH/LH/HL/LL of daily timeframe will be shown on 4 hour or below timeframes.
Sample chart (AUDJPY 4H + Daily timeframe HH/LH/HL/LL )
In this chart, you can see two different timeframe’s trend.
In 4hour timeframe, a new high recorded as HH and in daily timeframe, lows going up from LL to HL and high going up from LH to HH hence daily chart is uptrend.
Also, you can predict that Daily HH would be respected as resistance line.
2.Visualize trends direction with colors based on HH/LH/HL/LL.
Background color will change based on break up/down of HH/LH/HL/LL.
———————
トレードを習得する上で多くの人が苦手意識を持つ「目線付け」。
この目線付けをダウ理論を元に訓練するためのインジケーターを開発しました。
高値·安値の更新状況に応じて相場の方向性を色で可視化するため、視覚的に目線付けをすることが可能です。
サンプルチャート
ダウ理論による目線付けの二つの方法
これは僕の持論ですが、ダウ理論による目線付けの方法には、「トレンドは明確なシグナルが出るまで継続する」という原則を共通の拠り所とする二つの方法があると考えています。
一つは日本人投資家/トレーダーにも良く知られている押し安値·戻り高値を基準とする方法。そしてもう一つは高値·安値の切り上げ·切り下げのみを基準とする方法です。
このインジケーターは後者の方法で目線を可視化します。
(もちろん押し安値·戻り高値と併用した目線判断にも活用可能です。)
機能
1.上位足とチャートの時間軸両方のHigher High/Lower High/Higher Low/Lower Low(HH/LH/HL/LL)の表示(MTF機能)
上位足タイムフレームのHH/LH/HL/LLとチャートタイムフレームのHH/LH/HL/LLを同時に表示することができます。
チャートタイムフレームのHH/LH/HL/LLはダウ理論に基づくトレンドの継続・反転の判断用に、上位足のHH/LH/HL/LLは上位足での高値・安値の切り上げ/切り下げ判断及びレジスタンス・サポートとして使うことができます。
上位足の選択には自動モードとマニュアルモードが選択可能です。自動モードを選択した場合、チャートのタイムフレームに応じて上位足が自動的に決定されます。マニュアルモードの場合は選択した時間軸が上位足タイムフレームとして適用されます。
上位足のHH/LH/HL/LLは選択したタイムフレーム未満でのみ表示されます。例えば上位足のタイムフレームとして日足を選択した場合、日足のHH/LH/HL/LLは日足未満でのみ表示されます。
サンプルチャート (AUDJPY 4H に日足のHH/LH/HL/LL を表示)
このチャートでは二つの異なるタイムフレームの高値・安値更新状況を一度に把握することができます。
4Hでは高値の切り上げが発生しているため、安値を更新しなければ上昇トレンド確定です。一方日足では安値がLLからHLへ(赤の矢印)、高値がLHからHHへと切り上がり(緑の矢印)、上昇トレンドであることがわかります。
また、この場面では上位足のHHがレジスタンスとして機能する可能性も予測できます。
2.目線の方向を色で可視化
HH/LH/HL/LLの更新状況から目線を判断し、背景色とともに可視化します。
Higher High/Lower High/Higher Low/Lower Lowとは何か?
日本人投資家/トレーダーの中にはあまり馴染みのない方もいるかと思いますので、定義を記載します。
Higher High(HH)
切り上がった高値を意味します。当インジケーターでは一つ前の高値(HH/LH)から切り上がった場合にHHとしています。
Lower High(LH)
切り下がった高値を意味します。Lower Highなのでより低い方の高値という意味です。当インジケーターでは一つ前の高値(HH/LH)から切り下がった場合にLHとしています。
Higher Low(HL)
切り上がった安値を意味します。Higher Lowなのでより高い方の安値という意味です。当インジケーターでは一つ前の安値(HL/LL)から切り上がった場合にHLとしています。
Lower Low(LL)
切り下がった安値を意味します。当インジケーターでは一つ前の安値(HL/LL)から切り下がった場合にLLとしています。
使い方
高値·安値の切り上げ·切り下げの判断及びトレンド継続·転換の判断に活用

SequenceSee the highs and lows easily!
Up sequence:
The close of each candle is higher from the low of the previous candle.
* The reference will always be to the low of the highest candle in the up sequence
Down sequence:
The close of each candle is lower from the high of the previous candle.
* The reference will always be to the high of the lowest candle in the down sequence
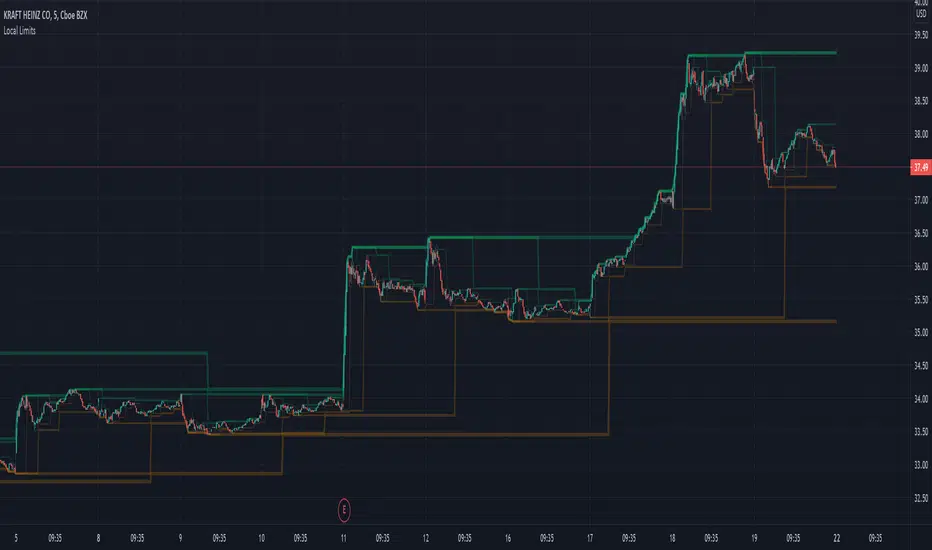
LocalLimitLibrary "LocalLimit"
Calculates the local upper or local lower limit for a given series. Applying multiple passes produces what appears like support or resistance levels.
See Local Limits for more detail.
upper(src) Produces the recent local upper limit for a given series.
Parameters:
src : The source series to derive from.
lower(src) Produces the recent local lower limit for a given series.
Parameters:
src : The source series to derive from.

LH-LL/HL-HH Confirmation Trend LineBased on Dow Theory, a series of successive higher highs (HH) and higher lows (HL) is the sign of an uptrend (bull trend) and a series of successive lower highs (LH) and lower lows (LL) is the sign of a downtrend (bear trend).
So this script indicates the trends using the concept and draws corresponding trend lines.
It took some effort to make it possible for users to see as many trend lines as they wish. Eventually the user could set the number alongside some other options in the indicator settings.
Use the script and send me your thoughts!

Local LimitsDisplays recent higher highs, lower highs, lower lows, and higher lows as a collection of local limit indicators.
In its simplicity is a lot more powerful than might appear at first glance.
Does not rely on volatility calculation.
Can be linked together to create an objective view of recent support and resistance levels.
Makes current trends more visible.
Excellent for use as a trailing stop algorithm.
Parameters
Single Bar Sensitivity: True (default) reacts to individual bars. False only responds to the alignment of 2 bars.
Margin (1-5): Adds extra distance from higher lows and lower highs to reduce the sensitivity of broken trends.
Single indicators with configurable sources:
Local Limit Higher
Local Limit Lower
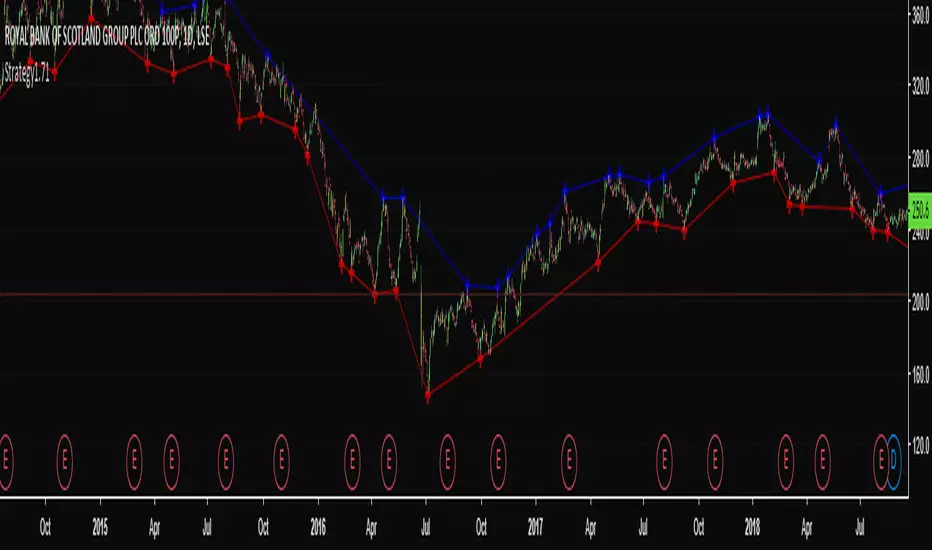
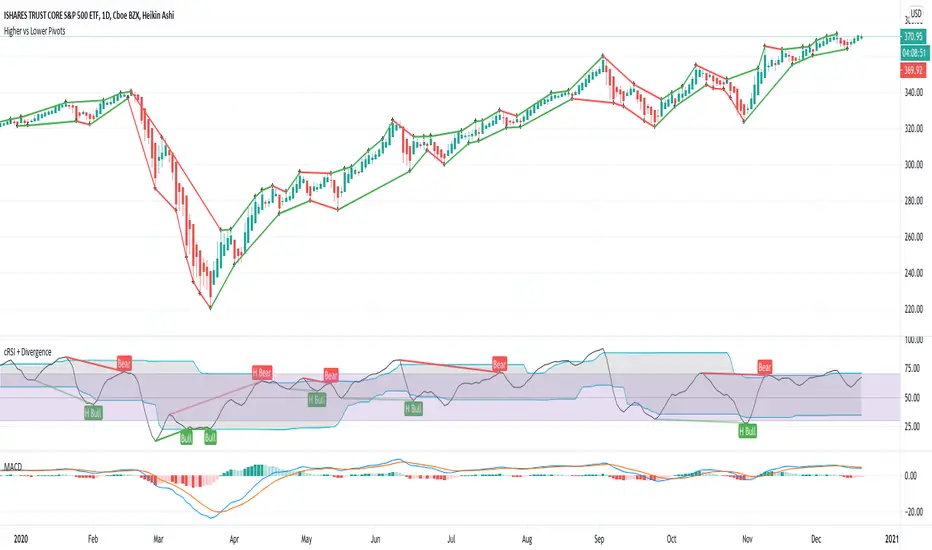
Higher vs Lower Pivots overlayA simple script that I made that draws lines between the high and low pivots. The color of the line define if the pivot is higher or lower than the previous pivot. The main thing to tune is the pivot look back vs look ahead, which are the same params used by the tradingview pivot indicator. There are several other params you can tweaks to get the look you want.
Double Zig Zag with HHLLHello Traders,
Here Double Zig Zag with HHLL script is with you. it calculates 2 Zig Zag simultaneously and draws them, and also it calculates and puts Higher High, Lower Low, Higher Low, Lower High labels. All these are done dynamically, it means last HH/HL/LL/LH can change. if price continues to go up then HL can turn to LL or if price continues to go down then LH can turn to HH. This script can be used for different purposes such trend analysis, support/resistance levels, breakouts etc.
I tried to make many things optional:
You can set Periods for Zig Zags as you wish
You can set different colors for both Zig Zag Up/Down lines
You have option to show both Zig Zag, one of them or none them
You have option to show both HHLL, one of them or none them
You can set Zig Zag 1 line style as Dashed or Dotted
You can set Line Widths for Zig Zags
Some examples:
Enjoy!

Swing Highs/Lows & Candle Patterns [LuxAlgo]This script labels swing highs and swing lows as well as the candle pattern that occurred at that precise point. The script can detect the following 6 candle patterns: hammer, inverse hammer, bullish engulfing, hanging man, shooting star, and bearish engulfing.
This indicator by its very nature backpaints by default, meaning that the displayed components are offset in the past.
🔶 USAGE
It can be interesting to see if a top or bottom is associated with a specific candle pattern, this allows us to study the potential of such a pattern to indicate a reversal. You can hover on a label with a specific pattern to see more details about it.
The notations HH, HL, LH, and LL you can see on the labels are defined as follows:
HH : Higher high
HL : Higher low
LH : Lower high
LL : Lower low
🔶 SETTING
Length: Sensitivity of the swing high/low detection, with lower values returning the maximum/minimum of shorter-term price variations.

Higher/Lower Highs & LowsThis script prints higher highs , higher lows , lower highs and lower lows , as well as the last support or resistance line.
It can be configured with one parameter "lookback" which determines how fast the trend changes direction.
Alerts can be setup for each event.
Please note: the triangles are plotted with a 1 bar offset, meaning you will receive the alert 1 bar after, since the script is waiting for a price drop/climb to validate a higher/lower high/low.

Premarket High/LowThe script draws the high and low of the premarket session and based on these levels the ATR is added and also displayed on the chart as lines.
You can change:
- The Session Timeframe
- The ATR Multiple
- If the Aftermarket Session should be included

Use On Renko Chart - Cheap Entry Signals HI BIG PLAYERS,
in according of an enquiry from an user of tradingview I coded this script for free.
This script allows to identify a trend on the basis of higher high & higher low and lower high & lower low. And only after this fulfill conditions the entry signal comes out. The enquiry relates to Renko-charts, this is why it was build more usable on Renko-Charts.
In addition, it is possible to choise yourself the view of highest/lowest peaks and signals in the options.
Please give me a like to this indicator and of course: you are invited to follow me or visit my other scripts in relation to Wolfe Wave and Elliott Wave.
King regards
NXT2017

Swing PointsThis indicator gives a clear indication of price action swing-points as well as an indication of whether it is a higher, lower, or equal swing point relative to the last high/low.


High & Low Pivot Strategy v1.0A system that determines what direction the market is trending by analysing previous high and low pivot points to set up an entry trade.