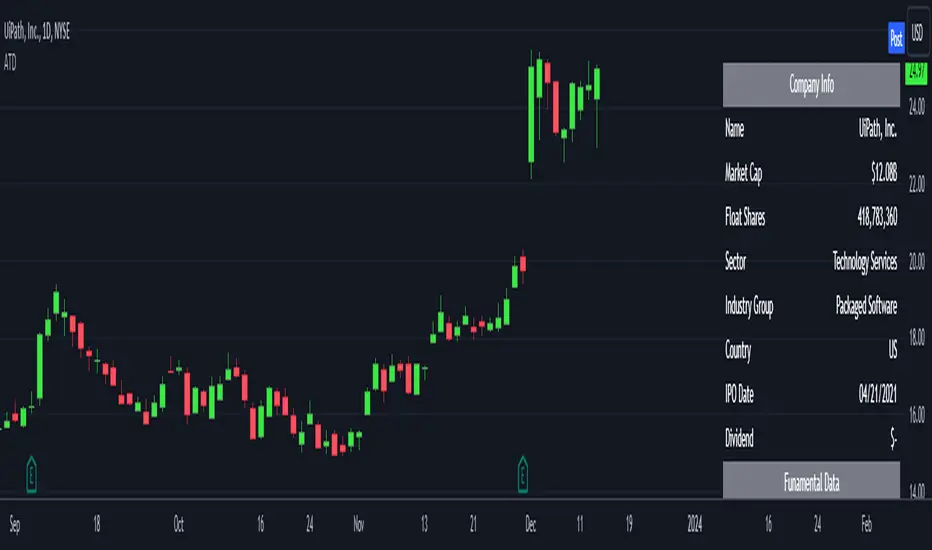
Analytics Trading DashboardThe Analytics Trading Dashboard is a tool designed to bring key information about a company into an easy-to-view dashboard. The indicator combines Company Info, Fundamental Data, Price & Volume Data, and Analyst Recommendations all into one table.
Let’s dive into the details by section:
Company Info:
Name – Company name.
Market Cap – Total dollar market value of the company’s outstanding shares of stock.
Float Shares / Shares Outstanding – Floating shares indicate the number of shares available for trading. Outstanding shares are any shares held by shareholders and company insiders.
Sector – The stock's sector.
Industry Group - The industry group the stock belongs to.
IPO Date – Date on which a security is first publicly traded.
Dividend – The latest dividend amount if the company pays one.
Fundamental Data:
EPS Due – The date the company is set to report earnings next.
EPS Est Next Qtr – The earnings per share estimate for the upcoming report.
EPS Est % Chg (Current Qtr) – The earnings growth as a percentage based on the reported earnings of the same quarter from the previous year.
EPS % Chg (Last Qtr) – The earnings growth of the last reported quarter as a percentage versus the same quarter from the previous year.
Last Qtr EPS Surprise – The amount reported earnings beat or missed estimates from the last reported quarter.
Last 3 Qtrs Avg. EPS Growth – The average percentage growth of the last 3 earnings reports.
# Qtrs of EPS Acceleration – The number of consecutive quarters that EPS has increased.
Last 3 Qtrs Avg. Rev Growth – The average percentage growth of the last 3 revenue numbers reported.
# Qtrs of Rev Acceleration – The number of consecutive quarters that revenue has increased.
Gross Margin – Measures gross profit compared to revenue as a percentage.
Debt/Equity Ratio – The ratio of debt to equity, or financial leverage.
Price and Volume Data:
52 Week High – The highest high of the last 52 weeks.
% Off 52 Week High – The percentage the current price has decreased from the 52-week high.
Price vs. Moving Average – The distance as a percentage that the current price is from the selected moving average.
Average Volume – The average number of shares traded based on the selected lookback period.
Average $ Volume – The average of the total value of shares traded based on the selected lookback period.
Pocket Pivots – The number of pocket pivots that have occurred in the selected lookback period.
Up/Down Volume Ratio - A 50-day ratio derived by dividing total volume on up days by the total volume on down days.
ATR – The average true range shown as a dollar value and percentage of current price.
ADR – The average daily range shown as a dollar value and percentage of current price.
Beta - Beta is a measure of its volatility relative to the overall market, indicating how much the stock's price is expected to fluctuate compared to the market average.
Analyst Ratings:
Strong Buy – The number of strong buy recommendations.
Buy – The number of buy recommendations.
Hold – The number of hold recommendations.
Sell – The number of sell recommendations.
Strong Sell – The number of strong sell recommendations.
The Analytics Trading Dashboard also comes with the flexibility to select your preferred moving average for price and volume analysis, as well as to choose the specific lookback period for calculating the Average True Range (ATR), Average Daily Range (ADR), and Pocket Pivots lookback period.
Fundametals
TeoTrading 37 - V1 - Ratios AFThis indicator prints fundamental data:
P/E Ratio.
Debt To Ebitda.
EPS (Earnings Per Share).
The fisrt column is the data of the Ticker opened in the graphic. In the configuration parameters you can enter the other three Stocks to compare.
The data is provided by FactSet across Tradingview.
This is the first version of the indicator, I am testing it. You can tell me if you find any bug. Thnaks!

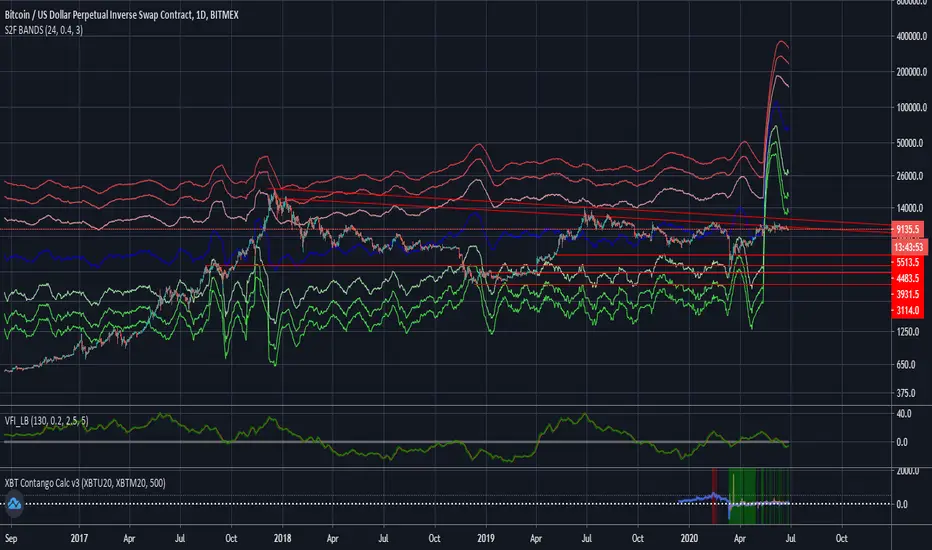
Stock to Flow Model with Standard Deviation BandsThis Study takes the Stock to Flow Model for Bitcoin as presented by 100trillionUSD and smoothes it using an SMA. Then it calculates the close's standard deviation from it and displays the 2-Sigma Bands.
The stock to flow model seems to be one of the best predictions of Bitcoins price.
The standard deviation bands are supposed to show situations in which Bitcoin is significantly over- or under-bought.