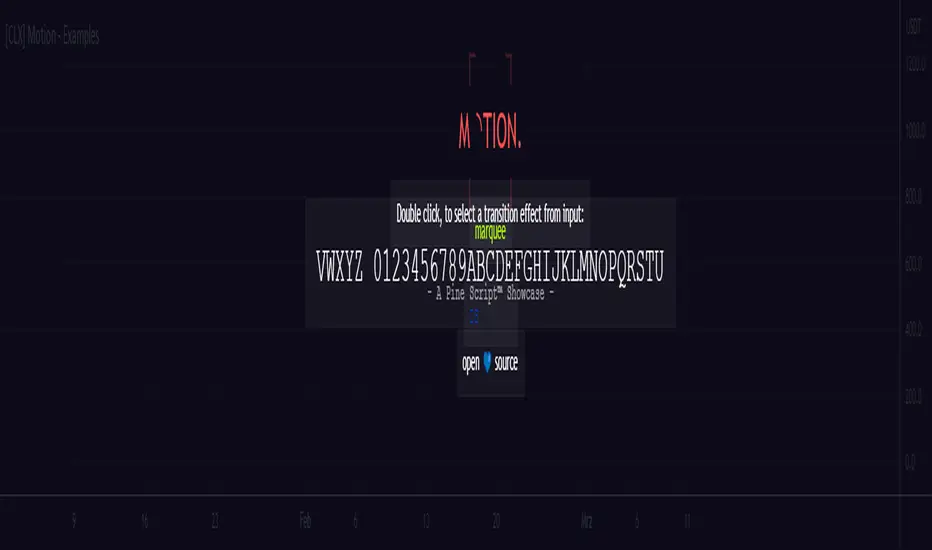
[CLX] Library Motion - Examples📑 Showcase
This is ready-to-show indicator version of the example code form the `motion` library. It can be used to create string- or color-based effects.
Library:
================================================================================
📑 Setup
To use this library in your own scripts, you must first import it. To do this, add the following line to the top of your script:
import cryptolinx/Motion/1 as motion
Next, create a `keyframe` object by using the `varip` keyword.
varip myKeyframe = motion.keyframe.new(_intv = 1, _steps = 1)
Based on your needs, you can now use one of the simplified functions to create a transition effect, or you can use the `transition()` or `iteration()` function to create a custom transition effect.
📑 Simplified Functions:
(direct output)
// motion.marquee(keyframe myKeyframe, string _seq, int _ws, int _maxLoops, bool _ltr)
motion.marquee(myKeyframe, 'Hello World!', 3, 0) // 0 = infinite loops
// motion.slideInLeft(keyframe myKeyframe, string _seq, int _ws, int _maxLoops, bool _refill)
motion.slideInLeft(myKeyframe, 'Hello World!', 3, 0) // 0 = infinite loops
// motion.slideOutLeft(keyframe myKeyframe, string _seq, int _ws, int _maxLoops, bool _refill)
motion.slideOutLeft(myKeyframe, 'Hello World!', 3, 0) // 0 = infinite loops
// motion.slideInRight(keyframe myKeyframe, string _seq, int _ws, int _maxLoops, bool _refill)
motion.slideInRight(myKeyframe, 'Hello World!', 3, 0) // 0 = infinite loops
// motion.slideOutRight(keyframe myKeyframe, string _seq, int _ws, int _maxLoops, bool _refill)
motion.slideOutRight(myKeyframe, 'Hello World!', 3, 0) // 0 = infinite loops
// motion.blink(keyframe myKeyframe, string _seq, int _ws, int _maxLoops)
motion.blink(myKeyframe, 'Hello World!', 3, 0) // 0 = infinite loops
(indirect output)
// After you create a transition, you can use the `output` field of the `keyframe` object to get the result.
// motion.marquee(myKeyframe, 'Hello World!', 3, 0)
myKeyframe.output
Fade
Fading Moving AverageThis indicator uses repainting to remove historic moving average data for a cleaner chart.
The line will be fully invisible when the length of the moving average in candlesticks has occurred.

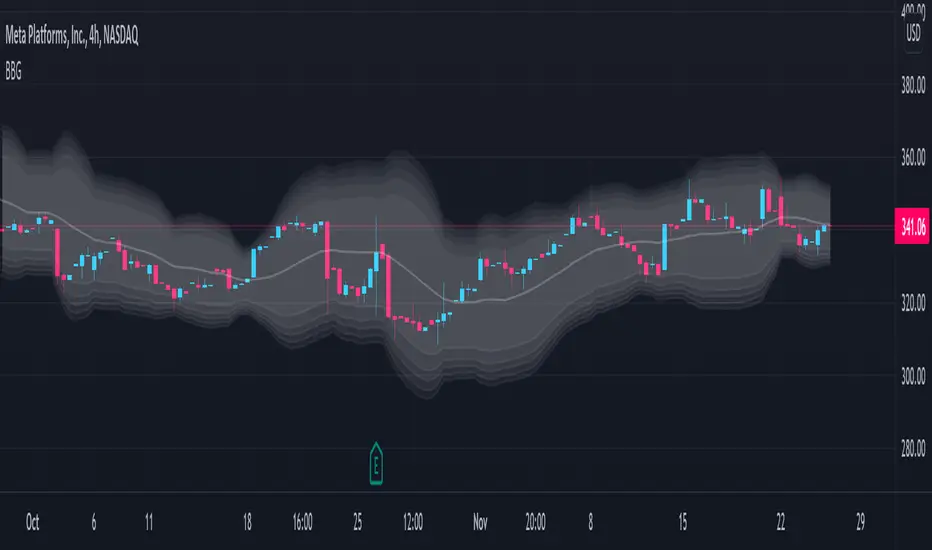
Bollinger Band Gradient (BBG)The Bollinger Band Gradient Indicator uses plenty of Bollinger Bands to create a gradient-looking indicator to help with layered entries . It is similar to a Ribbon but better. This indicator is best used with any volume-related indicator so you can recede from entering into any position with too much momentum to rebound off of any line. Note that this indicator is best used with another strategy like pair trading. It is not recommended to trade based on this indicator only . Please stay aware of any news about the stock you are trading because some events may have a big impact and force the market to go bullish/bearish by a lot. This indicator can be used with all chart types and works well with many other indicators. It allows for complete customization and offers easy-to-understand settings which can be designated to a certain individual. You can modify all settings for the BBs which allows for an even more personalized and adapted Indicator that reflects your trading/ investing needs. You also have the option to choose which type of MAs will be used to create the Bollinger Bands , a few of which include: SMA, EMA, WMA, HMA, RMA, DMA, LSMA, VAMA, TMA, MF.
Bollinger Bands are a way to measure and visualize volatility . As volatility increases, the wider the bands become, and the more they deviate from the basis. Likewise, when volatility decreases, the gap between the bands and basis decreases. Yet a big advantage for not only this but many other indicators is created due to the ample count of different settings that are widely used, it is difficult to view the market through the eyes of all types of investors/traders . This indicator manages to counter exactly this issue, you will be able to see all of these settings on one chart and at one time and enter/exit positions accordingly.
Using this indicator will allow you to visualize entry and exit points with ease and make order layering (buying/selling in layers) much more simple. You can choose a certain amount of Bollinger Bands you would like displayed and customize all technical and style-related settings related to the BBs .
A few of the technical settings you can change for the Bollinger Bands are:
Bollinger Band count (Select how many BBs you want to be displayed.)
MA type used to make the Bollinger Bands ( EMA, SMA, WMA, etc.)
Source (close, open, high, low.)
BB length separately (The length of each Bollinger Band, its lookback. How many previous candles should it be based on? Choose each Bollinger Band's lookback length.)
BB deviator separately(The standard Deviator applied for the BB for both the upper and lower line.)
A few of the style settings you can change for each Bollinger Band are:
Fill (the color used to fill from the upper to the lower band)
Fill opacity % (the opacity used when filling the upper line to the lower line)
This indicator is unique because it can be used for all strategies and all trading styles , for example, day trading or long-term investing, really anything if used correctly. The reason it can be used in so many instances is a result of the detailed and in-depth settings tab that allows for complete customization. This allows the indicator to be used and to be useful in various situations and allows you to dominate the market. Integrated alerts also enhance your efficiency while using this indicator because you can choose to be notified at the crossing of any of the Bollinger Bands.
The technical part of this indicator plots the selected amount of Bollinger Bands using custom-built specified Bollinger Bands accordingly. Then it uses the style settings and styles it as you selected.
Bollinger Band Color BarsThis is a simple addition to the built in Bollinger Bands script. All it does is replaces the traditional plotting of Bollinger Bands with color bars.

CDub's BolBands SetupUses a set of Bollinger Bands (user defined deviation, user defined deviation * 2) to determine possible entry set ups.
Signals are triggered when price crosses the first band (closest to the baseline MA) in the desired direction.
baseline can be your take profit 1 target
The inside band determines entry and can be used as a take profit 2 target (Opposite side of baseline)
The outside band is a suggested stop loss target (Same side of baseline) and can be used as a take profit 3 target (Opposite side of baseline)
Suggestions are welcome!
-CDub

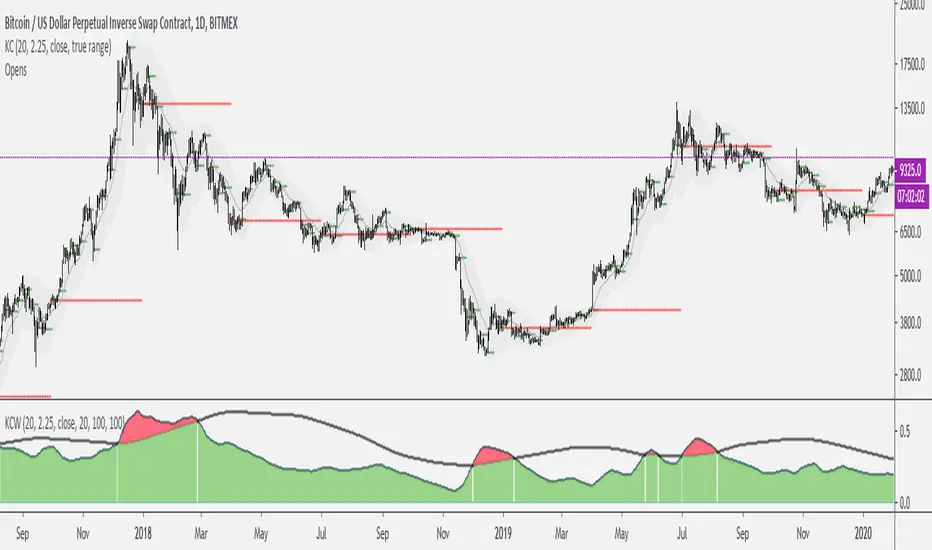
Keltner Channels WidthSimilar to bollinger bands width, but for keltner channels, designed to recognize when a move is exhausted and contraction is to be expected.
Would use it as a filter to stay out of any trades if the indicator peaks (red color).
PivotBoss TriggersI have collected the four PivotBoss indicators into one big indicator. Eventually I will delete the individual ones, since you can just turn off the ones you don't need in the style controller. Cheers.
Wick Reversal
When the market has been trending lower then suddenly forms a reversal wick candlestick , the likelihood of
a reversal increases since buyers have finally begun to overwhelm the sellers. Selling pressure rules the decline,
but responsive buyers entered the market due to perceived undervaluation. For the reversal wick to open near the
high of the candle, sell off sharply intra-bar, and then rally back toward the open of the candle is bullish , as it
signifies that the bears no longer have control since they were not able to extend the decline of the candle, or the
trend. Instead, the bulls were able to rally price from the lows of the candle and close the bar near the top of its
range, which is bullish - at least for one bar, which hadn't been the case during the bearish trend.
Essentially, when a reversal wick forms at the extreme of a trend, the market is telling you that the trend
either has stalled or is on the verge of a reversal. Remember, the market auctions higher in search of sellers, and
lower in search of buyers. When the market over-extends itself in search of market participants, it will find itself
out of value, which means responsive market participants will look to enter the market to push price back toward
an area of perceived value. This will help price find a value area for two-sided trade to take place. When the
market finds itself too far out of value, responsive market participants will sometimes enter the market with
force, which aggressively pushes price in the opposite direction, essentially forming reversal wick candlesticks .
This pattern is perhaps the most telling and common reversal setup, but requires steadfast confirmation in order
to capitalize on its power. Understanding the psychology behind these formations and learning to identify them
quickly will allow you to enter positions well ahead of the crowd, especially if you've spotted these patterns at
potentially overvalued or undervalued areas.
Fade (Extreme) Reversal
The extreme reversal setup is a clever pattern that capitalizes on the ongoing psychological patterns of
investors, traders, and institutions. Basically, the setup looks for an extreme pattern of selling pressure and then
looks to fade this behavior to capture a bullish move higher (reverse for shorts). In essence, this setup is visually
pointing out oversold and overbought scenarios that forces responsive buyers and sellers to come out of the dark
and put their money to work-price has been over-extended and must be pushed back toward a fair area of value
so two-sided trade can take place.
This setup works because many normal investors, or casual traders, head for the exits once their trade
begins to move sharply against them. When this happens, price becomes extremely overbought or oversold,
creating value for responsive buyers and sellers. Therefore, savvy professionals will see that price is above or
below value and will seize the opportunity. When the scared money is selling, the smart money begins to buy, and
Vice versa.
Look at it this way, when the market sells off sharply in one giant candlestick , traders that were short
during the drop begin to cover their profitable positions by buying. Likewise, the traders that were on the
sidelines during the sell-off now see value in lower prices and begin to buy, thus doubling up on the buying
pressure. This helps to spark a sharp v-bottom reversal that pushes price in the opposite direction back toward
fair value.
Engulfing (Outside) Reversal
The power behind this pattern lies in the psychology behind the traders involved in this setup. If you have
ever participated in a breakout at support or resistance only to have the market reverse sharply against you, then
you are familiar with the market dynamics of this setup. What exactly is going on at these levels? To understand
this concept is to understand the outside reversal pattern. Basically, market participants are testing the waters
above resistance or below support to make sure there is no new business to be done at these levels. When no
initiative buyers or sellers participate in range extension, responsive participants have all the information they
need to reverse price back toward a new area of perceived value.
As you look at a bullish outside reversal pattern, you will notice that the current bar's low is lower than the
prior bar's low. Essentially, the market is testing the waters below recently established lows to see if a downside
follow-through will occur. When no additional selling pressure enters the market, the result is a flood of buying
pressure that causes a springboard effect, thereby shooting price above the prior bar's highs and creating the
beginning of a bullish advance.
If you recall the child on the trampoline for a moment, you'll realize that the child had to force the bounce
mat down before he could spring into the air. Also, remember Jennifer the cake baker? She initially pushed price
to $20 per cake, which sent a flood of orders into her shop. The flood of buying pressure eventually sent the price
of her cakes to $35 apiece. Basically, price had to test the $20 level before it could rise to $35.
Let's analyze the outside reversal setup in a different light for a moment. One of the reasons I like this setup
is because the two-bar pattern reduces into the wick reversal setup, which we covered earlier in the chapter. If
you are not familiar with candlestick reduction, the idea is simple. You are taking the price data over two or more
candlesticks and combining them to create a single candlestick . Therefore, you will be taking the open, high, low,
and close prices of the bars in question to create a single composite candlestick .
Doji Reversal
The doji candlestick is the epitome of indecision. The pattern illustrates a virtual stalemate between buyers
and sellers, which means the existing trend may be on the verge of a reversal. If buyers have been controlling a
bullish advance over a period of time, you will typically see full-bodied candlesticks that personify the bullish
nature of the move. However, if a doji candlestick suddenly appears, the indication is that buyers are suddenly
not as confident in upside price potential as they once were. This is clearly a point of indecision, as buyers are no
longer pushing price to higher valuation, and have allowed sellers to battle them to a draw-at least for this one
candlestick . This leads to profit taking, as buyers begin to sell their profitable long positions, which is heightened
by responsive sellers entering the market due to perceived overvaluation. This "double whammy" of selling
pressure essentially pushes price lower, as responsive sellers take control of the market and push price back
toward fair value.

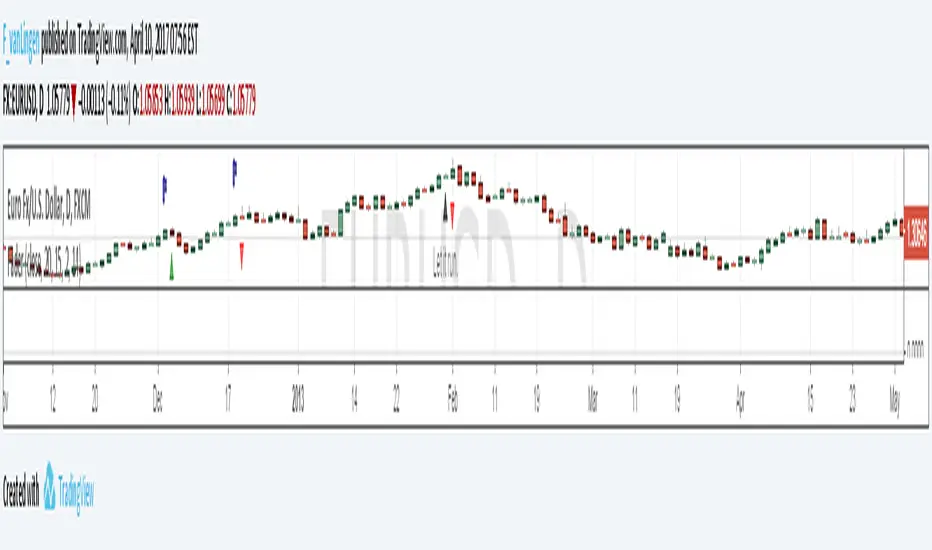
FaderThe Fader indicator finds the moment when trends begin to reverse. It locks down a quick profit which makes it very effective. It also calculates if it's better to stay or leave after a day of having opened the position.
Flags tell you when to buy or sell, red triangles indicate losses whereas green triangles indicate earnings. It has been tested with over 15 currency pairs, and has had consistent earnings.
If you are interested in this indicator please write to me at LingenTrade@gmail.com
B3 Donchian CloudsThis is the Donchian Channel expressed with a percentage cloud. Default 12.5% of the range will be filled at each edge, this helps to show reversal possibilities as price returns to the area between the clouds. This offers a usage to essentially fade the turtle trader system. That system is loosely based on the playing of the breakouts of the the channel... as you can see the that last turtle trade long in YM1! was and is off the charts awesome. I will look for the fall out of the cloud to short the market.
