Elliotwaveanalysis

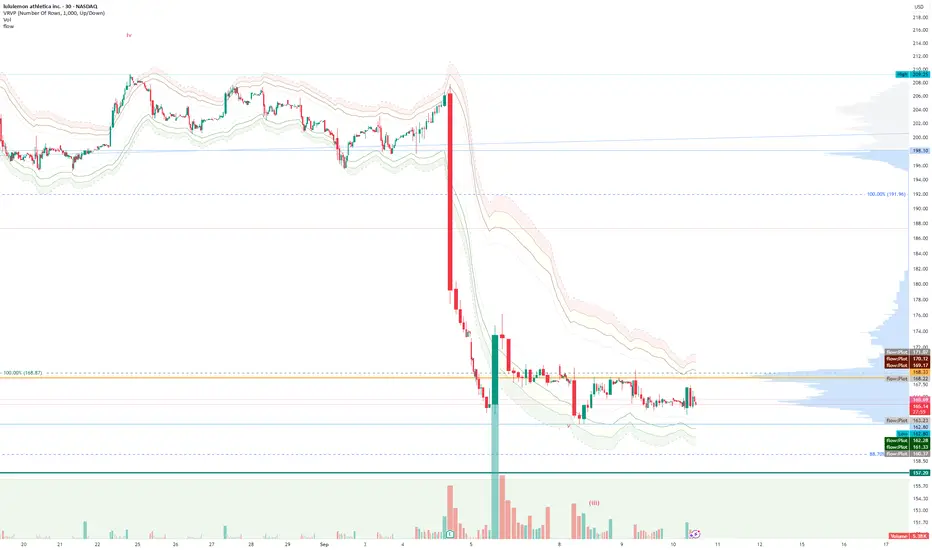
FlowThe indicator attempts to capture the volatility within a range and apply a set of Fibonacci calculations to display a range of bands of varying degrees which represents zones where exhaustion may occur on both sides.
So if price gets in to the yellow or pink zones then the script author is on high alert for a reversal. It must be noted that the user of the script should be fluent in Elliott Wave Analysis as the script was developed to help the author determine if a wave sequence may have ended.
When the indicator glides along one of the green, yellow or pink bands, then the instrument is likely in a 3rd wave, in Elliott wave speak, as such the user of the script would wait and not try to fade the move up or down as continuation is likely. Instead a move away from one of the bands should indicate another attempt at reaching the band after moving away. Thus, this move back in should be a 5th wave of some degree within the timeframe.
The indicator is not bound to any timeframe, as such it works on a 1 minute chart as it does on a weekly timeframe.
One of the observations the author makes is the use of the indicator within a sideways market. The indicator performs very well within these lower volatility environments by indicating exhaustion within these range bound markets.
So in essence, within the framework of Elliott wave analysis and respective time frames. Watch several higher and lower time frames.
1) Once wave 1 has completed
2) Look for a move down to the lower green / yellow zone to identify a wave 2 zone.
3) Once wave 3 starts, do not attempt to fade or short the first touch on the pink zone. Wait for price to move away and then come back in to the pink zone before considering a top and any attempts to fade.
4) Wave 4 should find support on the lower yellow or green band. Where it may be considered that price may change direction.
5) Depending on the time frame and any expected/unexpected extensions, Wave 5 may find resistance in to the pink zone.
A question that the author often asks is "where will wave 3 end?" - Will it end at the 1.618% extension of wave 1 & 2, the 176.4 or higher and perhaps lower. Using the pink zones the author has found it useful and quite accurate to make such a judgement based on the current position of the bands - Pink for exhaustion in an uptrend and green for exhaustion in a down trending market.
Elliott Wave [BigBeluga]🔵 OVERVIEW
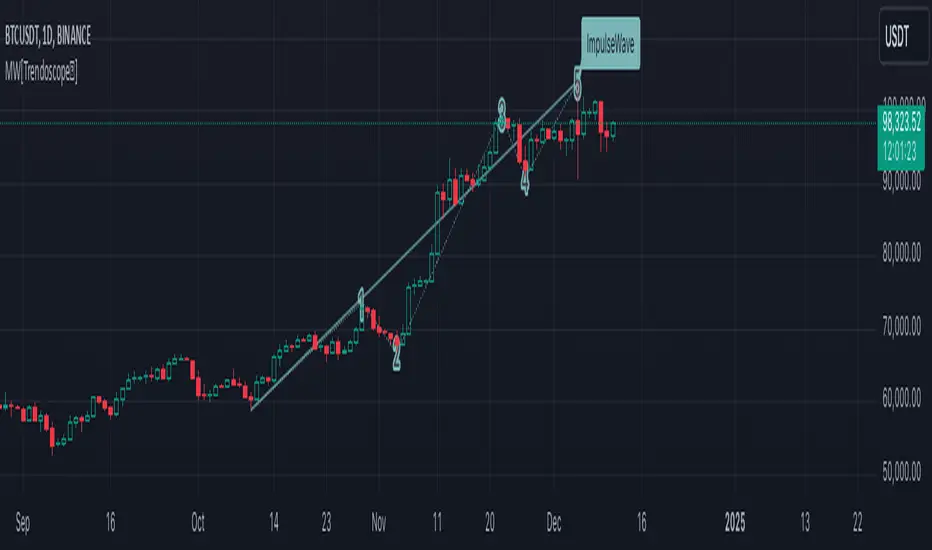
Elliott Wave automatically finds and draws an Elliott-style 5-wave impulse and a dashed projection for a potential -(a)→(b)→(c) correction. It detects six sequential reversal points from rolling highs/lows — 1, 2, 3, 4, 5, (a) — validates their relative placement, and then renders the wave with labels and horizontal reference lines. If price invalidates the structure by closing back through the Wave-5 level inside a 100-bar window, the pattern is cleared (optionally kept as “broken”) while key dotted levels remain for context.
🔵 CONCEPTS
Reversal harvesting from extremes : The script scans highest/lowest values over a user-set Length and stores swing points with their bar indices.
Six-point validation : A pattern requires six pivots (1…5 and (a)). Their vertical/temporal order must satisfy Elliott-style constraints before drawing.
Impulse + projection : After confirming 1→5, the tool plots a curved polyline through the pivots and a dashed forward path from (a) toward (b) (midpoint of 5 and (a)) and back to (c).
Risk line (invalidator) : The Wave-5 price is tracked; a close back through it within 100 bars marks the structure as broken.
Minimal persistence : When broken, the wave drawing is removed to avoid noise, while dotted horizontals for waves 5 and 4 remain as reference.
🔵 FEATURES
Automatic pivot collection from rolling highs/lows (user-controlled Length ).
Wave labeling : Points 1–5 are printed; the last collected swing is marked b
. Projected i
& i
are shown with a dashed polyline.
Breaker line & cleanup : If price closes above Wave-5 (opposite for bears) within 100 bars, the pattern is removed; only dotted levels of 5 and 4 stay.
Styling controls :
Length (pivot sensitivity)
Text Size for labels (tiny/small/normal/large)
Wave color input
Show Broken toggle to keep invalidated patterns visible
Lightweight memory : Keeps a compact buffer of recent pivots/draws to stay responsive.
🔵 HOW TO USE
Set sensitivity : Increase Length on noisy charts for cleaner pivots; decrease to catch earlier/shorter structures.
Wait for confirmation : Once 1→5 is printed and (a) appears, use the Wave-5 line as your invalidation. A close back through it within ~100 bars removes the active wave (unless Show Broken is on).
Plan with the dashed path : The (a)→(b)→(c) projection offers a scenario for potential corrective movement and risk placement.
Work MTF : Identify cleaner waves on higher TFs; refine execution on lower TFs near the breaker or during the move toward (b).
Seek confluence : Align with structure (S/R), volume/Delta, or your trend filter to avoid counter-context trades.
🔵 CONCLUSION
Elliott Wave systematizes discretionary wave analysis: it detects and labels the 5-wave impulse, projects a plausible (a)-(b)-(c) path, and self-cleans on invalidation. With clear labels, dotted reference levels, and a practical breaker rule, it gives traders an objective framework for scenario planning, invalidation, and timing.

Golden Pocket Syndicate [GPS]Golden Pocket Syndicate is a multi-layered market analysis toolkit built for precision entries and sniper-style reversals in both trending and ranging conditions. The script fuses volume dynamics, golden pocket structures, market maker behavior, and liquidation cluster tracking into one high-confluence system.
Core Features:
• 📐 Golden Pocket Zones: Dynamic GP levels from daily, weekly, monthly, and yearly timeframes. These levels update in real-time and serve as confluence zones for entries and exits.
• 📊 WaveTrend Divergence Diamonds: Momentum shifts are detected using a custom filtered WaveTrend cross system to mark high-probability reversal conditions.
• 🧠 Market Maker Premium Divergence: Tracks price dislocation between CME and Binance to detect large player manipulation using a configurable premium threshold.
• 💎 MM Reversal Diamonds: Identifies potential market maker traps and large player pivots using historical candle behavior, EMA alignment, and price structure breaks.
• 📉 Stealth Liquidation Cluster Arrows: Volume-based liquidation pressure visualized as lightweight directional arrows based on calculated wick expansion and volume bursts. Highlights key zones where price is likely to bounce or reject.
• 🧭 Trend Validation: Uses volume-based trend conditions and short-term EMA positioning to further qualify signals and eliminate noise.
How to Use:
This indicator is designed to help traders visualize confluence between key institutional price levels, momentum shifts, and volume-based pressure points. Long/short opportunities can be explored at marked reversal diamonds or liquidation zones that align with key GP levels. Intended for use on higher timeframes (15m to 4H), though flexible across any pair or market.

Elliott Wave with Customizable Visualization and Toggle1. Key User Inputs
a. Setting Wave 1 Start and High Points
- Wave 1 Start (Low Point): Enter the starting point (low point) of the first wave.
- Default: 10000.
- Wave 1 High (Previous High): Enter the high point (end point) of the first wave.
- Default: 11000.
b. Setting Targets and Retracement Ratios for Each Wave
- Wave 1 Target: Select the target ratio for Wave 1.
- Options: 1.0, 1.272, 1.414, 1.618, 2.0.
- Default: 1.618.
- Wave 2 Retrace: Select the retracement ratio for Wave 2.
- Options: 0.236, 0.382, 0.5, 0.618, 0.786.
- Default: 0.618.
- Wave 3 Target: Select the target ratio for Wave 3.
- Options: 1.0, 1.272, 1.414, 1.618, 2.0.
- Default: 1.618.
- Wave 4 Retrace: Select the retracement ratio for Wave 4.
- Options: 0.236, 0.382, 0.5, 0.618.
- Default: 0.382.
- Wave 5 Target: Select the target ratio for Wave 5.
- Options: 0.618, 1.0, 1.272, 1.414, 1.618.
- Default: 1.0.
c. Setting Colors and Styles for Each Wave
You can customize the color and line style of each wave:
- Wave 1 Color: Color of Wave 1 (Default: Green).
- Wave 2 Color: Color of Wave 2 (Default: Red).
- Wave 3 Color: Color of Wave 3 (Default: Blue).
- Wave 4 Color: Color of Wave 4 (Default: Purple).
- Wave 5 Color: Color of Wave 5 (Default: Orange).
- Wave 1 Line Style: Select the line style for Wave 1 (Options: Solid, Dotted, Dashed).
- Default: Solid.
- The same settings can be applied to the remaining waves.
d. Setting Wave Display Options
- You can toggle the visibility of specific waves:
- Example: Set Show Wave 1 to false to hide Wave 1 from the chart.
- Default: true (All waves are displayed).
2. Outputs and Visualization
Wave Target Lines
- The target price and retracement levels for each wave are displayed as horizontal lines on the chart.
- Selected ratios (Fibonacci ratios) are highlighted based on the user-defined style.
Labels
- Labels next to the target lines display the target price and Fibonacci ratio.
- Example: Wave 1 (1.618): 11236.54.
3. Key Calculations and Wave Explanations
a. Wave 1
- Length: Wave 1 High - Wave 1 Start.
- Target: The target price is calculated based on the selected ratio (Wave 1 Target).
- Display: The target line and label are displayed starting from Wave 1 Start.
b. Wave 2
- Retracement Length: Wave 1 Target - Wave 1 Start.
- Retracement Target: The retracement price is calculated based on the selected ratio (Wave 2 Retrace).
- Display: The retracement line and label are displayed starting from Wave 1 Target.
c. Wave 3
- Length: Same as the length of Wave 1.
- Target: The target price is calculated based on the selected ratio (Wave 3 Target).
- Display: The target line and label are displayed starting from Wave 1 Target.
d. Wave 4
- Retracement Length: Wave 3 Target - Wave 1 Target.
- Retracement Target: The retracement price is calculated based on the selected ratio (Wave 4 Retrace).
- Display: The retracement line and label are displayed starting from Wave 3 Target.
e. Wave 5
- Length: Same as the length of Wave 3.
- Target: The target price is calculated based on the selected ratio (Wave 5 Target).
- Display: The target line and label are displayed starting from Wave 3 Target.
4. Usage Examples
Trend Analysis
- Visualize the target price and retracement levels of each wave to understand upward or downward trends.
Determining Entry/Exit Points
- Plan entry and exit strategies by observing when target prices reach specific Fibonacci ratios.
Customization
- Enhance visual convenience by adjusting chart styles and colors to suit your preferences.
5. Notes and Precautions
Input Validation
- Ensure that the Wave 1 Start and Wave 1 High values match actual price ranges to achieve accurate results.
Market Conditions
- Elliott Wave Theory is a predictive tool and may differ from actual market movements.
Risk Management
- Use the results as a reference and always incorporate risk management strategies when making investment decisions.

Motive Wave Scanner [Trendoscope®]Motive Wave Scanner is a simple algorithm to find out motive waves as per the rules of Elliott Wave theory.
It is an extension to our previous open source script Interactive Motive Wave Checklist which provides interactive capability to select six points of a five wave formation. Once users select them, the rules of motive waves are applied to manually selected points to highlight them as either diagonal wave, motive wave or none.
This indicator does the same. But, instead of requesting the pivots manually from the user, the indicator automatically picks and scans them through zigzag.
We have already published a similar script as protected source. But, due to some changes in the pine engine, there have been few issues in the runtime. In this publication, we not only address those runtime issues but also making it open source for the users to make use of the source code and enhance it further.
🎲 What are motive waves
Motive waves are strong upward or downward movement with 5 subwaves.
Motive Wave in the upward direction will start with Swing High, Ends with Swing High and consists of 3 Higher Highs and 2 Higher Lows representing strong upward trend.
Motive Wave in the downward direction will start with Swing Low, Ends with Swing low and consists of 3 Lower Lows and 2 Lower Highs representing strong downward trend.
🎲 Types of Motive Waves
Motive Waves are broadly classified by two types:
Impulse Waves
Diagonal Waves
Diagonal Waves are further classified into Contracting and Expanding Diagonals. These can fall into the category of either leading diagonal and ending diagonal.
🎲 Rules of Motive Waves
🎯 Generic Rule of any motive waves are as follows
Should consist of 5 alternating waves. (Swing High followed by Swing low and vice versa)
This can start from Swing High and end in Swing High or start from Swing Low and end in Swing Low of a zigzag.
Wave-2 should not move beyond Wave-1. This means, the Wave-2 is always shorter than Wave-1 with respect to distance between the price of start and end.
Wave-3 always moves beyond Wave-1. This means, the Wave-3 is always longer than Wave-2 in terms of price
Among Wave-1, Wave-3, and Wave-5, Wave-3 is never the shortest one. This means, either Wave-1 or Wave-5 can be longer than Wave-3 but not both. Wave-3 can also be longest among the three.
Here is the pictorial representation of the rules of the Motive Waves
For a wave to be considered as motive wave, it also needs to follow the rules of either impulse or diagonal waves.
🎯 Rules for a 5 wave pattern to be considered as Impulse Wave are:
Wave-4 never overlaps with Wave-1 price range
Wave-1, Wave-3 and Wave-5 should not be either expanding or contracting. Meaning, we cannot have Wave-1 > Wave-3 > Wave-5 , and we cannot have Wave-1 < Wave-3 < Wave-5
Pictorial representation of the impulse wave rules are as below:
🎯 Rules for the Diagonal Waves are as follows
Contrary to the first rule of impulse wave, in case of diagonal wave, Wave-4 always overlaps with Wave-1 price range. But, it will not go beyond Wave-3
Waves are progressively expanding or contracting - Wave1 > Wave3 > Wave5 and Wave2 > Wave4 to be contracting diagonal. Wave1 < Wave3 < Wave5 and Wave2 < Wave4 to be expanding diagonal wave.
Pictorial representation of the Contracting Diagonal Wave is as below. Here, the Wave-1, Wave-3 and Wave-5 are in contracting formation.
Pictorial representation of the Expanding Diagonal Wave is as below. Here, the Wave-1, Wave-3 and Wave-5 are in expanding formation.
🎲 Indicator Settings
Indicator settings are defined as below:
Repaint Warning : If Repaint is selected, the indicator will throw a runtime error after certain bars or when alerts are set. This is due to some pine internal issue. At present, we do not have any solution for this until the internal issue is resolved by Tradingview Pine Team.
Bull Bear Trend IndicatorIntroduction: Origin of the Swing Point Indicator
In the quest for a reliable indicator that accurately predicts trend directions and identifies valid highs and lows, the genesis of the Swing Point Indicator emerged. Faced with the challenge of finding a tool that provided comprehensive market analysis and actionable insights, the need for a novel solution became evident. Combining insights gleaned from market analysis and innovative algorithmic approaches, the Swing Point Indicator was born.
Enhanced Feature: Highs and Lows Labeling in Trend Direction
In addition to its core functionalities, the Swing Point Indicator incorporates an advanced feature that enhances the visualization of trend direction. This feature provides further clarity by selectively labeling highs and lows based on the prevailing trend, reinforcing the identification of higher highs and lower lows in uptrends and downtrends, respectively. Overlapping labels on highs and lows signify a potential trend change, providing traders with valuable insight into market reversals.
Detailed Description:
1. Uptrend Labeling:
- Higher Highs (Green Label with Price): In an uptrend, where higher highs are observed, the indicator labels these points with vibrant green color and includes the corresponding price value. This visually highlights the significance of higher highs as pivotal points in the upward trajectory of prices.
- Higher Lows (Red Marker without Text or Diamond): To complement the identification of higher highs, higher lows are marked with a distinct red marker or diamond, devoid of any accompanying text. While these points are crucial in delineating the ascending trend, their emphasis lies in their role as support levels, providing a foundation for upward price movements.
2. Downtrend Labeling:
- Lower Lows (Red Label with Price): Conversely, in a downtrend characterized by lower lows, the indicator labels these points with conspicuous red color, accompanied by the corresponding price value. Lower lows signify critical levels of downward price momentum, acting as indicators of potential bearish continuation.
- Lower Highs (Green Marker without Text or Diamond): Lower highs, indicative of downward retracements in a downtrend, are marked by distinctive green markers or diamonds without accompanying text. While these points denote temporary pauses or pullbacks in the bearish trend, their emphasis lies in their role as resistance levels, impeding upward price movements.
Functionality and Utility:
- Customizable Lookback Candle Count: Traders have the option to adjust the lookback candle count, which is set by default at 108 candles in the settings. This flexibility allows traders to tailor the indicator to their specific trading preferences and timeframes.
- Equal Highs or Lows Option: When enabled, the Swing Point Indicator can identify equal highs or equal lows, providing traders with additional insight into market dynamics.
- Formation Confirmation: A new higher high along with its higher low or a new lower low along with its lower high is confirmed after two candles have closed following the swing point candle. This ensures the reliability of the identified trend direction.
Conclusion:
The incorporation of selective labeling for highs and lows based on trend direction, alongside the introduction of customizable settings and formation confirmation criteria, enhances the effectiveness of the Swing Point Indicator. This feature-rich tool empowers traders with a nuanced understanding of market dynamics, highlighting critical price levels and trend reversals. By offering enhanced visualization, customizable options, and confirmation criteria, the Swing Point Indicator equips traders with the confidence and precision needed to navigate the markets successfully, contributing to more informed and profitable trading strategies.

Elliott's Quadratic Momentum - Strategy [presentTrading]█ Introduction and How It Is Different
The "Elliott's Quadratic Momentum - Strategy" is a unique and innovative approach in the realm of technical trading. This strategy is a fusion of multiple SuperTrend indicators combined with an Elliott Wave-like pattern analysis, offering a comprehensive and dynamic trading tool. It stands apart from conventional strategies by incorporating multiple layers of trend analysis, thereby providing a more robust and nuanced view of market movements.
*Although the script doesn't explicitly analyze Elliott Wave patterns, it employs a wave-like approach by considering multiple SuperTrend indicators. Elliott Wave theory is based on the premise that markets move in predictable wave patterns. While this script doesn't identify specific Elliott Wave structures like impulsive and corrective waves, the sequential checking of trend conditions across multiple SuperTrend indicators mimics a wave-like progression.
BTC 8hr Long/Short Performance
Local Detail
█ Strategy, How It Works: Detailed Explanation
The core of this strategy lies in its multi-tiered approach:
1. Multiple SuperTrend Indicators:
The strategy employs four different SuperTrend indicators, each with unique ATR lengths and multipliers. These indicators offer various perspectives on market trends, ranging from short to long-term views.
By analyzing the convergence of these indicators, the strategy can pinpoint robust entry signals for both long and short positions.
2. Elliott Wave-like Pattern Recognition:
While not directly applying Elliott Wave theory, the strategy takes inspiration from its pattern recognition approach. It looks for alignments in market movements that resemble the characteristic waves of Elliott's theory.
This pattern recognition aids in confirming the signals provided by the SuperTrend indicators, adding an extra layer of validation to the trading signals.
3. Comprehensive Market Analysis:
By combining multiple indicators and pattern analysis, the strategy offers a holistic view of the market. This allows for capturing potential trend reversals and significant market moves early.
█ Trade Direction
The strategy is designed with flexibility in mind, allowing traders to select their preferred trading direction – Long, Short, or Both. This adaptability is key for traders looking to tailor their approach to different market conditions or personal trading styles. The strategy automatically adjusts its logic based on the chosen direction, ensuring that traders are always aligned with their strategic objectives.
█ Usage
To utilize the "Elliott's Quadratic Momentum - Strategy" effectively:
Traders should first determine their trading direction and adjust the SuperTrend settings according to their market analysis and risk appetite.
The strategy is versatile and can be applied across various time frames and asset classes, making it suitable for a wide range of trading scenarios.
It's particularly effective in trending markets, where the alignment of multiple SuperTrend indicators can provide strong trade signals.
█ Default Settings
Trading Direction: Configurable (Long, Short, Both)
SuperTrend Settings:
SuperTrend 1: ATR Length 7, Multiplier 4.0
SuperTrend 2: ATR Length 14, Multiplier 3.618
SuperTrend 3: ATR Length 21, Multiplier 3.5
SuperTrend 4: ATR Length 28, Multiplier 3.382
Additional Settings: Gradient effect for trend visualization, customizable color schemes for upward and downward trends.

Elliot waves calibratorThis script is a part of the "Elliot waves" toolkit and need to be used with the "Elliot waves" script", because it's generating input parameters for the "Elliot waves" scripts.
You need to add script to chart and on the right bottom corner you can see table with calibration params. Those values you need to copy to "Elliot waves" script settings to see Elliot waves visualization on that chart.
Script settings:
Vertex filter - Value used in the "Elliot waves" script to filter highs and lows that are not an extreme over area width equal to vertex filter value. In edge cases it can change calbiration params. Both scripts should have set the same values of this param.
Troubleshooting:
In case of any problems, please send error details to the author of the script.
Steel Step Assistant: Trend VisualizerSpecial thanks to Turicumo and Psychil for helping me write the code, both from my group.
Disclaimer: Nobody should use this indicator as a confirmation signal for entry/exit for your trades. Please message me on how to use this indicator correctly. This indicator was designed to be used in conjunction with my Steel Step strategy, hence the name.
This indicator simply gives a quick outlook of the market.
This indicator is an ordinary table that shows you the trends.
The default settings produce directions that are very similar to what I use for my strategy. You can change the settings as desired.
This indicator can be used on all charts and markets; crypto, commodities, forex, stock, indices, etc.
It is suitable for intra-day traders, as well as HTF traders.
One way of using this is to enhance your information gathering on trends in order to understand the market structure or direction better.
This indicator educates users on the market structure. Users can quickly break down the market into layers, analyze the layers and connect them all to understand the market as a whole. After users understand the market, users need to decide and choose a specific trend they want to trade. The basic idea is to flow with the market.
This indicator can be combined with EW theory to understand the market structure easily.
When I understand the whole market structure, it boosts my trading performance to the maximum.
Please comment below or message me if you have any questions. Enjoy!

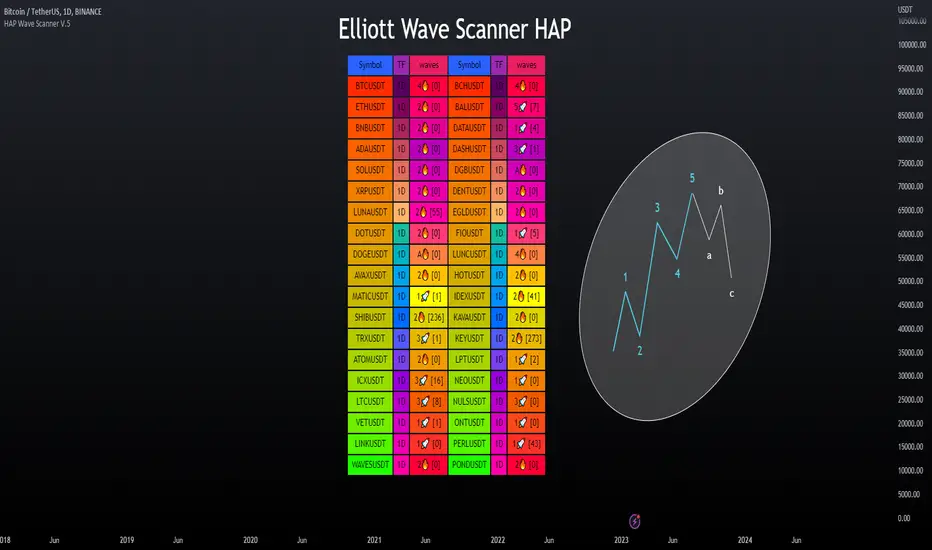
Elliott Wave Scanner - HAP [PRO] ▶Elliott Wave Scanner
This is an added feature of the wave drawing version, but this version is used for scanning multiple currency pairs simultaneously, based on the custom list you have specified as your preferred ones, making it more convenient for you.
This :
════════════════════════
This will be an adjustment of the number bars to be similar to the version in the drawing wave, with the only difference being that this version will be a scan of multiple waveforms simultaneously, including the input data format. It is recommended to only change the numbers, maintaining the original structure to avoid any errors, as demonstrated in the example below.
This is a valid example.👇
Wave0= (21),
Wave1= (13),
Wave2= (8),
Wave3= (21),
Wave4= (13),
Wave5= (34),
WaveA= (13),
WaveB= (8),
WaveC= (21)
**Kindly note to specify the numerical sequence of each wave. Parentheses should always be preceded by a comma and conclude on the final line without one.
════════════════════════
▶Let's take a look at the different parts of the scanned version.
════════════════════════
🎯 Bringing in the RSI to help make decisions, as referenced in the book by "Jason Perl".
if the market is advancing as part of a bullish HAP WAVE up sequence, then the RSI should remain above `40` during corrective setbacks for HAP WAVEs 2 and 4. Similarly, if the market is declining as part of a bearish HAP WAVE down sequence, then the RSI should remain beneath 60 during corrective for HAP WAVEs 2 and 4
For example, an uptrend in Wave tends to cause an RSI divergence between Wave 5 and Wave 3. When Wave 5 exceeds Wave 3, the RSI is often seen at Wave 5, which is lower than Wave 3.
สคริปต์แบบชำระเงิน
SeongMo_MA_V3(Elliot_helper)Made to make it easier to count Elliott waves.
If you renew your new high price, you'll continue your new high price
When the new low is renewed, the new low is continued.
If you are within the range of the previous candle, use the ratio of the difference between the median value of the previous candle and the closing price of the current candle to determine whether to continue the high or low price.
If a can with a tail that updates a new high price and a new low price at the same time comes out, the phrase "Check_candle!" appears to mean that you should check it with a lower time zone candle.

CDC Fibonacci Retracement and ExtensionThis indicator is meant to be used as a tool to quickly identify
fibonacci retracements and projections in multiple charts during
the same date range.
Users can set the calculation date range and quickly flip through
different charts for comparisons
Steps for using this indicator is as follows:
1. Specify Start Date and End Date for calculations
2. Choose Open-ended mode for just retracements, this will disregard
end date in calculations.
3. Select price source, if Use Highs/Lows is selected, the indicator will
use high and low prices for calculation, if not, closing price eill
be used instead
4. Select and/or modify retracement / projection lines as you see fit.
5. Enjoy the result!

NEoWave Cash Data Pro by ArshiaRahimiNEoWave Cash Data Pro by ArshiaRahimi (Cash Data Display Indicator)
By using this indicator, you can see cash data in the Trading View Charts. Cash Data is NEoWave approach data and is used for wave counting of this type. Analysts of Elliot Wave approach can also benefit from this data.
In Cash Data, the state of high and low of the candles or in other words their chronology will be determined and the path of price movement will be indicated clearly.
You will have no limit to view cash data using this indicator and you will be able to view the cash data of any part of the chart you would like with a 100 percent precision. By default, Indicator shows MonoWave 500 in the ending part of the chart but in order to view the cash data of other parts, you only need to activate the option “ Custom Start” and by adjusting the date of drawing the cash data, you can make the cash data of the part you want to be displayed.
The cash data of each chart is displayed in 20 different timeframes including:
• Annual timeframe
• Monthly, 3month, 6 month timeframe
• weekly, 2 week timeframe
• daily, 2 day, 3 day timeframe
• 6 hour, 12 hour timeframe
• 4 hour, 8 hour timeframe
• 1 hour, 2 hour, 3 hour timeframe
• 5 minute, 10 minute, 15 minute, 30 minute timeframe
Other features are also incorporated in this indicator including:
• determination of cash data thickness
• determination of ascending MonoWaves color
• determination of descending MonoWaves color
• determination of connecting MonoWaves color
• displaying the MonoWaves which might be in question (when high and low occur in a candle)
• determination of the questionable MonoWaves color
• determination of the date and starting time of cash data drawing
• Drawing of the last cash data live and the possibility of determining its drawing delay.
• Displaying time slot separator lines
• Determination of separator lines color and transparency
• Displaying Fade Chart behind cash data
• determination of fade chart candles color and transparency
• displaying information table of cash data in the corner of the chart which include displaying time frame of the cash data and the number of MonoWaves that exist in the chart.
This indicator is designed by Arshia Rahimi of Iran NEoWave Institute. You can be in touch through “ArshiaRahimi” ID.
The Indicator will continuously receive its new updates. after publishing, each update will replace the previous version by trading view.

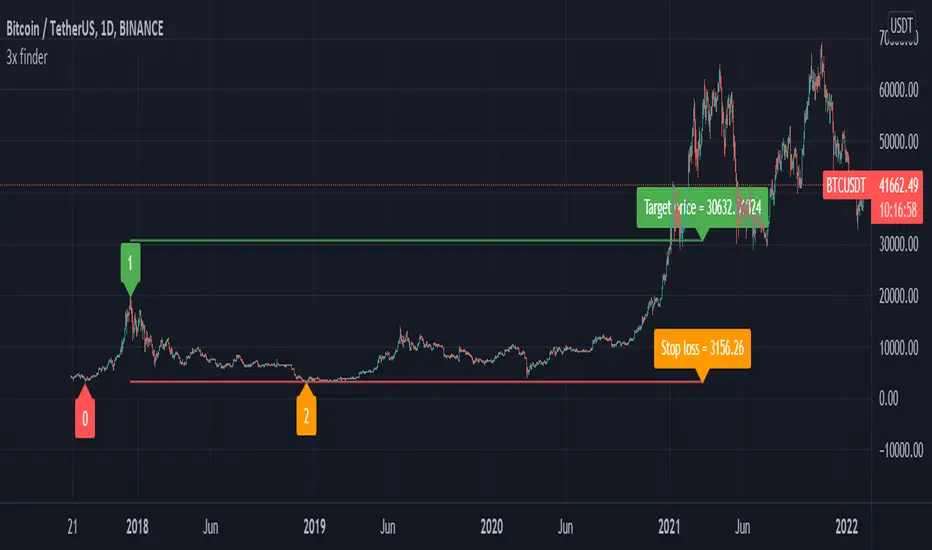
Elliot wave : Wave 3 finder This indicator built for find wave 3 of elliot wave and It also calculate risk reward ratio, minimum target for wave 3 extention and stop loss.
------------ How to use -------------
1. Add this indicator on your chart.
2. If you asset are follow Condition*, buy label with risk reward ratio, Target price and Stop loss will pop up.
*Condition
-50% rebound from the end of wave 2.
-Indicator can detect wave 0, 1 and 2.
If you find any problem please leave comment.
3rd WaveHello All,
In Elliott Wave Theory, 3rd wave is not the shortest one in the waves 1/3/5 and it's usually longest one. so if we can catch it then we may get good opportunities to trade. This script finds 3rd wave experimentally. it can be also the 3rd waves in the waves 1, 3, 5, A and C. the 3rd wave should have greater volume than other waves, the script can check its volume and compare with the volumes of the waves 1 and 2 optionally.
Pine Team released Pine version 5! This script was developed in v5 and it uses Library feature of Pine v5 for the zigzag functions. This script is also an example for the Pine developers who learn Pine v5 and Libraries.
Options:
Zigzag Period: is the length that is used to calculate highest/lowest and the zigzag waves
Min/Max Retracements: is the retracement rates to check the wave 2 according to wave 1. for example; if min/max values are 0.500-0.618 then wave 2 must be minimum 0.500 of wave 1 and maximum 0.618 of wave 1.
Check Volume Support: is an option to compare the volumes of1. 2. and . waves. if you enable this option then the script checks their volume and 3rd wave volume must be greater then 1 and 2
there are 4 options for the targets. you can enable/disable and change their levels. targets are calculated using length of wave 1.
Options to show breakout zone, zigzag, wave 1 and 2.
and some options for the colors.
The Library that is used in this script:
P.S. This is an experimental work and can be improved. So do not hesitate to drop your comments under the script ;)
Enjoy!

Elliot Wave - ImpulseLets dabble a bit into Elliot Waves.
This is a simple script which tries to identify Wave 1 and 2 of Elliot Impulese Wave and then projects for Wave 3.
Ratios are taken from below link: elliottwave-forecast.com - Section 3.1 Impulse
Wave 2 is 50%, 61.8%, 76.4%, or 85.4% of wave 1 - used for identifying the pattern.
Wave 3 is 161.8%, 200%, 261.8%, or 323.6% of wave 1-2 - used for setting the targets
Important input parameters
Length : Zigzag Length. Keep the numbers low if you are looking for smaller and shorter trades. Keep the numbers high if you are looking for longer and bigger trades.
Error Percent : Adjustments for ratios as it is not always possible to find exactly equal retracement ratio.
Entry Percent : Once Wave 2 is formed, entry is set after reversing 30% of wave 2. This number can be increased or decreased. Caution: Keeping the number too low may result in false signals.
Ignore Trend Direction : If unchecked, it will only look for pattern if Wave 1 has made a higher high. If not, it will ignore Wave 1 condition and only look at wave 1 to 2 ratio.
Handle Duplicates : Since, the labels are generated upon crossover of entry price, this crossover may happen multiple times. Or sometimes wave 2 can further extend and generate new signal with same wave 1. This parameter says how to handle such cases. Keep Last is set to default and is most preferred option.
ShowRatios and ShowWaves lets you display wave line and retracement ratios for each pivots
EWO Breaking Bands & XTLElliott Wave Principle, developed by Ralph Nelson Elliott , proposes that the seemingly chaotic behaviour of the different financial markets isn’t actually chaotic. In fact the markets moves in predictable, repetitive cycles or waves and can be measured and forecast using Fibonacci numbers. These waves are a result of influence on investors from outside sources primarily the current psychology of the masses at that given time. Elliott wave predicts that the prices of the a traded currency pair will evolve in waves: five impulsive waves and three corrective waves. Impulsive waves give the main direction of the market expansion and the corrective waves are in the opposite direction (corrective wave occurrences and combination corrective wave occurrences are much higher comparing to impulsive waves)
The Elliott Wave Oscillator ( EWO ) helps identifying where you are in the 5 / 3 Elliott Waves , mainly the highest/lowest values of the oscillator might indicate a potential bullish / bearish Wave 3. Mathematically expressed, EWO is the difference between a 5 period and 35 period moving average. In this study instead 35-period, Fibonacci number 34 is implemented for the slow moving average and formula becomes ewo = sma (HL2, 5) - sma (HL2, 34)
The Elliott Wave Oscillator enables traders to track Elliott Wave counts and divergences. It allows traders to observe when an existing wave ends and when a new one begins. Included with the EWO are the breakout bands that help identify strong impulses.
The Expert Trend Locator ( XTL ) was developed by Tom Joseph (in his book Applying Technical Analysis) to identify major trends, similar to Elliott Wave 3 type swings.
Blue bars are bullish and indicate a potential upwards impulse.
Red bars are bearish and indicate a potential downwards impulse.
White bars indicate no trend is detected at the moment.
Added "TSI Arrows". The arrows is intended to help the viewer identify potential turning points. The presence of arrows indicates that the TSI indicator is either "curling" up under the signal line, or "curling" down over the signal line. This can help to anticipate reversals, or moves in favor of trend direction.

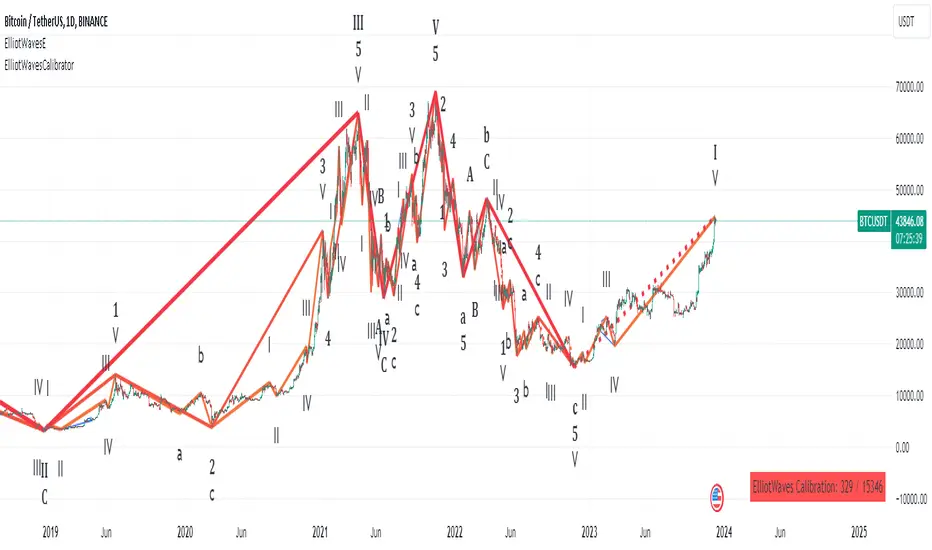
Elliott Wave AnalysisInitially, Elliott wave analysis is designed to simplify and increase the objectivity of graph analysis using the Elliott method. Probably, this indicator can be successfully used in trading without knowing the Elliott method.
The indicator is based on a supertrend. Supertrends are built in accordance with the Fibonacci grid. The degree of waves in the indicator settings corresponds to a 1-hour timeframe - this is the main mode of working with the indicator. I also recommend using weekly (for evaluating large movements) and 1-minute timeframes.
When using other timeframes, the baseline of the indicator will correspond to:
1 min-Submicro
5 minutes-Micro
15 minutes-Subminuette
1 hour-Minuette
4 hours-Minute
Day-Minor
Week-Intermediate
Month-Primary
Those who are well versed in the Elliott method can see that the waves fall on the indicator almost perfectly. To demonstrate this, I put the markup on the graph

MTF Wave Stochastic RSI [Cryptoheat]MTF Wave Stochastic RSI is a multiple time frame Stochastic RSI, based on 3 different timeframes, layered on top of each other. This is a very useful tool when used to confirm and identify Elliott Waves and sub-waves at once.
Each of the three curves is based on a different time frame. While the blue (K2) curve is the current time frame, the gray (K1) is of a faster time frame which is roughly around a third of the time and the green (K3) is of a slower time frame, roughly around 3 times the current time frame. The gray and green curves are based on specific settings that were back-tested and proved more efficient.
Reasoning behind this indicator is that although the normal Stochastic RSI can show divergences more sensitively and faster than the normal RSI indicator, it cannot do so while showing a larger duration backwards in an accurate way for comparisons. It can also not show wave structures and substructures, but rather a top or bottom reversal regardless of the wave structure hierarchy and wave strength. However when several time frames are combined in one indicator, they can reveal much more information about the chart as they can show larger durations next to smaller ones. Therefore they can be used as a confirmation and helper tool to identify Waves and Sub-waves.
This can be done, by looking first at the green curve (slowest RSI) and identifying full moves. A full move is a move from being oversold to overbought and back to being oversold again. A move can be the opposite as well. By identifying the beginning and end of a move of the larger time frame stochastic RSI this can help you see the two waves in each move. One wave up and one wave down. The peak of that wave can be seen either at the highest point of the in-between peak of the green curve or by one of the smaller time frame stochastic RSI tops when the green one is diverging. A look at the price action and application of Elliott Wave knowledge is mandatory, as this indicator is mainly a confirmation tool.
By back-testing it you can see that the larger time frame Stochastic RSI can show you full impulse and corrective waves most of the times, while the lower time frame stochastic RSI should be viewed as potential sub-waves of that main wave structure. Also noticeable are the divergences that can be seen often on the larger time frame Stochastic RSI..
Please note that this tool is not recommended to be used alone as like many indicators, this is a confirmation tool that can help in identifying rather than predicting…
Also for best results Elliot Wave knowledge is recommended…
I prefer to use this indicator along with a normal Stochastic RSI on top of it so I can always see which of the three curves is of the current time frame, making it easier to understand the chart. I also prefer using the normal RSI and MACD with it…

Parametric Oscillator (Zeiierman)█ Overview
The Parametric Oscillator (Zeiierman) transforms price movement into a structure-aware momentum field, a flowing wave of oscillator-candles wrapped around a smooth Quick Price Action line. Instead of reading raw closes, it constructs a multi-lane view from open, high, low, and close data to capture how price pressure expands, contracts, and shifts through time. These relationships are then projected into a bounded oscillator domain, creating a dynamic visualization of momentum and market balance.
The oscillator-candles flip green or red to signal shifts in buying or selling strength, while the Quick Line tracks underlying momentum on a 0–100 scale. Together, they reveal where pressure is forming, how quickly it’s changing, and whether that change is sustainable, helping traders spot momentum swings, stretched zones, and directional bias across any timeframe.
⚪ What Makes It Unique
The oscillator’s uniqueness lies in how it constructs and interprets price structure. It builds four independent lanes of open, high, low, and close to measure wave relationships and capture micro-drift, wick aggression, and full price behavior rather than relying solely on closing data.
Beneath the surface, the oscillator runs on a balanced motion function that translates market volatility into a clear rhythm of momentum and structure. Each change in color and gradient reflects the balance between acceleration and stability, revealing the underlying pulse of market behavior.
█ Main features
⚪ Parametric Oscillator
The Parametric Oscillator turns market movement into a visual map of buying and selling pressure. Its oscillator-candles reveal how momentum builds, compresses, and releases, showing the balance between strength and exhaustion in real time. As candles shift color and gradient, traders can instantly read acceleration, fading energy, or volatility spikes, allowing for quick interpretation of trend health and potential reversals.
The display captures both immediate bursts of momentum and the underlying trend’s persistence, giving a continuous view of how pressure evolves across market phases. It can be used to spot areas of buildup before breakouts, early signs of compression before expansion, and the transition points where control shifts from buyers to sellers.
⚪ Quick Price Action
The Quick Price Action line provides a smooth, real-time read of market momentum that often shifts before price itself reacts. Acting as a leading momentum gauge, it highlights subtle changes in strength and direction, helping traders anticipate moves rather than chase them.
When the line begins to turn, it frequently does so well ahead of price, signaling acceleration, exhaustion, or an early phase of reversal. A rise toward higher levels reflects building bullish pressure, while a downturn from elevated zones shows fading strength or emerging sell bias.
It adapts smoothly across symbols and timeframes, the Quick Price Action line gives traders a consistent, early warning system and a clear visual cue of when momentum is starting to shift and where the next meaningful move may form.
█ How to Use
⚪ Trend Following
The Momentum Candle Line helps define the underlying directional bias by measuring the strength and persistence of momentum. When momentum holds above or below the midline (50), it reflects whether buyers or sellers maintain control of the trend. Watching how the candles form relative to that level helps identify continuation or potential shifts in direction.
Maintain a bullish bias when the Momentum Candles stay above 50 and candles form higher lows.
Maintain a bearish bias when they stay below 50 and candles form lower highs.
⚪ Detect Leading Momentum
The Quick Price Line helps identify leading momentum moves that often precede price action. These can signal the start of a new move in that direction or the early stages of a reversal.
When the Quick Line peaks above 80, it indicates strong positive momentum.
When it peaks below 30, it signals strong negative momentum.
By observing how the momentum candles behave around these levels, traders can determine whether the move is likely a continuation or a reversal.
⚪ Fading Price Moves
Momentum drives price to new highs and lows, but when that momentum fades, reversals often follow. The Quick Price Line or the Parametric Oscillator candles can reveal weakening momentum before price reacts, giving traders an early signal. When the Quick Line peaks and then begins to fade, it indicates that momentum is losing strength. This can precede a pause, a range, or a full reversal in price. Likewise, if the Parametric Oscillator starts to fade while price continues to move, it suggests that momentum is weakening and a reversal or pullback may be approaching.
█ How It Works
⚪ Dual-Lane Displacement
Price is decomposed into trend and fast components across the open, high, low, and close. These relationships form four signed streams that describe body drive and wick aggression.
Calculation: Builds relative spreads between the trend and fast components, creating a multi-dimensional price-flow state.
⚪ Parametric Mapping
Each data stream is passed through a parametric transform (defaulting to a momentum-sensitive map) and assembled into synthetic OHLC in oscillator space.
Calculation: Applies a state transform over the data, aggregates into oscillator OHLC, and exponentially smooths for stability.
⚪ Quick Price Action
A companion line extracts recent trend displacement, normalizes it in a rolling window around the local mid, and passes it through a smoothing process controlled by Price Trend (softness). This yields a stable 0–100 scale that reacts quickly yet remains consistent across assets and timeframes.
Calculation: Windowed normalization around a dynamic midpoint with adjustable softness to balance responsiveness and stability.
-----------------
Disclaimer
The content provided in my scripts, indicators, ideas, algorithms, and systems is for educational and informational purposes only. It does not constitute financial advice, investment recommendations, or a solicitation to buy or sell any financial instruments. I will not accept liability for any loss or damage, including without limitation any loss of profit, which may arise directly or indirectly from the use of or reliance on such information.
All investments involve risk, and the past performance of a security, industry, sector, market, financial product, trading strategy, backtest, or individual's trading does not guarantee future results or returns. Investors are fully responsible for any investment decisions they make. Such decisions should be based solely on an evaluation of their financial circumstances, investment objectives, risk tolerance, and liquidity needs.

Any Problems with ELLIOTT WAVES? Here my secret to count the EW!Hi at all!
Have someone any problems to count the Elliott Waves correctly? Then use my modified indicator.
The indicator shows a fast and a slow RSI oscillator.
I use this indicator to find the 3. wave on any big wave -> so I can find always trend wave und can indicate with that than the correction wave.
I set an example on the chart, so you can look at the peaks the RSI oscillator shows. The highest peak show the 3. wave of Elliott Waves. If you know the 3. wave you can immediately see the wave 1, 2 and of course 4 and 5.
For better instruction this indicator get green and red, if the fast RSI is higher or lower than the slow RSI. This color changing helps also to see every spectrum of a wave.

Elliott Wave Oscillator With BandsElliott Wave Oscillator With Breakout Bands. To determine and validate elliott wave counts.
