Killzones (EST)Asian Range
19:00 – 00:00 EST
Consolidation, liquidity build
London Open
02:00 – 05:00 EST
Initial expansion, Judas Swing
New York Open
07:00 – 10:00 EST
Main move, SMT, MSS setups
NY Lunch/Reversal
11:30 – 13:00 EST
Rebalancing, exit window
Educational

Dynamic Trend Channel - Adaptive Support & Resistance SystemA powerful trend-following indicator that adapts to market conditions in real-time. The Dynamic Trend Channel uses ATR-based volatility measurements to create intelligent support and resistance zones that adjust automatically to price action.
Key Features:
✓ Adaptive channel width based on market volatility (ATR)
✓ Color-coded trend identification (Green = Bullish, Red = Bearish)
✓ Smooth, flowing bands that reduce noise
✓ Breakout signals for high-probability entries
✓ Real-time info table showing trend status and price positioning
✓ Customizable settings for all timeframes

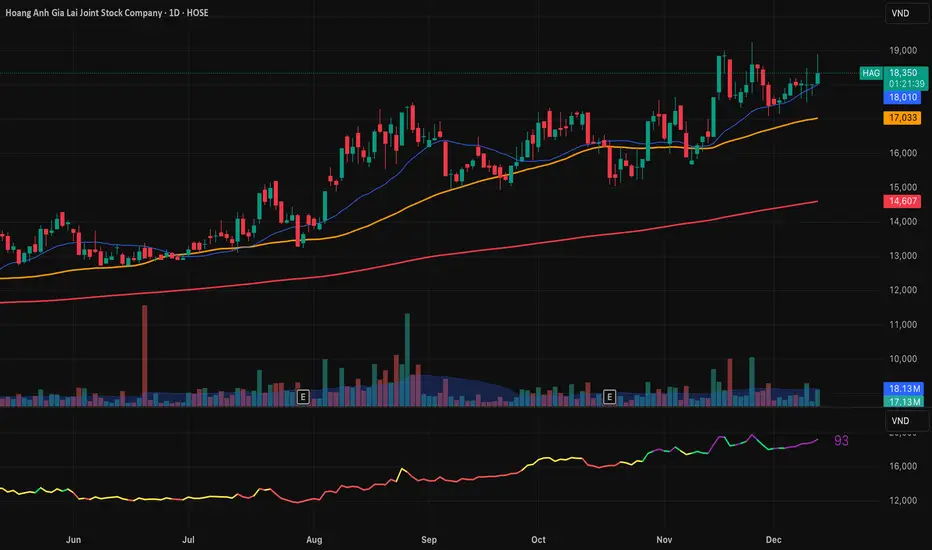
RS Rating Vietnam - IBD Style (AlphaStock Edition)Description: This implies the Relative Strength (RS) Rating specifically optimization for the Vietnam Stock Market, inspired by Investor's Business Daily (IBD) methodology.
How it works: Unlike the standard RSI (which measures internal momentum), this RS Rating compares a stock's performance against a benchmark index (Reference Index: VNMIDCAP or VNINDEX) over the last 12 months.
Calculation Formula: The rating is based on weighted performance (ROC):
40% weight: Latest 3 months (1 Quarter)
20% weight: 6 months
20% weight: 9 months
20% weight: 12 months
Features:
Auto-Scaling RS Line: The line automatically adjusts to fit the price chart, removing the need for manual fixed scales.
Benchmark Comparison: Compares stock Alpha vs. VNMIDCAP (default) to detect leaders even when the general market is skewed by large-cap stocks.
Color Coded:
Purple: Rating > 90 (Strong Buy/Leader)
Green: Rating > 80
Yellow: Rating > 60
Red: Rating < 60
Smart Display: Shows historical Rating values in the Data Window when hovering over past candles.
Credits: Designed by Admin AlphaStock.
SMC-Math by Thomas v1📌 SMC-Math by Thomas v1 — Description
SMC-Math by Thomas v1 is a complete Smart Money Concepts toolkit designed for traders who want a clean, mathematical, and structured view of market mechanics.
Rather than relying on abstract concepts or subjective drawings, this indicator focuses on rules-based detection of:
✔ Order Blocks (OB)
✔ Fair Value Gaps (FVG)
✔ Market Structure shifts (BoS / CHoCH)
✔ HTF trend confirmation
✔ Premium / Discount arrays
✔ Equal High & Equal Low Liquidity Zones (no hinting — expiry only)
This version is engineered for stability, clarity, and performance — with fully optimized array management, timestamp-based cleanup, and a clean visual presentation suitable for both discretionary and systematic trading.
📌 Key Features
🔹 1. Order Blocks (Bullish & Bearish)
Auto-detected using fractal swing highs/lows
Optional displacement + high volume filters
Midline display option
HTF trend alignment filter
Smart expiry + broken OB cleanup
Custom opacity, buffer, and extension controls
🔹 2. Fair Value Gaps (FVG)
Bullish and bearish gap detection
HTF confirmation-based dimming
No border for a clean ICT-style visuals
Auto remove when filled
Fully rule-based
🔹 3. Market Structure (BoS / CHoCH)
Based on fractal highs/lows
Automatic labeling (small, unobtrusive)
Direction validated by HTF option
Each structure level plotted with a projected line
Smooth, clean BOS/CHOCH flow
🔹 4. Premium / Discount Zones
Auto-calculated from most recent swing high & swing low
Box shading dynamically updates each bar
Helps identify optimal trade areas (OB → FVG → PD array)
🔹 5. Liquidity Zones (Equal Highs & Equal Lows)
This tool highlights where liquidity is likely resting:
Detects Equal Highs and Equal Lows using your tolerance or max difference
Auto-creates borderless shaded boxes
Adjustable box height and extension
NO hinting logic — the box remains for exactly cleanupDelay bars, then expires
Clean and predictable behavior, ideal for rule-based setups
This is especially useful for:
identifying buy-side and sell-side liquidity pools
anticipating runs on liquidity
targeting sweeps
🔹 6. HTF Status Panel
Shows higher-timeframe trend status on the live bar:
Bullish
Bearish
Or “HTF Not Required”
Useful for aligning entries with larger market flow.
📌 How to Use SMC-Math by Thomas v1
1️⃣ Identifying Direction
Start by reading:
HTF Trend Label
BOS & CHOCH reactions
Bullish: look for HL → HH structure + bullish OBs + bullish FVGs
Bearish: look for LH → LL structure + bearish OBs + bearish FVGs
This creates your directional bias.
2️⃣ Using Order Blocks
An OB is valid when:
It appears in line with structure
HTF alignment supports it (optional toggle)
Price returns after a displacement
OB is not “broken” (indicator handles this visually)
Use OBs as:
Rebalance targets
Entry areas
Stop placement logic
3️⃣ Fair Value Gaps
FVGs appear when price dislocates and leaves inefficiency.
Use them to:
Refine entries inside OBs
Project premium/discount zones
Identify continuation zones
The indicator auto-removes FVGs when filled.
4️⃣ Liquidity Zones
Liquidity zones identify resting orders at equal highs/lows.
This version uses simple expiry logic:
Box is created when EQH/EQL forms
It remains visible for 20 bars (default)
It disappears automatically after expiry
No hint/confirmation triggers deletion
Usage tips:
Expect price to run toward these zones
Use them as targets or continuation markers
Combine with OB/FVG for confluence
5️⃣ Premium / Discount Zones
Use PD arrays to gauge:
Premium = optimal shorting zones
Discount = optimal long zones
Not trade “in the middle” unless a clear BOS or CHoCH happens
📌 Recommended Workflow
HTF Bias → Check the HTF panel
Market Structure → Identify trend continuation or reversal
Liquidity → Mark where price is likely to target
FVG → Identify imbalance zones
OB → Confirm institutional origin points
PD Arrays → Determine optimal trade location
Execute with confluence
📌 Who Is This Indicator For?
✔ Traders using ICT / SMC logic
✔ Traders wanting rule-based, non-subjective markups
✔ Traders who want automated detection without repainting
✔ Anyone who uses OB, FVG, liquidity sweeps, and structure shifts

RS Rating Viet Nam by Admin AlphaStockSo sanh vs VNMIDCAP
Bạn có thể thay đổi BenchMark trong Code thành VNINDEX hay bất kỳ chỉ số nào

FAD Dashboard B (Next 7 Stocks)nspired by Wealthcon
This dashboard ( B ) shows Real Time sentiment change of Future Asset Difference with Future price of next 7 Most Heavy Weight Nifty 50 stocks in
1.Last 15 minutes ,
2.Last 1 hour and
3.daily timeframe.
But the list is user customisable.
Future Up + FAD Up (Deep Green)
Future Down + FAD Up (Deep Blue)
Future Up + FAD Down (Yellow)
Future Down + FAD Down (Red)
Only for Educational purpose.

FAD Dashboard A (Indices + Top 5)Inspired by Wealthcon
This dashboard( A ) shows Real Time sentiment change of Future Asset Difference with Future price of 3 Main Index & 5 Most Heavy Weight Nifty 50 stocks in
1.Last 15 minutes ,
2.Last 1 hour and
3.daily timeframe.
But the list is user customisable.
Future Up + FAD Up (Deep Green)
Future Down + FAD Up (Deep Blue)
Future Up + FAD Down (Yellow)
Future Down + FAD Down (Red)
Only for Educational purpose.

VCAI Volume & Liquidity Map LiteVCAI Volume & Liquidity Map Lite visualises recent market participation using a horizontal liquidity/volume histogram plotted beside current price.
It shows where trading activity has clustered, where the chart is thin, and how much of that activity came from buying vs selling pressure.
This Lite edition keeps the tool simple and fast:
Yellow = buy-side volume (aggressive buyers / upward pressure)
Purple = sell-side volume (aggressive sellers / downward pressure)
Thicker sections = higher traded volume at that price
POC line (purple) marks the price with the highest volume concentration
Value Area lines (yellow dashed) mark where ~70% of volume has traded
Bars extend outward to the right of price for a clean, unobstructed chart
Lookback setting controls how many candles the map is built from
Use it to quickly identify:
high-interest price zones
low-liquidity areas where price can move fast
likely reaction levels
where momentum may slow, reverse, or break through
Designed as a lightweight, open-source tool for anyone wanting a clean liquidity/volume map without complex settings.
Part of the VCAI Lite Series.

Breakout Scanner (Screener)Breakout Scanner (Screener style — single indicator to drop in Screener tab)

RTH Yesterday & Today Premarket Levels## **RTH Yesterday & Today Premarket Levels**
This indicator plots the most commonly used **institutional reference levels** for intraday trading:
* **Yesterday’s Regular Trading Hours (RTH) High**
* **Yesterday’s Regular Trading Hours (RTH) Low**
* **Yesterday’s Regular Trading Hours (RTH) Close**
* **Today’s Premarket High**
* **Today’s Premarket Low**
All levels are drawn as **straight horizontal lines with labels** and remain fixed throughout the current session.
---
### **How Levels Are Calculated**
**Yesterday’s Levels (RTH only)**
* Computed strictly from **Regular Trading Hours (09:30–16:00 exchange time)**.
* Extended-hours data is **excluded** to avoid distortion.
* Captures true institutional highs, lows, and closing price.
**Today’s Premarket Levels (PM only)**
* Computed strictly from **today’s premarket session (04:00–09:29)**.
* Resets daily and does not include prior days.
* Levels finalize once premarket ends and extend across the regular session.
---
### **Key Features**
* Exactly **5 fixed reference levels**, no historical clutter
* **Non-repainting**: levels do not change once established
* **No zig-zags or plots**; only clean horizontal lines
* Customizable **line colors and thickness**
* Labels clearly identify each level:
* Y High
* Y Low
* Y Close
* PM High
* PM Low
---
### **Best Use Cases**
* Intraday trading (1m, 5m, 15m)
* VWAP and momentum strategies
* Gap-and-go or fade setups
* Support/resistance validation
* Options trading and scalping
These levels often act as **decision points, liquidity magnets, and rejection zones** during the regular session.
---
### **Required Settings**
* Use **intraday timeframes**
* Enable **Extended Hours** in TradingView’s symbol settings
* Designed for **US equities** using exchange time
---
### **Trader Notes**
This script is intentionally minimalist. It shows only the **most relevant prior-day and premarket price references** used by professional traders, avoiding noise from multi-day indicators or derived averages.

Stage 2 Pullback Swing indicatorThis scanner is built for swing traders who want high-probability pullbacks inside strong, established uptrends. It targets names in a confirmed Stage 2 bull phase (Weinstein model) that have pulled back 10–30% from a recent swing high on light selling volume, while still respecting fast EMAs.
Goal: find powerful uptrending stocks during controlled dips before the next leg higher.
What it looks for
Strong prior uptrend: price above the 50 and 200 SMAs, momentum positive over multiple timeframes
Confirmed Stage 2: price above a rising 30-week MA on the weekly chart
Pullback depth: 10–30% off recent swing highs—not too shallow, not broken
Pullback quality: range contained, no panic selling, trend structure intact
EMA behavior: price near EMA10 or EMA20 at signal time
Volume contraction: sellers fading throughout the pullback
Bullish shift: green candle back in trend direction
Why this matters
This setup hints at institutions defending positions during a temporary dip. Strong stocks pull back cleanly with declining volume, then resume the primary trend. This script alerts you when those conditions align.
Best way to use
Filter a strong universe before applying—quality tickers only
Pair with clear trade plans: risk defined by prior swing low or ATR
Trigger alerts instead of hunting charts manually
Intended for
Swing traders who want momentum continuation setups
Traders who prefer entering on controlled retracements
Anyone tired of chasing extended breakouts

DeM Trend Bias Strength with Alerts (RB Trading)This tool is built to help users understand trend direction, exhaustion, and momentum shifts on the daily timeframe. It highlights when a market is transitioning from weakness to strength or strength to weakness by displaying color-coded bias bars. The script does not forecast future outcomes and should be used as an analytical aid.
Intended Usage
• Timeframe: Daily
• Instruments: Works on most FX pairs and liquid markets
• Style: Trend and bias evaluation
• Purpose: Identify early signs of momentum recovery within ongoing trends
How It Works
Bias Rotation Engine
The script measures directional pressure and smooths it into a bar display that changes color as conditions shift.
• Green bars show rising strength conditions
• Red bars show declining strength conditions
• Transitional periods often appear near market turning points and consolidation zones
This helps users visually separate healthy directional trends from weakening phases.
Trend Alignment Filter
The bars are designed to be interpreted alongside moving averages or broader trend tools. When the bars turn higher while price respects an upward structure, it often supports continuation themes. When the bars weaken during downward phases, it highlights potential areas where the trend retains control.
Identifying Exhaustion and Recovery
Repeated cycles in the bar display can highlight areas where:
• Downside pressure is fading before an upswing
• Upside pressure is fading before a pullback
• Consolidation is forming before a breakout
These transitions tend to align with moments shown in the image where the arrows mark bias shifts occurring before price acceleration.
How to Use It
• Wait for a clear color rotation before making any decisions
• Confirm with the daily trend and price structure
• Avoid using the tool by itself for entries
• Combine with support and resistance, moving averages, and candle structure
• Not intended for scalping or intraday signals
Why Daily Chart Works Best
The daily timeframe smooths out noise and gives the strength bars enough data to reveal genuine trend transitions. Higher timeframes also reduce false rotations that are common in lower timeframes.
Notes
The script does not predict or guarantee price movement. It processes historical inputs to help the user understand directional conditions. Each trader should apply their own risk plan and confirm levels before acting on any idea.


Vib ORB Range (Free)Vib ORB Range (Free) plots the Opening Range High and Low for the session based on a user-defined start time and duration.
This tool is designed for traders who want a clean, no-noise display of the ORB zone without extra indicators or automation.
Features:
Customizable Opening Range start time
Customizable Opening Range duration
Automatically resets daily
Plots ORB High, ORB Low, and optional ORB Midline
Shaded range zone for improved clarity
Works on all timeframes and markets
How to Use:
Set the ORB start time (default 9:30 New York)
Set the ORB duration (default 15 minutes)
The indicator will draw the ORB zone once the range completes
Use the outlines or shaded zone to visually identify potential breakout areas
This free tool is intended as a simple, reliable ORB visualizer without alerts, filters, or strategy logic.

Aroon High R02 - With RR Exit + TP Toggle + VWAPWhat this indicator is for
This is a trend-continuation breakout trading indicator designed to:
Catch strong upside momentum
Enter only after confirmation
Manage risk using fixed SL, RR-based trailing SL, and optional TP
Filter bad trades using VWAP
It’s meant for intraday & positional trading on indices and stocks.


YSD RSIYSD RSI
This indicator is an enhanced version of the traditional Relative Strength Index (RSI), designed to provide deeper insight into market momentum and trend quality. While the classic RSI focuses primarily on the ratio of recent gains to losses, this strengthened variant incorporates additional layers of analysis to capture subtler shifts in price behavior. By applying refined smoothing techniques, integrating volatility awareness, and emphasizing the consistency of directional movement, the indicator aims to reduce noise and highlight more reliable momentum signals. As a result, it not only identifies overbought and oversold conditions with greater precision but also reacts more intelligently to changing market environments. Traders can use this improved RSI to detect early trend reversals, filter out false signals, and gain a more comprehensive understanding of underlying price dynamics compared to the standard RSI.

SBMS RSIThis is everyones favourite RSI with small modification as it has 60 as breaout level and 40 as breakdown level, 80 as Overbrought zone and 20 as oversold zone. An EMA helps to stay in the trend.

30-Minute High and Low30-Minute High and Low Levels
This indicator plots the previous 30-minute candle’s high and low on any intraday chart.
These levels are widely used by intraday traders to identify key breakout zones, liquidity pools, micro-range boundaries, and early trend direction.
Features:
• Automatically pulls the previous 30-minute candle using higher-timeframe HTF requests
• Displays the HTF High (blue) and HTF Low (red) on lower-timeframe charts
• Works on all intraday timeframes (1m, 3m, 5m, 10m, etc.)
• Levels stay fixed until the next 30-minute bar completes
• Ideal for ORB strategies, scalping, liquidity sweeps, and reversal traps
Use Cases:
• Watch for breakouts above the 30-minute high
• Monitor for liquidity sweeps and fakeouts around the high/low
• Treat the mid-range as a magnet during consolidation
• Combine with VWAP or EMA trend structure for high-precision intraday setups
This indicator is simple, fast, and designed for traders who rely on HTF micro-structure to guide intraday execution.

🐋 MACRO POSITION TRADER - Quarterly Alignment 💎Disclaimer: This tool is an alignment filter and educational resource, not financial advice. Backtest and use proper risk management. Past performance does not guarantee future returns.
so the idea behind this one came from an experience i had when i first started learning how to trade. dont laugh at me but i was the guy to buy into those stupid AI get rich quick schemes or the first person to buy the "golden indicator" just to find out that it was a scam. Its also to help traders place trades they can hold for months with high confidence and not have to sit in front of charts all day, and to also scale up quickly with small accounts confidently. and basically what it does is gives an alert once the 3 mo the 6 mo and the 12 mo tfs all align with eachother and gives the option to toggle on or off the 1 mo tf as well for extra confidence. Enter on the 5M–15M after a sweep + CHOCH in the direction of the aligned 1M–12M bias. that simple just continue to keep watching key levels mabey take profit 1-2 weeks and jump back in scaling up if desired..easy way to combine any small account size.
Perfect balance of:
low risk
high R:R
optimal precision
minimal chop
best sweep/CHOCH clarity
hope you guys enjoy this one.

ShooterViz Lazy Trader EMA SystemShooterViz Lazy Trader EMA System - Complete User Guide
What This Script Does
This is a position scaling indicator that tells you exactly when to enter, add to, and exit trades using a simplified 5-EMA system. It removes the guesswork and decision fatigue from trading by giving you clear visual signals.
The Core Concept
3 entry signals that build your position from 20% → 50% → 100%
2 exit signals that scale you out at 50% → 50% (complete exit)
1 higher timeframe filter that keeps you on the right side of the trend
No Fibonacci calculations, no RSI divergence, no multi-indicator confusion. Just EMAs and price action.
What You'll See On Your Chart
1. Colored EMA Lines
Blue Lines (Entry Zone):
3 EMA (lightest blue) - Early reversal detector
5 EMA (darker blue) - Confirmation line
Green Lines (Add Zone):
21 EMA (bright green) - First add location
34 EMA (lighter green) - Final add location
Red Lines (Exit Zone):
89 EMA (lighter red) - First exit trigger
144 EMA (darker red) - Final exit trigger
Orange Lines (Hyper Frame - optional):
Hyper 21 EMA (from higher timeframe) - Trend direction
Hyper 34 EMA (from higher timeframe) - Bias confirmation
2. Triangle Signals
Green Triangles (Below Price) = BUY/ADD:
Lime triangle with "20%" = Entry 1: Price reclaimed 3→5 EMA (starter position)
Green triangle with "30%" = Entry 2: Price bounced off 21 EMA (first add)
Teal triangle with "50%" = Entry 3: Price broke out from 34 EMA compression (final add)
Red Triangles (Above Price) = SELL:
Orange triangle with "50% OFF" = Exit 1: Price broke below 89 EMA (take half off)
Red triangle with "EXIT ALL" = Exit 2: Price broke below 144 EMA (close remaining position)
3. Background Color (Trend Bias)
Light green background = Hyper frame EMAs trending up (bias LONG)
Light red background = Hyper frame EMAs trending down (bias SHORT)
Gray background = Neutral/choppy (be cautious)
4. Info Table (Top Right Corner)
A live status dashboard showing:
Which entry signals are currently active (✓ or —)
Which exit signals are currently active (⚠ or ⛔)
Current hyper frame bias (🟢 LONG / 🔴 SHORT / ⚪ NEUTRAL)
Which timeframe you're using for hyper frame filtering
How to Install and Set Up
Step 1: Add the Script to TradingView
Open TradingView
Click "Pine Editor" at the bottom of the screen
Copy the entire script code
Paste it into the Pine Editor
Click "Add to Chart"
Step 2: Configure Your Settings
Click the gear icon ⚙️ next to "LazyEMA" in your indicators list.
Critical Settings to Configure:
Hyper Frame Selection (Most Important!)
Location: "Hyper Frame (Pick ONE)" section
Setting: "Timeframe"
What to choose:
Trading 15min or 1H charts? → Use "240" (4-hour)
Trading 4H or Daily charts? → Use "D" (Daily)
Trading Daily or Weekly charts? → Use "W" (Weekly)
Why this matters: This filter keeps you aligned with the bigger trend. Only take longs when this timeframe is green, shorts when it's red.
MA Type (Optional, default is fine)
Location: "MA Config" section
Default: EMA (recommended)
Options: EMA, SMA, WMA, HMA, RMA, VWMA
Most traders should stick with EMA
Visual Toggles (Customize your view)
Entry Zone: Turn individual EMAs on/off (3, 5, 21, 34)
Exit Zone: Turn individual EMAs on/off (89, 144)
Hyper Frame: Toggle the higher timeframe EMAs on/off
Step 3: Clean Up Your Chart
Turn OFF these if visible:
Volume bars (they clutter the view)
Any other indicators you have loaded
Grid lines (optional, but cleaner)
Keep ONLY:
Price candles
Your ShooterViz Lazy Trader EMA System
Maybe support/resistance levels if you manually draw them
How to Trade With This Script
The Basic Workflow
Before the Market Opens:
Check the background color and info table bias
Green background? Look for LONG setups only
Red background? Look for SHORT setups only
Gray background? Stay flat or trade small
During the Trading Session:
LONGS (When hyper frame is bullish):
Wait for Entry 1 signal:
Lime triangle appears with "20%"
Price has reclaimed the 5 EMA after dipping to 3 EMA
Action: Enter 20% of your intended position
Stop loss: Place below the 5 EMA or recent swing low
Wait for Entry 2 signal:
Green triangle appears with "30%"
Price pulled back to 21 EMA and bounced
Action: Add 30% more (you're now at 50% total)
Move stop: Trail it up to below 21 EMA
Wait for Entry 3 signal:
Teal triangle appears with "50%"
Price compressed at 34 EMA and broke out
Action: Add final 50% (you're now 100% loaded)
Move stop: Trail it up to below 34 EMA
Wait for Exit 1 signal:
Orange triangle appears with "50% OFF"
Price broke below 89 EMA
Action: Exit 50% of your position immediately
Move stop on rest: Trail to 89 EMA or lock in profits
Wait for Exit 2 signal:
Red triangle appears with "EXIT ALL"
Price broke below 144 EMA
Action: Exit remaining 50% (you're now flat)
Or: Stop gets hit at 89 EMA (same result)
SHORTS (When hyper frame is bearish):
Same process, but inverted
Triangles appear above price instead of below
Look for breakdowns below EMAs instead of bounces off them
Exit when price reclaims 89 and 144 EMAs
Real-World Example Walkthrough
Setup: Trading ES (S&P 500 Futures) on 1H Chart
Chart Configuration:
Timeframe: 1 Hour
Hyper Frame: 240 (4-hour)
Ticker: ES
Pre-Market Check:
Background is light green
Info table shows "🟢 LONG" for Hyper Bias
Decision: Only look for long entries today
9:30 AM - Market Opens
Price dips and touches 3 EMA
Watch for: Reclaim of 5 EMA
9:45 AM - Entry 1 Triggers
Lime triangle appears below bar
Price closed above 5 EMA at $4,550
Action taken:
Enter long 20% position (2 contracts if targeting 10 total)
Stop loss at $4,545 (below 5 EMA)
Risk: $10 per contract × 2 = $20 risk
10:30 AM - Entry 2 Triggers
Price rallied to $4,565, pulls back
Green triangle appears at 21 EMA ($4,555)
Action taken:
Add 30% (3 more contracts, now have 5 total)
Move stop to $4,550 (below 21 EMA)
Current P/L: +$25 ($5 gain on original 2 contracts, break-even on new 3)
11:15 AM - Entry 3 Triggers
Price consolidates at 34 EMA around $4,560
Teal triangle appears as price breaks to $4,568
Action taken:
Add final 50% (5 more contracts, now have 10 total)
Move stop to $4,555 (below 34 EMA)
Current P/L: +$70
1:00 PM - Price Extends
Price rallies to $4,595 (on track)
89 EMA is at $4,575
No action yet, let it run
2:15 PM - Exit 1 Triggers
Price pulls back from $4,600
Orange triangle appears as price breaks below 89 EMA at $4,580
Action taken:
Exit 50% (5 contracts closed at $4,580)
Keep 5 contracts with stop at 89 EMA ($4,575)
Banked: +$150 average gain on closed 5 contracts
2:45 PM - Exit 2 Triggers
Price continues down
Red triangle appears as price breaks 144 EMA at $4,570
Action taken:
Exit remaining 5 contracts at $4,570
Banked: +$100 on remaining 5 contracts
Final Results:
Total gain: $250 on the trade
Initial risk: $50 (if stopped out at Entry 1)
Risk/Reward: 5:1
Time in trade: ~5 hours
Common Questions
"What if I miss Entry 1? Can I still take Entry 2?"
Yes! Each entry is independent. If you miss the 3→5 reclaim, wait for the 21 EMA bounce. You'll start with a 30% position instead of 20%, but that's fine.
Rule: Never chase. Wait for the next EMA setup.
"What if multiple entry signals trigger at the same bar?"
Rare, but possible. If you see both Entry 1 and Entry 2 trigger together:
Take Entry 1 first (20%)
If the next bar confirms Entry 2 is still valid, add 30%
When in doubt, scale in gradually
"The hyper frame is green but I'm seeing short signals?"
Don't take them. The hyper frame is your bias filter. If it says "go long," ignore short setups. They're usually lower probability and will get stopped out.
"Can I use this for swing trading overnight?"
Absolutely. Just switch your hyper frame:
If you're on Daily charts, use Weekly hyper frame
If you're on 4H charts, use Daily hyper frame
Adjust position sizes for overnight risk
"What if the signal appears right at market close?"
Don't chase it. Wait for the next bar (next day) to confirm. Signals that appear in the last 5 minutes are often noise.
"How do I set up alerts?"
Right-click on the chart
Select "Add Alert"
Choose "LazyEMA" from the condition dropdown
Select which signal you want alerts for:
Entry 1: 3→5 Reclaim
Entry 2: 21 EMA Add
Entry 3: 34 EMA Breakout
Exit 1: 89 EMA Break
Exit 2: 144 EMA Break
Click "Create"
Pro tip: Set up all 5 alerts so you never miss a signal.
Position Sizing Guide see
swingtradenotes.substack.com
Critical Rule: Know your total risk BEFORE you take Entry 1. Don't wing it.
Customization Tips
For Day Traders (Scalpers)
Use 5min or 15min charts
Hyper frame: 1H or 4H
Expect 2-4 setups per day
Tighter stops (0.5% risk per entry)
For Swing Traders
Use 4H or Daily charts
Hyper frame: Daily or Weekly
Expect 1-2 setups per week
Wider stops (1-2% risk per entry)
For Position Traders
Use Daily or Weekly charts
Hyper frame: Weekly or Monthly
Expect 1-2 setups per month
Widest stops (2-3% risk per entry)
The "Don't Be Stupid" Checklist
Before taking ANY signal from this script, ask:
✅ Is the hyper frame bias pointing in my direction?
✅ Is the signal clean (not at a weird time or during news)?
✅ Do I know my stop loss level?
✅ Do I know my position size?
✅ Can I afford to lose if this trade fails?
If you answered "no" to ANY of these, skip the trade.
Troubleshooting
"I'm not seeing any signals"
Possible causes:
The "Show Lazy Trader System" toggle is off (turn it on)
Your chart timeframe is too high (try 1H or 4H)
Market is in a tight range (EMAs are compressed)
You need to refresh the chart
"Too many signals, getting whipsawed"
Fixes:
Increase your chart timeframe (go from 15m to 1H)
Switch to a less volatile ticker
Only trade when hyper frame bias is STRONG (not neutral)
Add a minimum bar count between signals
"The info table is covering my price action"
Fix:
Edit the script
Find the line: table.new(position.top_right, ...
Change position.top_right to position.bottom_right or position.top_left
"Signals appear then disappear"
This is normal (repainting). Some signals (especially compression breakouts) can disappear if the next bar reverses. This is why you:
Wait for bar close before acting
Use alerts that only fire on confirmed bars
Don't chase signals mid-bar
Final Thoughts
This script is a decision-making tool, not a crystal ball. It shows you high-probability setups based on EMA dynamics and trend structure. You still need to:
Manage your risk
Choose your position size
Stick to the rules
Accept losses when they happen
The system works when YOU work the system.
Print this guide, tape it next to your monitor, and follow it religiously for 20 trades before making ANY changes.
Good luck, and stay lazy (the smart way).

SHUBHAM 50000 ULTRA OPTIONSHUBHAM 50000 ULTRA OPTION
OptionFlow Pro: Smart Money & Anomaly Detection Indicator
Tagline: Don't just follow the flow. Understand it.
Core Concept:
OptionFlow Pro is an advanced, real-time market scanner and visual indicator that transforms raw options chain data into actionable trading intelligence. It goes beyond simple volume and open interest by identifying Unusual Options Activity (UOA), tracking Sweep Orders, and calculating the Volume-Weighted Put/Call Ratio to highlight where institutional "smart money" is placing its bets.
Key Features for Traders:
Unusual Activity & Sweep Detector:
What it does: Scans every tick for orders that significantly deviate from normal trading patterns—large block trades executed at the ask (for calls) or bid (for puts), and "sweep" orders that clean out multiple price levels instantly.
Trader Benefit: Pinpoints potential breakout or breakdown candidates before major moves occur in the underlying stock. Alerts you to aggressive, high-conviction buying or selling that retail traders often miss.
Volume-Weighted Put/Call Ratio (with Trend):
What it does: Calculates the put/call ratio not just by volume, but by the premium spent. A high premium-weighted put/call ratio shows bears are putting serious money behind their bets, making it a stronger signal.
Trader Benefit: Offers a more nuanced view of market sentiment than standard PCR. Helps gauge extreme fear (potential oversold bounce) or complacency (overbought top) in a specific stock or index (SPX/SPY).
Max Pain & Gamma Exposure (GEX) Visualizer:
What it does: Dynamically calculates the "Max Pain" strike (where option sellers face minimal losses) and estimates Gamma Exposure levels. Visual overlays on the chart show key pin levels and large gamma walls.
Trader Benefit: Identifies potential price magnets for weekly/monthly expiry. Understand where hedging activity by market makers may amplify volatility (negative gamma) or suppress it (positive gamma), aiding in entry/exit planning.
Implied Volatility (IV) Rank & Skew Analysis:
What it does: Compares current IV to its historical range (IV Rank) and visualizes the volatility smile/skew across strikes. Highlights expensive vs. cheap option premiums.
Trader Benefit: Empowers you to sell overpriced volatility (high IV Rank) and buy underpriced volatility (low IV Rank). Skew anomalies can signal asymmetric risk/reward opportunities or market fears about a sharp directional move.
Customizable Alerts & Heatmaps:
What it does: Set alerts for specific UOA criteria, PCR spikes, or IV changes. The platform-wide heatmap aggregates flow data across all symbols to show sector-level money movement.
Trader Benefit: Saves hours of manual scanning. Focus only on the setups that match your strategy (e.g., "Alert me for any $1M+ call sweeps in tech stocks").
Who Is It For?
Active Options Traders & Scalpers: Find high-probability directional plays with institutional confirmation.
Hedgers & Portfolio Managers: Identify tail-risk hedging activity and gauge overall market dealer positioning.
Volatility Traders: Precisely time entries for strangles, straddles, or iron condors based on IV regime and gamma.
Swing Traders & Technical Analysts: Confirms or diverges from classic chart patterns (e.g., breakout with strong call flow = higher conviction).
Why It's Different:
Most indicators look backward at price. OptionFlow Pro looks forward at market structure, liquidity, and dealer hedging flows. It doesn't predict the future; it reveals the present positioning that will influence future price action.
Platform Integration: Available as a standalone web platform, a TradingView custom script, and a direct data feed into thinkorswim, Interactive Brokers, and other major brokerages.

Market Structure Shift (MSS) [Sword & Shield]MARKET STRUCTURE SHIFT (MSS)
A clean and focused indicator for identifying Market Structure Shifts in price action.
════════════════════════════════════════════════════════════════════════════════
WHAT IS MARKET STRUCTURE SHIFT (MSS)?
════════════════════════════════════════════════════════════════════════════════
A Market Structure Shift occurs when price breaks a significant swing high or swing low,
indicating a potential change in market direction. This indicator automatically detects
and plots these key levels.
BULLISH MSS: Price breaks above a previous swing high
BEARISH MSS: Price breaks below a previous swing low
════════════════════════════════════════════════════════════════════════════════
FEATURES
════════════════════════════════════════════════════════════════════════════════
CLEAN DISPLAY
- Shows only the last 2 MSS by default (1 bullish + 1 bearish)
- Keeps charts clean and focused on recent structure
- Automatically removes old MSS when new ones appear
CUSTOMIZABLE DETECTION
- Adjustable swing detection (left/right bars)
- Choose break confirmation method (Close or Wick)
- Fixed-length lines (no infinite extension by default)
SMART FILTERING
- Only plots one MSS per direction until opposite MSS occurs
- Prevents duplicate signals in the same direction
- Clear visual distinction between bullish (blue) and bearish (red)
CLEAN LABELS
- Text labels positioned above lines
- No background tooltips for cleaner appearance
- Color-matched to their respective MSS lines
════════════════════════════════════════════════════════════════════════════════
SETTINGS
════════════════════════════════════════════════════════════════════════════════
SWING DETECTION
- Swing Left Bars (default: 2)
- Swing Right Bars (default: 2)
- Higher values = more significant swings detected
BREAK CONFIRMATION
- Close: MSS confirmed when candle closes beyond level
- Wick: MSS confirmed when wick touches beyond level
DISPLAY OPTIONS
- Show Only Last 2 MSS: ON by default (keeps chart clean)
- Extend lines to the right: OFF by default (fixed-length lines)
- Line bars (when not extended): 50 bars (customizable)
════════════════════════════════════════════════════════════════════════════════
HOW IT WORKS
════════════════════════════════════════════════════════════════════════════════
DETECTION LOGIC
1. Identifies swing highs and swing lows using pivot detection
2. Monitors price action for breaks of these levels
3. Confirms break based on selected method (Close or Wick)
4. Plots MSS line at the broken level
FILTERING LOGIC
- Only one MSS per direction is allowed consecutively
- Example: If bullish MSS appears, no new bullish MSS until bearish MSS occurs
- This prevents multiple signals in trending markets
DISPLAY LOGIC
- When "Show Only Last 2 MSS" is enabled:
• Only the most recent bullish MSS is shown
• Only the most recent bearish MSS is shown
• Old MSS are automatically deleted when new ones appear
- When disabled: All historical MSS remain visible
════════════════════════════════════════════════════════════════════════════════
USAGE EXAMPLES
════════════════════════════════════════════════════════════════════════════════
FOR TREND IDENTIFICATION
- Bullish MSS = Potential uptrend beginning
- Bearish MSS = Potential downtrend beginning
- Use in conjunction with other indicators for confirmation
FOR ENTRY SIGNALS
- Wait for MSS to confirm trend change
- Enter on pullback to MSS level
- Use MSS as support/resistance
FOR SCALPING (Lower Timeframes)
- Swing Left/Right Bars: 2-3 (more sensitive)
- Break Confirmation: Close (more reliable)
- Show Only Last 2 MSS: ON (cleaner charts)
FOR SWING TRADING (Higher Timeframes)
- Swing Left/Right Bars: 5-10 (more significant swings)
- Break Confirmation: Close (avoid false breaks)
- Show Only Last 2 MSS: ON or OFF based on preference
════════════════════════════════════════════════════════════════════════════════
VISUAL DESIGN
════════════════════════════════════════════════════════════════════════════════
LINES
- Dashed style for easy identification
- Blue for bullish MSS
- Red for bearish MSS
- Fixed length (50 bars default) for cleaner appearance
LABELS
- "MSS" text positioned above each line
- No background for clean display
- Color-matched to line color
- Small size to avoid chart clutter
════════════════════════════════════════════════════════════════════════════════
CREDITS & LICENSE
════════════════════════════════════════════════════════════════════════════════
© Sword & Shield
This Pine Script code is subject to the terms of the Mozilla Public License 2.0
mozilla.org
