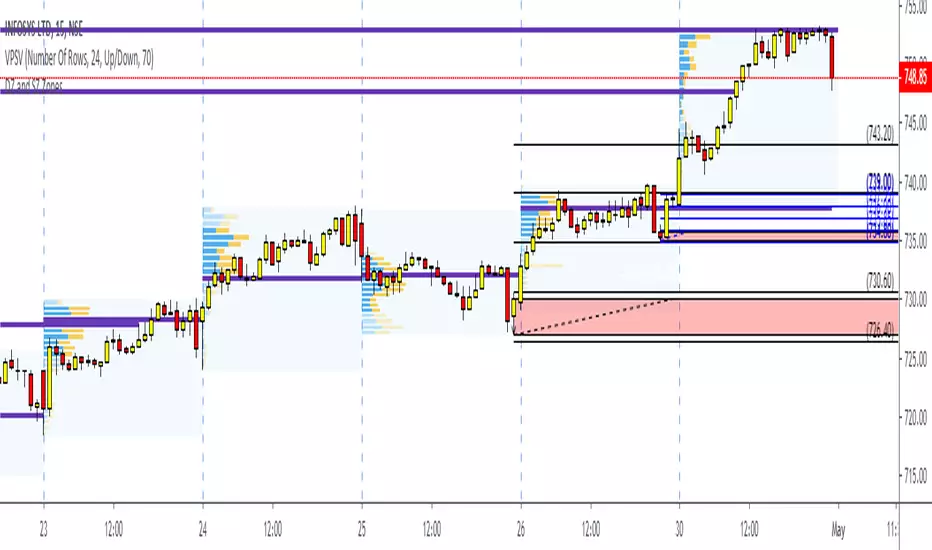
Dynamic Resistance and Support by A3T - DRS System
Concept : The script Calculates supply-demand areas based on price and change in volume w.r.t change in price (momentum). The EMA slope is read to identify the trend and signals are generated based on the relative strength of all 3 component i.e price, change in price-volume ratio and trend. BLUE channel is formed based on Relative strength of price(RSI) and RED channel is formed based on change in price-volume ratio strength.(Calculating for x price movement what is the volume used based on averaging concept)
Trade setup :
-For BUY signal allow candles to form a proper channel. Once the channel is stable let the price to above the channel and retest the channel. The trade entry will be once the high of retraced candles and last BUY signal candle high breaks. SL will be 1m candle close below the channel.
- For SELL signal allow candles to form a proper channel. Once the channel is stable(Straight line) let the price to go below the channel and retest the channel. The trade entry will be once the low of retraced candles and last SELL signal candle low breaks. SL will be 1m candle close above the channel.
- For Breakout trade there should be a high volume candle RED/GREEN (Dark FILL) inside the channel to execute the trade.
Note: If the breakout is with white filled candle then avoid that trade. Works only on high liquid counters with moderate volatility.
Also check Green and Red line which is S1 and R1 of pivot points.
Major benefits o DRS system :
- Automatic – no more guessing, or subjective line drawing
- Calculates supply demand areas based on price and change in volume w.r.t price change (momentum)
- Multiple time frames & fully customization - measured automatically
- 1/5m time frame is best for intraday trading. Will find 2-3 breakouts per day.
- Buy/Sell signals are majorly found during trending day only.
- Inbuilt Buy and Sell signal ( Trading rule apply)
- SL based on channel end.
-Trailing SL also can be opted with blue 44-ema line
- No signals are generated on low liquid counters with high/low volatility (price change > 0.2% and < 2% and avg. volume >20K/candle )
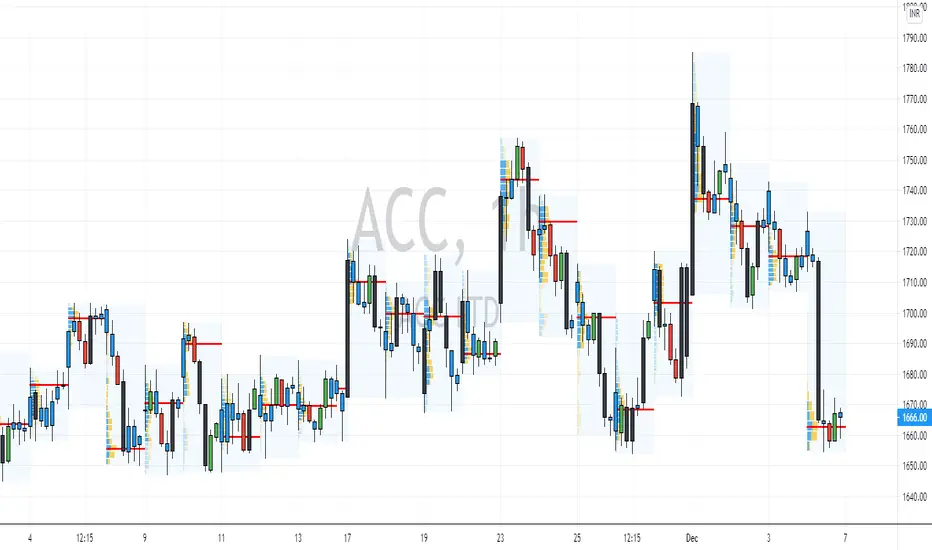
Example Chart Above : All sample chart above shows the DRS trading system applied on Banknifty(NSE)
Demandandsupplyzones

[VC] Cumulative Delta Histogram V1.0The V.C Cumulative Delta Histogram shows the market's ongoing Buying/Selling pressure. It helps to determine whether Supply or Demand is dominating and in control.
➤If the Cumulative Delta Increases, the buyers are in control.➚
➤If the Cumulative Delta Decreases, the sellers are in control.➘
The use cases for this Indicator are vast and correlated with our other Delta Indicators. The following examples will explain how to use this Indicator.
Example 1 EUR / USD
In the above example, Negative Cumulative Delta Decreased & Turned into Positive Cumulative Delta. That indicates that sellers are losing control & buyers are getting power.
As a confirmation on the ' 'Box Chart Histogram'' it is evident that Demand is also increasing.
And on ''Wave Chart Index'' as a 3rd confirmation, you can see that the Delta has also increased compared to previous waves.
Example 2
Positive Delta on Cumulative Delta Histogram is decreasing & Negative Delta started increasing.
On the Box Chart Histogram , Demand is decreasing & Supply is increasing.
Additionally, on the Wave Chart Index , the Delta of the wave is also decreasing.
(in short, besides ''Cumulative Delta Histogram," Box chart Histogram & Wave Chart Index is also adding additional confirmation)
Note: Two types of Delta sources are included in this Cumulative Delta Indicator.
Type A: Simple Delta
Type B: Delta %
Simple Delta is the difference between Net Buying - Selling pressure.
Delta % also works in the same calculation, but a Volume weighted algorithm is applied on it.
You may use any of them that suits your analysis.
VC Cumulative Delta Histogram Settings & Inputs
Source:
Allows you to choose the source, Between Simple Delta & Delta %.
Cumulative Length:
Allows you to Change the cumulative length.
Positive & Negative Color:
It allows you to change the colors.
Style Menue
Allows you to change the style & color of the histogram.
Disclaimer Note:
V.C Cumulative Delta Histogram It is purely Volume , Delta, Demand & Supply imbalance and comparative analysis-based tool. Before applying this Indicator to your study, you should know about Volume , Delta & Spread, Demand & Supply, and Aggressive & Passive behaviour of buyers/sellers.
Some basic understanding of Sir Richerd Wyckoff's Theory can also be helpful.

Base Candle NewBase / Imbalance Candle
It automatically highlights the candle color to yellow (default) where there is imbalance between buyers and sellers or in other words, a base or fight between buyers and sellers. When you identify this base candle, you can mark the demand and supply zones easily.
[VC] Box Chart Index V1.0The ''V.C Box Chart Index'' shows the shortest possible wave. It graphically shows the continuous up movement or continuous down movement in the form of a box. As soon as the direction changes, the box changes as well.
It is an effortless way to show the price change that occurred in the box visually. It also correlates to what Wyckoff said about as the buying waves increase in volume, time, and length & the selling waves shorten, lookout for a change in the prevailing trend.
The example below shows more big green boxes than red, and the price change caused by the green box has made the uptrend.
Important Note:
V.C Box Chart Index also correlates to another indicator named V.C Box Chart Histogram
V.C Box Chart Histogram draws the cumulative delta based on each box as a histogram. Combining these two indicators empowers you to see the cumulative demand & supply and buying & selling quantity of each box.
See the Example Blow:
The above example shows that supply is decreasing on down boxes, indicating that fewer sellers are left to pull the market down.
On the other hand, demand increases on the up boxes, indicating that more buyers are coming into the market. As a result, every green box is breaking the previous high & price is moving upside.
For a more comprehensive understanding of the co-relation of these two indicators, read the description from the link below.
V.C Box Chart Index Settings & Properties Explained
Border of Box:
Allow you to show/hide the border of the box
Positive Box & Negative Box Borders:
Allow you to change the border color & opacity
Positive Box & Negative Box:
Allow you to change the color & opacity of the box
Disclaimer Note:
V.C Box Chart Index is not a BUY/SELL signal based indicator or a holy grail trading system.
It is purely Volume, Delta, Orderflow, Demand & Supply imbalance and comparative analysis based indicator tool kit. Before applying this indicator to your analysis, you should know about Volume, Delta & Spread, and Demand & Supply.
Some basic understanding of Sir Richerd Wyckoff's Theory can also be helpful.

Magic levelsIt is by far the simplest on chart presentation of Gann square of 9. It calculates the levels based on previous day closing. These levels usually acts as support and resistance.

Volume Profile - Custom Range, Interactive by DGTVolume Profile - Custom Range aims to display trading activity at specific price levels over user defined Custom Range of trading. Start and End Time is Interactive , they can be adjusted simply by clicking on the chart and drag the lines to specify the desired custom range. Same as is with the drawing tools available in TV
Please note, while switching between timeframes or switching to different instruments with different exchange timezones you may need to adjust the locations in case the plotting is not displied
Volume Profile - Custom Range is plotted as two horizontal histograms on the finacial isntrumnet's chart that highlights the trader's common interest at specific price levels as well as aims to reveal dominant party of who is in control, bulls or bears
You are also invated to galnce at Volume-Profile-and-Volume-Indicator , Anchored-Volume-Profile , and Price Action-Support-Resistance for different perspective of Volume Profiles
Special thanks to everyone who commented and presented their valuable suggestions
Disclaimer: Trading success is all about following your trading strategy and the indicators should fit within your trading strategy, and not to be traded upon solely
The script is for informational and educational purposes only. Use of the script does not constitutes professional and/or financial advice. You alone the sole responsibility of evaluating the script output and risks associated with the use of the script. In exchange for using the script, you agree not to hold dgtrd TradingView user liable for any possible claim for damages arising from any decision you make based on use of the script

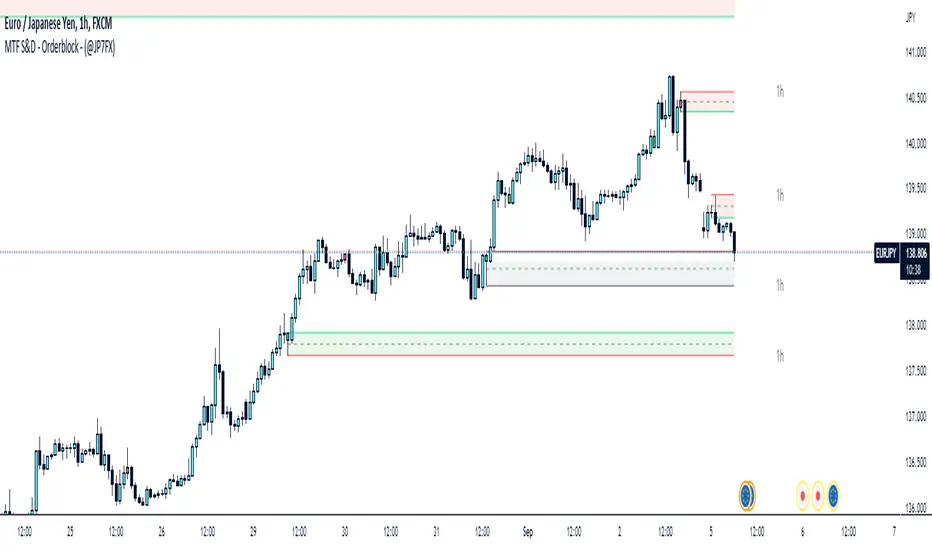
Supply & Demand / Orderblocks - Multi TimeFrame (@JP7FX)This should easily find the clear BUY to SELL / SELL to BUY candles with imbalance created.
There are options to change the Supply and Demand / OrderBlock CREATION based off the OPEN or WICK imbalance and also the option to DRAW the zones from the OPEN or the WICK.
Will also draw HTF zones with options to change the colour of zones when price has mitigated these areas, zones will be deleted once price has passed through.
Each Zone has the 50% line drawn and will delete when Price has reached - maybe useful for traders who look for 50% mitigation of areas.
When using HTF zones (max of 2) a Timeframe display will show for that zone.
There are many options to change colours and lines etc to suit the layout you prefer.
The zones that are created are not to trade from without additional analysis its simply to help draw strong zones.
Hope this provide some help and Trade Safe :)
Demand & Supply Zones [eyes20xx]Demand & Supply Zones
This indicator helps to identify large moves driven by institutions.
What qualifies as a zone?
If the price moves (open to close) by more than a certain % in one candle or in a bullish / bearish run of candles, the zone is marked as a Demand or Supply zone .
0.8% is good for Crypto and Forex might be better with 0.4%. Play around with the % to match your requirements.
Active zones
A zone remains active until it is hit by the price. When it becomes inactive, the zone background becomes transparent.
Zone lines
Lines are displayed if the zone is active and within a certain % of the close. 3% is a good setting for Crypto.
A maximum of two lines are displayed for each zone type.

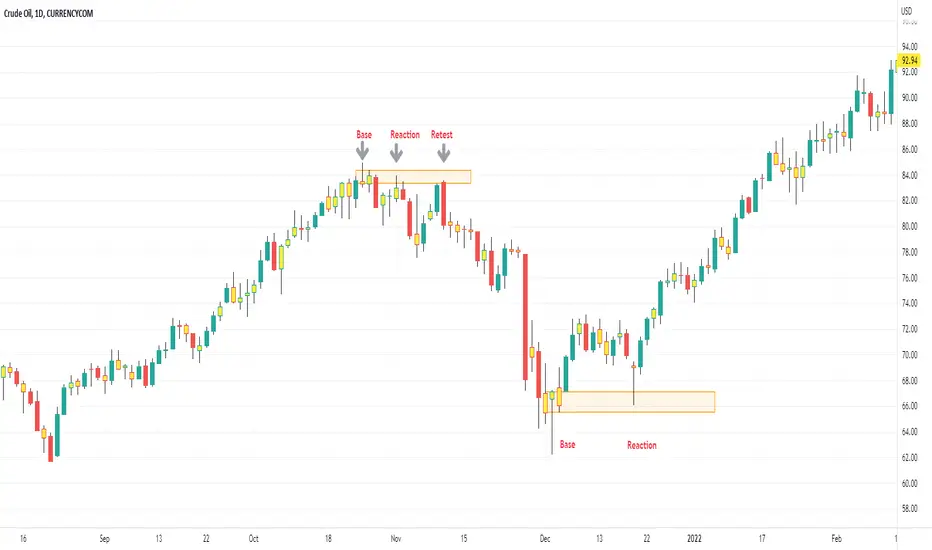
STC Price Action ZoneHow this works:
This Indicator looks to identify patterns which shows high movement area which may have occurred due to big orders at that time. It helps to Identify Price Action Zones where we may anticipate some reverse move. These Zones & Moves are helpful for Traders.
Buying Zone is below current Market Price. It indicates Price Action area where Buyers overpowered Sellers hence there was big Leg out Candle. This zone may again give buying momentum if Price comes back to that level. As a Trader one may take opportunity enter into the Trade on Bullish Side.
Selling Zone is above current Market Price. It indicate Price Action area where Sellers overpowered Buyers hence there was big Leg out Candle. This zone may again give Selling momentum if Price comes back to that level. As a Trader one may take opportunity enter into the Trade on Bearish Side.
DISCLAIMER:
This indicator/code IS NOT intended to be a formal investment advice or recommendation by the author, nor should be construed as such. Users will be fully responsible by their use regarding their own trading vehicles/assets.
It is strongly recommended that you should get full knowledge of how price actions work and wait for the clear indications before attempting.

KryptOkib Supply and Demand with AlertsAs the name suggests, this is a supply and demand indicator script with alerts that i have made based on sole price actions. I have used 3 different methods of identifying supply and demand zones and tested to make sure they work. Nonetheless some zones will fail as no strategy is 100% and some zone will fail due to other reasons.
How this works:
As a basic rule, demand and supply zones can easily be identified from the base of a drop to a rally or vice versa and the base of a rally to a new rally, hence rally base rally, drop base rally for demand zones and rally base drop and drop base drop for supply zones.
While that is true, i basically search for areas where demand/bulls overpower supply/bears and vice versa with a strong move away. So not all the base are a consideration in this script unless we see a clear sign of bulls overpowering bears, or say demand overpowering supply and bears overpowering bulls or say supply overpowering demand. Several rules has been put in place to identify and filter this out so you may have a Rally Base Drop get ignored by this indicator as it do not meet my requirement.
Once this pattern is detected by the script using either of the 3 price action methods, and then a breakout of the basing candles occurs, the indicator paints the candlestick that broke out of the range/base with a different color, which is blue for demand breakout candle, and orange for a supply breakdown candle as circled on the chart.
The algorithm makes sure that this breakout candles follow strict rules set by mean of which 1 is a very bullishly closing breakout candle for demand or a very bearishly closing candle for a supply, with a follow through candle which is the next trading period /candle.
it is strongly recommended that you wait for the close of the next candlestick before attempting to take the demand/supply zone formed as there are further calculations done on the follow through breakout candle to make sure the demand/supply is a good one, the candle might be painted before the close of the next candle but after the close, the paint will be removed due to the fact that the zone no longer meets strict criteria as defined by me.
It is also suggested that you use the alert function that comes with script and wait for the alert to come through before taking the demand if you cannot wait for the second breakout candle to close as the alert will be fired only on close of the second follow through breakout candle.
One of the strict rules is wanting to see strong bullish/bearish presence apart from the way the breakout candle closes, there are many rules to filter out ugly zones, even though some good zones get caught up in this as well.
Identification of Zones:
Demand Zone: the previous candle open or high(based on personal preference) will be the proximal, where you start to draw your demand zone and the low of the basing/ranging candles or swing low will be the distal, where you end your demand zone as seen on the chart. Stop loss goes under this.
Supply Zone: The previous candle open or low will be the proximal, where the supply zone starts and the high of the range/basing candles or swing will be the distal where the supply zone ends as seen on the chart. Stop loss goes above this
Note that some zones with a-lot of basing candles tend to fail, while some tend to work, i have not algorithmically filtered this as i prefer to examine with eyes the zones alerted to me and take the ones with lesser basing candles.
Generally, Rally Base Rally and Drop Base Drop zones are mostly weaker than the other type of zones but sometimes works perfectly.
How to use Alert Function:
- Go on the ticker you will like to set alert for
- Go on the timeframe you wish to be alerted for
- Right Click on the chart and select Add Alert or Alt + A (keyboard combination)
- Under Condition, click the arrow down and select "KryptOkib SAND"
- Under Options, select "Once Per Bar Close"
- Set Expiration and Alert Actions as you prefer.
- Click on "Create" Button
That is it.
You can repeat this process for all other tickers you wish to have alerts for and you will be notified once price movement has met the conditions outlined in the script.
This is an invite only indicator, to request access to it, kindly do the following:
- Add indicator to favorite
- Make Sure you follow me
- Send me a PM requesting access.
Once this is done and PM received, access will be granted.
Further updates will come along once there are changes to be made or new calculations to add.
Works on any market of choice.

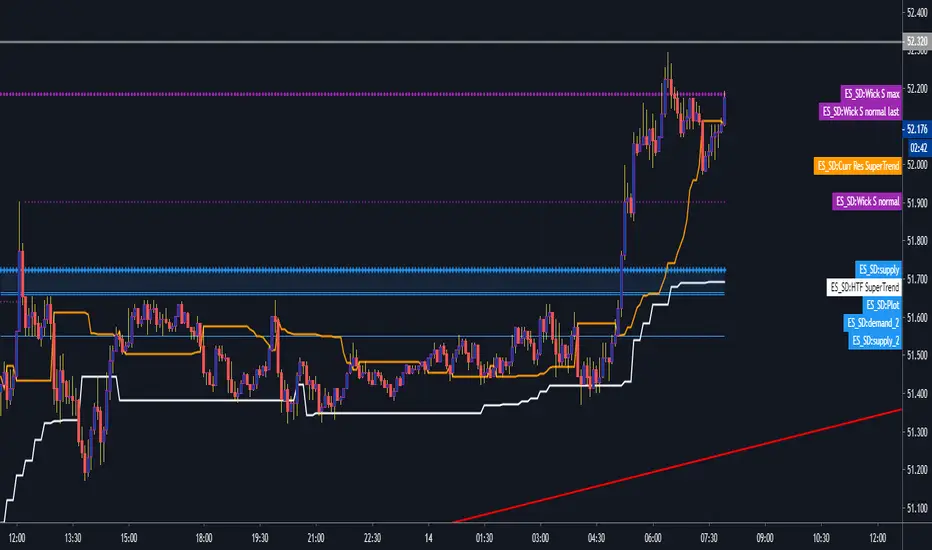
[astropark] Fast Supply Demand Order Blocks FinderDear Followers,
today another awesome Analysis Tool, that you can use both for Swing and Scalping Trading: Fast Supply Demand Order Blocks Finder !
Every time it finds a bullish Order Block (Demand) or a bearish OB (Supply), it shows it immediatelly and when the OB is touched by price, an alert is triggered and a circle is displayed.
Keep in mind that trading Supply and Demand is quite easy:
short/sell at Supply (Bearish OB)
long/buy at Demand (Bullish OB)
short/sell if Demand (Bullish OB) gets broken
long/buy if Supply (Bearish OB) gets broken
This indicator has the resolution option , so you can checkout higher timeframes OBs, whatever timeframe you are.
Also you can refine the OBs finder algo fine tuning some filter options or you can just disable them all.
The indicator keeps track of all previous historic Supplies and Demands , but if too much are shown and you don't like it, you can just cut them by defining a specifc Analysis Starting Date/Time using the specific input options in the indicator settings.
Optionally you can also change lines' color and width, as well as enable/disable the OB hits circles.
Here below you can see some charts that shows how the indicator works on many timeframes, resolutions and markets.
XAUUSD 1h, using 6h resolution - part 1
XAUUSD 1h, using 6h resolution - part 2
XAUUSD 1h, using 6h resolution - part 3
BTCUSD 1h, without using resolution
EURUSD 5m, using 30m resolution
SPX500 5m, using 30m resolution
As I always says, all tools are great if you use them correctly: this is not the "Holy Grail", so always use proper money and risk management strategies.
This is a premium indicator , so send me a private message in order to get access to this script.

Demand and Supply zone Master IndicatorThe Demand and Supply Zone indicator helps to identify the valid demand and supply zones by removing the played out zones. This indicator looks for all patterns , Rally-Base-Rally and Drop-Base-Rally mark the zone as "DZ". Same way with pattern Drop-Base-Drop and Rally-Base-Drop it will mark "SZ".
The indicator is fully customizable as per your trading style.
What does the Indicator do ?
Normal = Aggressive Trader
Strong = Conservative Trader
V Strong = V Conservative Trader
Based on Trading style one can choose the option available. Default gives the best result.
1. Explosive candle Range : One can choose explosive candle range.
2. Basing Candle Range : One Can Choose Basing candle range.
3. Normal Candle Range : One can choose the normal candle range.
4. Legout Strength : One can customize the Legout Strength.
5. Demand and Supply zone version :
High - Low = Most traders use the high and low of the basing for calculating their zone.
Body - Low = Body (Base candle body high for demand zone and Body low for supply zone ). Normally beginner ( Conservative trader ) uses this option.
Continuous base = 1 to 10 : Based on the requirement one can use the number of basing candle.
max normal = 2 to 10 : Based on the requirement one can use the number of normal candle.
min normal = 1 to 10 : Min one to form the zone.
Line width = 1 to 5
MaxTouches = One can set the number of times the price visits the zone. 1 for Conservative trader and 3 for aggressive trader. Once the price touches the zone more than the given input, lines get deleted. Also if the price is grater that the zone value, line deletes.
Bar Lookback = How many bars to look back to check the strength of the candle. Default gives the best result.
Max Demand and Supply zones and Show all active Demand and Supply zones = One can visually see played out ( violated ) zones by unticking the Active zones option.
Otherwise indicator will show only the Active zones.
One can see max of 100 violated zones .
PM us to obtain the access.

Fx Auto Supply and Demand [For Day Trading Only]Fx Auto Supply and Demand automatically plots important supply and demand levels for Forex day trading.

Demand Supply Zone IndicatorThe Demand Supply Zone indicator helps in identifying the Demand Supply zones on chart by pinpointing them. The indicator looks for patterns of Drop-Base-Rally and Rally-Base-Rally and when such pattern is available the indicator marks it as DZ ( Demand Zone ). Likewise, if the indicator finds a pattern of Rally-Base-Drop or Drop-Base-Drop the indicator marks it as SZ ( Supply Zone ). The basing candles are changed to Blue color and the Legout candle is changed to Black color.
The setting for legout strength can be customized as follows
1 – Good Legout Strength
1.5 – Strong Legout Strength
2 - Very Strong Legout Strength
The setting for number of candles in the basing can be customized from 1 to 6.
Use the link below to obtain access to this indicator.

Eric Smith Supply and Demand V3Supply Demand, look back limited for now until Tradingview supports arrays.
Demand and Supply Candles-openThis Script helps you identify the basing and explosive candles which can be used for Supply and Demand Analysis methodology
Blue Candle represents the Boring Candles ==> Demand and Supply is in balance
Black Candle represents the Exciting Candles ==> imbalance between Demand and Supply
If you are looking for automatic indicator for demand and supply zones, you will have to tradingview home page and in search bar drop down select people and in searchbox "ConfidentSelfTrader", then select SCRIPTS, then click on "Demand and Supply Zones indicator", scroll down and add it as your Favorite Scripts, then you can use "Demand and Supply Zones indicator" for free....
Supply and Demand ZonesSupply and Demand zones do offer a great insights into the structure of any market. If you have an idea of how to trade with support and resistance zones, you might find supply and demand zones very similar.
1. Focus on a price level (zone)
It’s difficult to analyze the market without a focal point. If you look for turning points at every price level, you will only find confusion.
How do you know which price level to focus on? Which price levels are potential market turning points?
2. Observe what happened (happens) at the potential support/resistance
Signs of strong demand
When the market tests a potential support, look out for:
Bullish price pattern
Inability to clear below the support
Increased volume
Congestion
Signs of strong supply
When the market tests a potential resistance, look out for:
Bearish price pattern
Inability to clear above the resistance
Increased volume
Congestion
Look for these price action signals in the past, as well as in real-time price action. The more signs you see, the more likely you’ve found a true support/resistance zone.