log.info() - 5 Exampleslog.info() is one of the most powerful tools in Pine Script that no one knows about. Whenever you code, you want to be able to debug, or find out why something isn’t working. The log.info() command will help you do that. Without it, creating more complex Pine Scripts becomes exponentially more difficult.
The first thing to note is that log.info() only displays strings. So, if you have a variable that is not a string, you must turn it into a string in order for log.info() to work. The way you do that is with the str.tostring() command. And remember, it's all lower case! You can throw in any numeric value (float, int, timestamp) into str.string() and it should work.
Next, in order to make your output intelligible, you may want to identify whatever value you are logging. For example, if an RSI value is 50, you don’t want a bunch of lines that just say “50”. You may want it to say “RSI = 50”.
To do that, you’ll have to use the concatenation operator. For example, if you have a variable called “rsi”, and its value is 50, then you would use the “+” concatenation symbol.
EXAMPLE 1
━━━━━━━━━━━━━━━━━━━━━━━━━━━━━━━━━
//@version=6
indicator("log.info()")
rsi = ta.rsi(close,14)
log.info(“RSI= ” + str.tostring(rsi))
Example Output =>
RSI= 50
Here, we use double quotes to create a string that contains the name of the variable, in this case “RSI = “, then we concatenate it with a stringified version of the variable, rsi.
Now that you know how to write a log, where do you view them? There isn’t a lot of documentation on it, and the link is not conveniently located.
Open up the “Pine Editor” tab at the bottom of any chart view, and you’ll see a “3 dot” button at the top right of the pane. Click that, and right above the “Help” menu item you’ll see “Pine logs”. Clicking that will open that to open a pane on the right of your browser - replacing whatever was in the right pane area before. This is where your log output will show up.
But, because you’re dealing with time series data, using the log.info() command without some type of condition will give you a fast moving stream of numbers that will be difficult to interpret. So, you may only want the output to show up once per bar, or only under specific conditions.
To have the output show up only after all computations have completed, you’ll need to use the barState.islast command. Remember, barState is camelCase, but islast is not!
EXAMPLE 2
━━━━━━━━━━━━━━━━━━━━━━━━━━━━━━━━━
//@version=6
indicator("log.info()")
rsi = ta.rsi(close,14)
if barState.islast
log.info("RSI=" + str.tostring(rsi))
plot(rsi)
However, this can be less than ideal, because you may want the value of the rsi variable on a particular bar, at a particular time, or under a specific chart condition. Let’s hit these one at a time.
In each of these cases, the built-in bar_index variable will come in handy. When debugging, I typically like to assign a variable “bix” to represent bar_index, and include it in the output.
So, if I want to see the rsi value when RSI crosses above 0.5, then I would have something like
EXAMPLE 3
━━━━━━━━━━━━━━━━━━━━━━━━━━━━━━━━━
//@version=6
indicator("log.info()")
rsi = ta.rsi(close,14)
bix = bar_index
rsiCrossedOver = ta.crossover(rsi,0.5)
if rsiCrossedOver
log.info("bix=" + str.tostring(bix) + " - RSI=" + str.tostring(rsi))
plot(rsi)
Example Output =>
bix=19964 - RSI=51.8449459867
bix=19972 - RSI=50.0975830828
bix=19983 - RSI=53.3529808079
bix=19985 - RSI=53.1595745146
bix=19999 - RSI=66.6466337654
bix=20001 - RSI=52.2191767466
Here, we see that the output only appears when the condition is met.
A useful thing to know is that if you want to limit the number of decimal places, then you would use the command str.tostring(rsi,”#.##”), which tells the interpreter that the format of the number should only be 2 decimal places. Or you could round the rsi variable with a command like rsi2 = math.round(rsi*100)/100 . In either case you’re output would look like:
bix=19964 - RSI=51.84
bix=19972 - RSI=50.1
bix=19983 - RSI=53.35
bix=19985 - RSI=53.16
bix=19999 - RSI=66.65
bix=20001 - RSI=52.22
This would decrease the amount of memory that’s being used to display your variable’s values, which can become a limitation for the log.info() command. It only allows 4096 characters per line, so when you get to trying to output arrays (which is another cool feature), you’ll have to keep that in mind.
Another thing to note is that log output is always preceded by a timestamp, but for the sake of brevity, I’m not including those in the output examples.
If you wanted to only output a value after the chart was fully loaded, that’s when barState.islast command comes in. Under this condition, only one line of output is created per tick update — AFTER the chart has finished loading. For example, if you only want to see what the the current bar_index and rsi values are, without filling up your log window with everything that happens before, then you could use the following code:
EXAMPLE 4
━━━━━━━━━━━━━━━━━━━━━━━━━━━━━━━━━
//@version=6
indicator("log.info()")
rsi = ta.rsi(close,14)
bix = bar_index
if barstate.islast
log.info("bix=" + str.tostring(bix) + " - RSI=" + str.tostring(rsi))
Example Output =>
bix=20203 - RSI=53.1103309071
This value would keep updating after every new bar tick.
The log.info() command is a huge help in creating new scripts, however, it does have its limitations. As mentioned earlier, only 4096 characters are allowed per line. So, although you can use log.info() to output arrays, you have to be aware of how many characters that array will use.
The following code DOES NOT WORK! And, the only way you can find out why will be the red exclamation point next to the name of the indicator. That, and nothing will show up on the chart, or in the logs.
// CODE DOESN’T WORK
//@version=6
indicator("MW - log.info()")
var array rsi_arr = array.new()
rsi = ta.rsi(close,14)
bix = bar_index
rsiCrossedOver = ta.crossover(rsi,50)
if rsiCrossedOver
array.push(rsi_arr, rsi)
if barstate.islast
log.info("rsi_arr:" + str.tostring(rsi_arr))
log.info("bix=" + str.tostring(bix) + " - RSI=" + str.tostring(rsi))
plot(rsi)
// No code errors, but will not compile because too much is being written to the logs.
However, after putting some time restrictions in with the i_startTime and i_endTime user input variables, and creating a dateFilter variable to use in the conditions, I can limit the size of the final array. So, the following code does work.
EXAMPLE 5
━━━━━━━━━━━━━━━━━━━━━━━━━━━━━━━━━
// CODE DOES WORK
//@version=6
indicator("MW - log.info()")
i_startTime = input.time(title="Start", defval=timestamp("01 Jan 2025 13:30 +0000"))
i_endTime = input.time(title="End", defval=timestamp("1 Jan 2099 19:30 +0000"))
var array rsi_arr = array.new()
dateFilter = time >= i_startTime and time <= i_endTime
rsi = ta.rsi(close,14)
bix = bar_index
rsiCrossedOver = ta.crossover(rsi,50) and dateFilter // <== The dateFilter condition keeps the array from getting too big
if rsiCrossedOver
array.push(rsi_arr, rsi)
if barstate.islast
log.info("rsi_arr:" + str.tostring(rsi_arr))
log.info("bix=" + str.tostring(bix) + " - RSI=" + str.tostring(rsi))
plot(rsi)
Example Output =>
rsi_arr:
bix=20210 - RSI=56.9030578034
Of course, if you restrict the decimal places by using the rounding the rsi value with something like rsiRounded = math.round(rsi * 100) / 100 , then you can further reduce the size of your array. In this case the output may look something like:
Example Output =>
rsi_arr:
bix=20210 - RSI=55.6947486019
This will give your code a little breathing room.
In a nutshell, I was coding for over a year trying to debug by pushing output to labels, tables, and using libraries that cluttered up my code. Once I was able to debug with log.info() it was a game changer. I was able to start building much more advanced scripts. Hopefully, this will help you on your journey as well.
Debug

bar_index inspectorThis is a tool for developers who are working with index based plots and find themselves adding the bar_index to their indicators on a regular basis during development and debugging.
What it does:
shows the bar_index in the status line and data window.
plots optional labels (bar index + time) into the chart every 10 bars

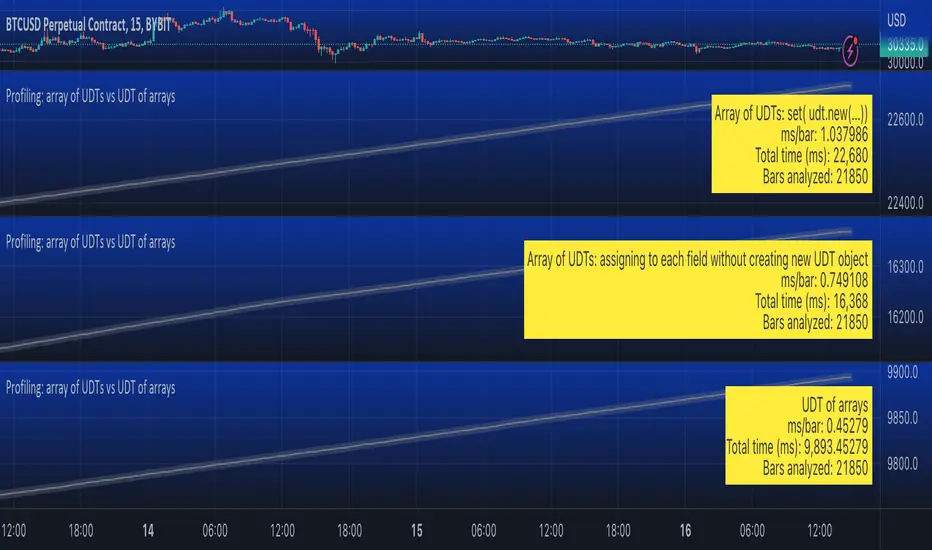
Profiling: array of UDTs vs UDT of arraysUsing Stopwatch Library by PineCoders, I am trying to test which is faster, an array of user-defined type (UDT) objects vs an object with many child arrays.
The task is to store and manipulate array of objects having total 9 values: 4 floats, 4 strings and 1 int.
Option 1: create a UDT with 9 fields and store an array of such UDT objects.
Option 2: create a UDT with 9 arrays individually for each value.
The test task is of three stages:
Populate array(s) with some (timenow) values - in the options you can choose how many values to push into the array/arrays. Note that max size of array(s) is set independently, so you can push 1000 of elements into an array capped at 100 max size and as new elements will be pushed (added to the end) the old exceeding elements will be shifted (removed from the beginning)
Write - write to random elements of the array. Two options for writing to a UDT object: (1) assign to each field independently, (2) create a UDT object and use array.set() function.
Read - read from random elements of the array.
In the options you can how many times per bar to run each of the steps (same number for each step).
I tested by adding three indicators to the chart and choosing different options for each:
1. Array of UDT's where writing is done by creating a new UDT from the values and then using set(udt)
2. Array of UDT's where writing is done by assigning the value of each of the properties of the UDT individually (saving time on creating of a new object).
3. UDT of arrays.
As of 16 Arpil 2023 the UDT of arrays seems about 20-30% faster than the array of UDT's with setting each property without creating new UDT object.
HTF Bars Discrepancy Detector (for debugging)Illustrate discrepancies between two symbols of the same higher timeframe.
Sometimes:
- HTF data can come for one symbol but not for another
- or come with gaps (e.g. after HTF bar 3 in the next chart TF's candle we have HTF bar 5 for one or both symbols)

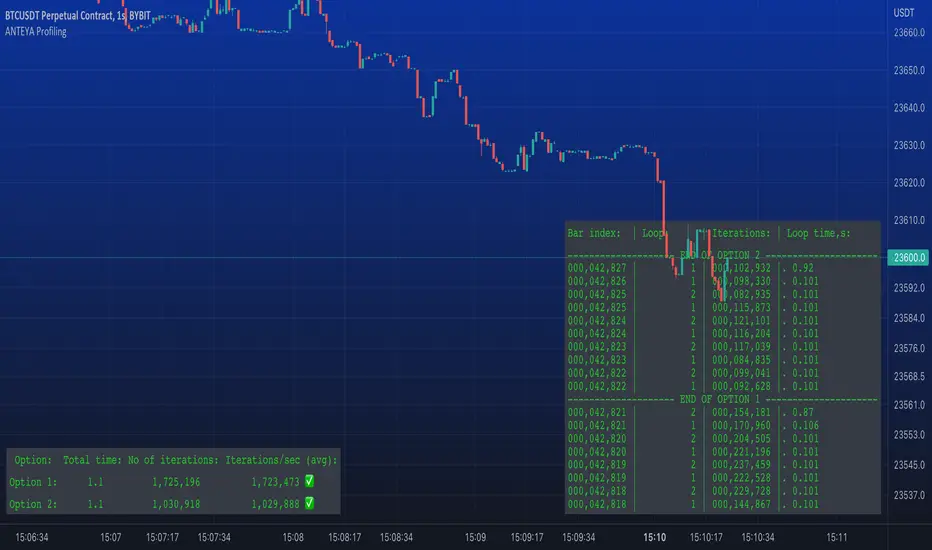
ANTEYA ProfilingThis script allows to compare which code is more efficient by running it inside a loop for a certain time or a certain number of iterations.
Just paste your pieces of code as Option 1 and Option 2 inside the loop (see comments in the script).
Signal ViewerThe "Signal Viewer" script is a debugging tool that can be used for the signal of a Signal Indicator script like the "Two MA Signal Indicator" or the "Template Signal Indicator". This script will visualize the signal based on the convention that was defined in the settings. Also, alerts will be produced based on this convention. It's useful to be used before you connect the signal indicator script to a template strategy like the "Template Trailing Strategy" script. You can cross-validate the correctness of the signal that the indicators emit and make sure it is aligned with the expected behavior after the decomposition of the signal using the convention described in the settings. Please make sure that the connection in the "Signal Viewer" script matches the convention used by the template strategy script.

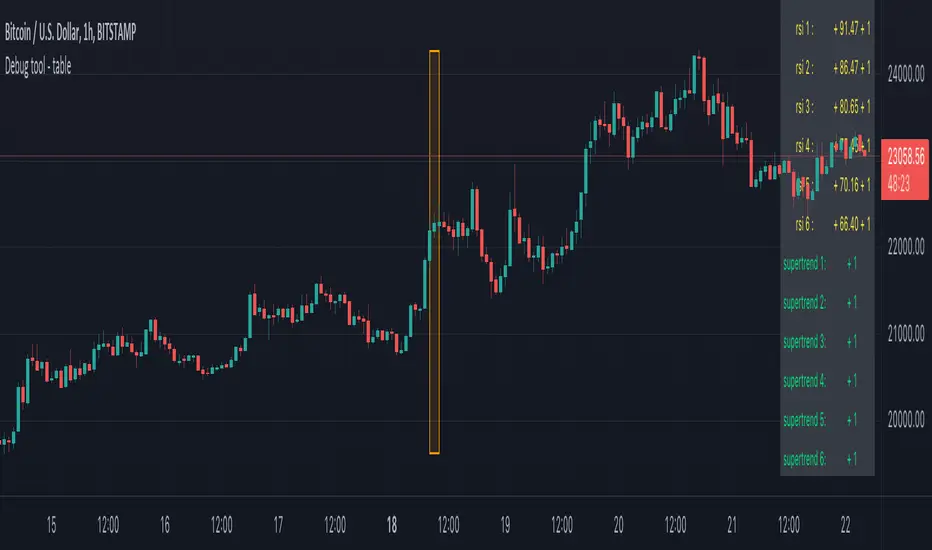
Debug tool - tableWhen having a script with lot's of values, it can be difficult to seek the values you need to debug
For example, here, multiple values aren't visible anymore (right side chart)
————————————————————————————————————————————————————————————————
This script show a way where you can show the values in a table on 1 particular bar, with 2 options:
1)
'middle' -> here the script uses chart.left_visible_bar_time and chart.right_visible_bar_time to calculate the middle
the values of that bar (in orange box) is shown, you can check the value by putting your mouse cursor on that bar:
Just zooming in/out, or scrolling through history will automatically show you the middle and the values of that bar.
Using the arrows on your keyboard will allow you to go 1 bar further/back each time.
(Give it some time to load though, also, sometimes you need to click anywhere on the chart before arrows start working)
2)
'time' -> settings -> Date -> the orange bar will be placed on the chosen bar, the values will be placed in the table as well.
————————————————————————————————————————————————————————————————
If the table interfere with the candles, you can alter the position without changing the placement of the orange bar -> settings -> position table
This script holds lots of values, just to show the difference between values placed on the chart, and values, placed in the table.
To make more clear how the script works, an 'example' (v_rsi1 / rsi1) is highlighted in the code itself
Cheers!
Simple debug functionSimple method I used to debug problem in my script.
For loop generates 5 numbers from the given depth. At present, depth is 9
Rules for generating the combinations are as follows:
First number is always 1
Two even numbers should not be adjacent to each other and two odd numbers should not be adjacent to each other
Numbers should be ordered in incremental order.
Print all possible combinations
While the logic above is just a random one. Debug method can be reused for any program.
Logging in Pine ScriptI'm building quite a lot of pretty complicated indicators/strategies in Pine Script. Quite often they don't work from the 1 try so I have to debug them heavily.
In Pine Script there are no fancy debuggers so you have to be creative. You can plot values on your screens, check them in the data window, etc.
If you want to display some textual information, you can plot some info as labels on the screen.
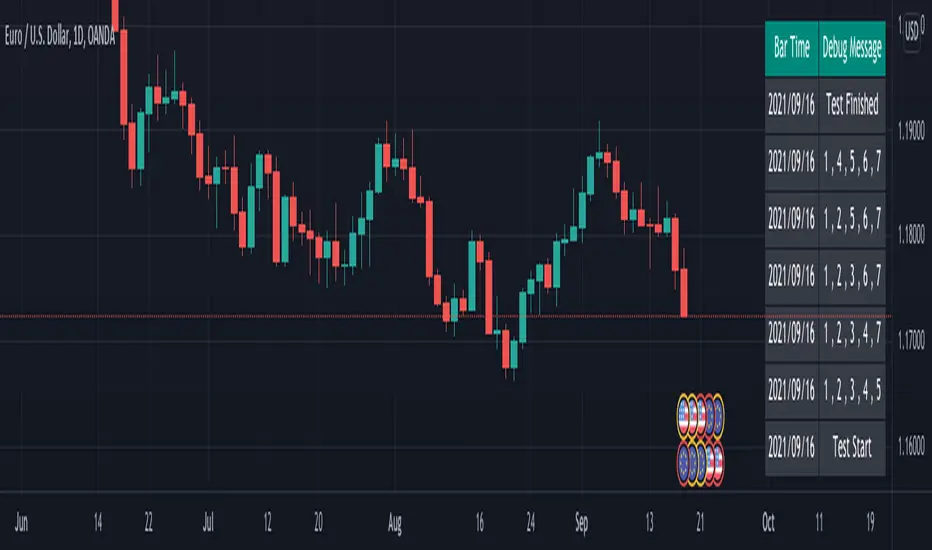
It's not the most convenient way, so with the appearance of tables in Pine Script, I decided to implement a custom logger that will allow me to track some useful information about my indicator over time.
Tables work much better for this kind of thing than labels. They're attached to your screen, you can nicely scale them and you can style them much better.
The idea behind it is very simple. I used few arrays to store the message, bar number, timestamp, and type of the message (you can color messages depend on the type for example).
There is a function log_msg that just append new messages to these arrays.
In the end, for the last bar, I create the table and display the last X messages in it.
In parameters, you can show/hide the entire journal, change the number of messages displayed and choose an offset. With offset, you can basically scroll through the history of messages.
Currently, I implemented 3 types of messages, and I color messages according to these types:
Message - gray
Warning - yellow
Error - red
Of course, it's a pretty simple example, you can create a much fancier way of styling your logs.
What do you think about it? Is it useful for you? What do you use to debug code in Pine Script?
Disclaimer
Please remember that past performance may not be indicative of future results.
Due to various factors, including changing market conditions, the strategy may no longer perform as good as in historical backtesting.
This post and the script don’t provide any financial advice.

