Friday Statistical Zones - Last 30 Fridays Only BTC 📊 Friday Statistical Zones (Pre / Dump / After)
This indicator highlights statistical risk zones for Fridays, based on the last 30 completed Fridays.
It analyzes historical price and volume behavior to determine:
• When a Pre-Dump phase typically starts
• When selling pressure statistically peaks
• When the After-Dump phase usually occurs
The result is a time-based overlay with three zones:
🟡 Pre-Dump · 🔴 Dump · 🟡 After-Dump
⚠️ This is not a signal indicator.
It does not predict price direction.
It provides risk-timing context only.
Best used for risk management and situational awareness on Fridays, not as a standalone trading strategy.
วัฏจักร

PIT Magic IndicatorDPOC (Developing Point of Control) is the price level where the most trading volume has occurred so far in the current session, and it moves as new volume comes in, often acting like a short-term magnet for price.
WPOC (Weekly Point of Control) is the price level with the highest traded volume for the entire week, commonly acting as a strong reference point where price may pause, reverse, or consolidate.
Support is a price zone where buying interest is strong enough to stop or slow down a decline, often causing price to bounce upward.
Resistance is a price zone where selling pressure tends to overpower buying, frequently preventing price from moving higher and causing pullbacks.

BTC Gann Harmonics Weighted + Phase + EMA OptimizedBTC Gann Harmonics Weighted + Phase + EMA Optimized

QT-Cycles-Clear-View(Theory by DAYE)Quarter Theory – Short Summary
each cycle is segmented into four sequential quarters (Q1–Q4).
Each quarter reflects a distinct phase of liquidity, volatility, and participant behavior.
The theory focuses on when price is likely to move, rather than predicting direction.
Implemented Cycles
W.C (Weekly Cycle) – Day-to-day quarters on the 1H chart
D.C (Daily Cycle) – 6-hour quarters on the 15-minute chart
90M Cycle – Quarters within each 90-minute period
Micro Cycle – Short-term quarters within 23-minute cycles
/ Theory © DAYE
// Indicator implementation by M.A
// All rights to the original theory belong to DAYE.
// This script is an independent implementation.

BTC - Metcalfes Law (Deviation)Title: BTC – Metcalfe's Law (Deviation) | RM
Overview & Philosophy
The BTC – Metcalfe's Law (Deviation) is a fundamental valuation oscillator that answers one of the most important questions in network economics: "Is the current price justified by the number of active users?" Metcalfe's Law states that the value of a network is proportional to the square of the number of its connected users (Value = Users squared). In the context of Bitcoin, this means that as the number of active addresses grows linearly, the network's fair value should grow exponentially.This script identifies periods where Bitcoin’s market capitalization has become "overextended" or "undervalued" relative to its actual network activity.
Methodology
The indicator performs a rolling log-log regression (Ordinary Least Squares) between Bitcoin's Market Cap and its Active Address count over a 730-day (2-year) window.
1. The Regression: The script calculates the statistical relationship: ln(Market Cap) = alpha + beta * ln(Active Addresses)
2. Pure Metcalfe vs. Generalized Metcalfe:
• Pure Metcalfe (Beta=2): By default, the script enforces a slope of 2.0, adhering to the classic mathematical law.
• Dynamic Fit: Users can disable the "Enforce Metcalfe" setting to let the model find the best historical fit (often resulting in a Beta between 1.5 and 1.8).
3. The Deviation (The Signal):
The resulting line represents the Log-Deviation from Fair Value.
• A value of 0.0 means Bitcoin is priced exactly according to its network utility.
• Positive values indicate a "valuation premium".
• Negative values indicate a "valuation discount".
How to Read the Chart
🔴 The Red Zone (Overvaluation > 1.0)
Meaning: The Market Cap has outpaced the growth of active users. Historically, these peaks represent speculative bubbles or cycle tops where price is driven by hype rather than utility.
🟢 The Green Zone (Undervaluation < -0.25)
Meaning: The network is being utilized, but the price has crashed below its fundamental support. Historically, these "Utility Floors" have marked the most profitable accumulation zones in Bitcoin’s history.
🟠 The Orange Line (Fair Value Transition)
Meaning: The market is in a healthy growth phase, moving in lockstep with user adoption.
Strategy & Interpretation
This tool is a Macro Compass . It is designed to help investors stay objective during periods of extreme market emotion.
• In a Bull Market: Watch for the deviation to hit the Red Zone. This is your signal that the "Network Utility" can no longer support the price, and a major correction is likely imminent.
• In a Bear Market: Look for the "Green Floor." When the price stays below the -0.25 level despite stable user activity, it suggests a massive mismatch between value and price—a classic buy signal.
Settings
• Regression Window (Default: 730 Days): Chosen to capture mid-to-long term cycle trends. Adjust to shorter timeframes for more dynamic behavior or longer timeframes (like 1460 Days) to catch longer cycles.
• Enforce Metcalfe: Toggle between the classic law (Beta=2) and a dynamic fit.
• Smoothing: A 30-day SMA is applied to active addresses to filter out daily "jitter."
Credits
• Robert Metcalfe: For the original law of network utility.
• Willy Woo & Greg Wheatley: For their pioneering work in applying Metcalfe's Law specifically to Bitcoin's valuation.
Important Data Requirement
To function, this indicator requires a data feed for Active Addresses . By default, it is set to GLASSNODE:BTC_ACTIVEADDRESSES . Please Note: On-chain data usually requires a premium vendor subscription on TradingView (e.g., Glassnode, IntoTheBlock, or CryptoQuant). If you do not have a subscription, the indicator will display a "Missing Data" warning.
⚠️ Note: This indicator is optimized for the Daily (1D) Timeframe. Please switch your chart to 1D for accurate signal reading.
Disclaimer
This script is for research and educational purposes only. It relies on third-party on-chain data. Fundamental valuation is only one piece of the puzzle; market dynamics can remain irrational longer than metrics can predict.
Tags
bitcoin, btc, on-chain, metcalfe, adoption, fundamental, valuation, active addresses, cycle, Rob Maths

Sistema Neutro GOULART HUD Regime Radar ORB VWAPSistema Neutro GOULART is an advanced visual trading indicator that integrates:
• A unified HUD displaying session status, ORB, VWAP, risk and market bias
• A Regime Radar heatmap (GO / WAIT / NO) designed to provide clarity without chart clutter
• ORB with straight daily lines and a clean zone limited to the current session
• Direction filtering using VWAP and VWAP slope
• Condition assessment based on risk and overall market context
• A harmonized visual design focused on objective decision-making
⚠️ This indicator does NOT generate trade signals.
It provides market context, regime classification, and quality assessment to support discretionary trading decisions.
Ideal for:
• Futures markets (ES, NQ, YM)
• Day trading using ORB + VWAP
• Traders who prioritize context, discipline, and structure over signals
For educational purposes only.

TSS by AMAGADONTSS - THE SESSION SETUP
The Methodology
THE SESSION SETUP (TSS) is a price-action framework that utilizes session-specific volatility to define intraday expansion zones. By isolating the opening ranges of the Asia, London, and New York sessions on the 15-minute (M15) timeframe, TSS identifies clear institutional "interest zones."
The algorithm monitors these ranges for two specific price-action events:
Primary Breakouts: Decisive candle closes outside the session boundaries.
Liquidity Reversals (Counter-Signals): Identification of "fake-outs" where price traps initial breakout traders before reversing through the entire session range.
Features
Automated Session Boxes: Dynamic range calculation for all major global sessions.
Precision TP Levels: Systematic profit targets based on the measured session range (R).
Timeframe Integrity: Built-in guard to ensure the logic is only applied to the M15 timeframe, preserving the accuracy of the range calculations.
Visual Median: Dotted mid-lines to identify the "mean" price within a session.
CRITICAL DISCLOSURE - PLEASE READ CAREFULLY
HIGH RISK INVESTMENT WARNING: Trading Foreign Exchange (Forex) is highly speculative, carries a high level of risk, and may not be suitable for all investors. You may sustain a loss of some or all of your invested capital; therefore, you should not speculate with capital that you cannot afford to lose. NO FINANCIAL ADVICE: The TSS - THE SESSION SETUP indicator is a technical analysis tool provided for informational and educational purposes only. It does not constitute investment advice, financial advice, or a recommendation to buy or sell any currency pair or financial instrument.
LIMITATION OF LIABILITY:
Execution Risk: The author does not guarantee the accuracy of signals. Market conditions, including news-driven volatility, spreads, and slippage, can result in trades that differ significantly from the indicator's visual signals.
Backtesting Limitation: Past performance and historical signals are not indicative of future results.
User Responsibility: You are solely responsible for your trading decisions. The author of this script shall not be held liable for any loss or damage, including without limitation, any loss of profit, which may arise directly or indirectly from the use of or reliance on this tool.
BY USING THIS SCRIPT, YOU AGREE THAT YOU ARE TRADING AT YOUR OWN RISK.

Americana Crypto Retail FOMO IndexRetail FOMO Index
Overview
The Retail FOMO Index is a sentiment indicator designed to help identify when retail investors are piling into the crypto market — often a sign that the market may be approaching overheated conditions. Historically, periods of extreme retail enthusiasm have coincided with local and macro tops, making this a useful tool for gauging market temperature.
What It Measures
This indicator combines two real-time data sources to create a composite "FOMO score" scaled from 0 to 100:
Coinbase Premium (50% weight)
This measures the price difference between Bitcoin on Coinbase (USD) and Binance (USDT). When US retail investors are aggressively buying, Coinbase often trades at a premium to other exchanges. A rising premium suggests increased retail demand, while a negative premium can indicate selling pressure or reduced interest.
Coinbase Stock Volume (50% weight)
This tracks the trading volume of COIN (Coinbase's stock on NASDAQ) relative to its recent average. When retail interest in crypto surges, Coinbase stock volume tends to spike as both crypto traders and traditional investors react to market momentum. The indicator calculates a Z-score to identify when volume is unusually high or low compared to its norm.
Settings
The indicator includes adjustable parameters:
Weights: Adjust the balance between Coinbase Premium and COIN Volume if you find one component more relevant
Lookback Period: Controls how much historical data is used for normalization (default: 50 periods)
Smoothing: Reduces noise in the final output (default: 7 periods)
Threshold Levels: Customize the boundaries for each zone
Display Options: Toggle component lines and background fills on/off
Important Notes
The COIN volume data begins in April 2021 (Coinbase IPO), so the indicator does not have data prior to that date
The Coinbase Premium is calculated using BTC regardless of what asset chart you apply it to — BTC tends to be the leading indicator for broad retail sentiment
This indicator works best on daily, weekly, and monthly timeframes
This is a sentiment tool, not a trade signal — use it alongside your existing analysis to add context

Koma-Indikator v2272,19
USD
+0,35
+0,13%
Apple, Inc. engages in the design, manufacture, and sale of smartphones, personal computers, tablets, wearables and accessories, and other varieties of related services. It operates through the following geographical segments: Americas, Europe, Greater China, Japan, and Rest of Asia Pacific. The Americas segment includes North and South America. The Europe segment consists of European countries, as well as India, the Middle East, and Africa. The Greater China segment comprises China, Hong Kong, and Taiwan. The Rest of Asia Pacific segment includes Australia and Asian countries. Its products and services include iPhone, Mac, iPad, AirPods, Apple TV, Apple Watch, Beats products, AppleCare, iCloud, digital content stores, streaming, and licensing services. The company was founded by Steven Paul Jobs, Ronald Gerald Wayne, and Stephen G. Wozniak in April 1976 and is headquartered in Cupertino, CA.
Es sind noch 14 Min. für die Script-Bearbeitung übrig
in dieser Minute
Koma-Indikator v2
Zu Favoriten hinzufügen
Auf Chart verwenden
0
0
Functional Overview: Koma-Indikator V2
This indicator is a specialized analytical tool for Smart Money Concepts (SMC) trading. It is designed to automatically identify trend reversals, liquidity pools, and order flow shifts within the chart.
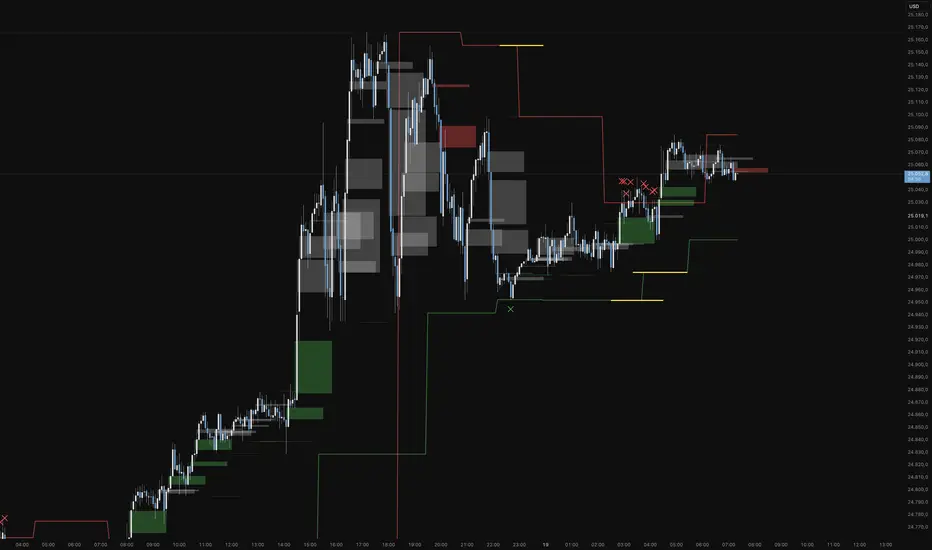
1. Liquidity Identification (BSL/SSL)
Major Range: The script automatically calculates significant highs and lows based on the "Major Lookback" period.
Buy-Side & Sell-Side Liquidity: These levels are plotted as red (BSL) and green (SSL) lines, serving as primary targets where the market often "hunts" for liquidity.
2. Sweep Detection (Liquidity Grabs)
The indicator detects when the price briefly exceeds a major high or low but closes back within the range.
Visuals: These potential reversal points are marked with an "X" icon above or below the candle (Sweep H/L).
3. Automated Market Structure Shifts (MSS)
The core logic tracks direction changes on two distinct levels:
Major MSS (Bold Yellow Line): Signals a significant trend reversal following a liquidity sweep. This is the primary confirmation for a new trend.
Minor MSS (Dotted Yellow Line): Highlights smaller structural breaks within a trend—ideal for aggressive "Sniper" entries on lower timeframes.
4. Dynamic Fair Value Gaps (FVG) & iFVGs
FVG Recognition: The indicator automatically draws boxes for bullish (green) and bearish (red) price imbalances.
Change in Delivery (iFVG): When a price candle closes through an existing FVG box, the box turns gray. This signals an Inverted FVG (iFVG), indicating that the order flow has officially shifted in the new direction.
5. Customization (Inputs)
Sensitivity: Users can adjust the lookback periods for both Trend (Major) and Entries (Minor) to suit different assets or timeframes.
Visual Hierarchy: All colors, line widths, and box lengths are configurable to maintain a clean and professional chart layout.
Trading Application:
By automating the "grunt work" of structural analysis, this tool allows you to focus on the trade execution:
Locate Liquidity: Identify BSL/SSL lines.
Watch for the Sweep: Look for the "X" marks.
Confirm the Shift: Wait for the yellow MSS lines.
Execute via Order Flow: Use the gray iFVG boxes as your Point of Interest (POI).
Geschütztes Skript
Dieses Script ist als Closed-Source veröffentlicht. Sie können es kostenlos und ohne Einschränkungen verwenden – erfahren Sie hier mehr.
Phantomas1
Haftungsausschluss
Die Informationen und Veröffentlichungen sind nicht als Finanz-, Anlage-, Handels- oder andere Arten von Ratschlägen oder Empfehlungen gedacht, die von TradingView bereitgestellt oder gebilligt werden, und stellen diese nicht dar. Lesen Sie mehr in den Nutzungsbedingungen.
Skript bearbeiten
Minimieren
Schließen
Koma-Indikator v2
Functional Overview: Koma-Indikator V2
This indicator is a specialized analytical tool for Smart Money Concepts (SMC) trading. It is designed to automatically identify trend reversals, liquidity pools, and order flow shifts within the chart.
1. Liquidity Identification (BSL/SSL)
Major Range: The script automatically calculates significant highs and lows based on the "Major Lookback" period.
Buy-Side & Sell-Side Liquidity: These levels are plotted as red (BSL) and green (SSL) lines, serving as primary targets where the market often "hunts" for liquidity.
2. Sweep Detection (Liquidity Grabs)
The indicator detects when the price briefly exceeds a major high or low but closes back within the range.
Visuals: These potential reversal points are marked with an "X" icon above or below the candle (Sweep H/L).
3. Automated Market Structure Shifts (MSS)
The core logic tracks direction changes on two distinct levels:
Major MSS (Bold Yellow Line): Signals a significant trend reversal following a liquidity sweep. This is the primary confirmation for a new trend.
Minor MSS (Dotted Yellow Line): Highlights smaller structural breaks within a trend—ideal for aggressive "Sniper" entries on lower timeframes.
4. Dynamic Fair Value Gaps (FVG) & iFVGs
FVG Recognition: The indicator automatically draws boxes for bullish (green) and bearish (red) price imbalances.
Change in Delivery (iFVG): When a price candle closes through an existing FVG box, the box turns gray. This signals an Inverted FVG (iFVG), indicating that the order flow has officially shifted in the new direction.
5. Customization (Inputs)
Sensitivity: Users can adjust the lookback periods for both Trend (Major) and Entries (Minor) to suit different assets or timeframes.
Visual Hierarchy: All colors, line widths, and box lengths are configurable to maintain a clean and professional chart layout.
Trading Application:
By automating the "grunt work" of structural analysis, this tool allows you to focus on the trade execution:
Locate Liquidity: Identify BSL/SSL lines.
Watch for the Sweep: Look for the "X" marks.
Confirm the Shift: Wait for the yellow MSS lines.
Execute via Order Flow: Use the gray iFVG boxes as your Point of Interest (POI).
Fortfahren
34L0TINV327INGEMA CISD HTF Confirmation is a visual TradingView indicator designed to support structured, rule-based market analysis using EMA alignment and CISD-style confirmation. The indicator highlights higher-timeframe bias and momentum conditions to help traders follow predefined rules and reduce discretionary decision-making.
This tool is intended for analytical and educational purposes only. It does not provide trade signals, predictions, or guarantees. Access is provided on an invite-only basis.

Momentum & Breakout Confirmationwatch momentum build in real time on the current candle so you can confirm weather a breakout is indeed a breakout or will be a fake out. This is what it does
This is a Momentum & Breakout Confirmation (MBC) indicator that analyzes the current candle in real-time to determine if it's a strong continuation move or possible reversal. Here's the breakdown:
What It Measures:
Momentum Strength - How much % the candle moved:
STRONG = >0.5% move
MEDIUM = 0.2-0.5%
WEAK = <0.2%
Direction - Simply bullish (green candle) or bearish (red candle)
Four Confirmation Factors:
Volume Surge - Is volume 1.5x above the 20-period average?
Move Size - Is the candle body larger than 0.5x ATR (significant)?
Body Strength - Is the body >60% of total candle range (strong conviction, minimal wicks)?
Trend Aligned - Does it align with 9/21 MA trend direction?
The Scoring System:
Adds 1 point for each confirmation factor met (max 4 points)
3-4 points = "STRONG CONTINUATION" 🚀
2 points = "LIKELY CONTINUATION"
1 point = "WEAK SIGNAL"
0 points = "POSSIBLE REVERSAL" ⚠️
Key Difference from TPC:
TPC uses multi-timeframe SuperTrend for strategic entries
MBC focuses on the current candle only - it's asking "Is THIS candle showing real momentum or is it weak/fake?"
Practical Use:
Great for confirming if a breakout or move is "real" with strong conviction behind it, or if it's low-volume/weak-bodied and likely to fail. The table updates live so you can watch momentum build during the candle formation.
Hope it helps. if you guys have any ideas for any indicators you want made please feel free to dm me as i like a good challenge lol ill sit here and try to code anything now im not saying i will be 100 percent successful but i will try for you, thanks for all the support from all you guys i def do appreciate it.

Wyckoff PRO Institutional🔹 Wyckoff NTA – Institutional Context Engine
Institutional Market Context Based on Wyckoff Methodology
📌 Overview
Wyckoff NTA – Institutional Context Engine is a public, closed-source analytical script developed by NexTrade Academy, designed to identify and quantify the true institutional market context using classic Wyckoff methodology adapted into a modern algorithmic framework.
This script is NOT a signal system and does not provide precise entry or exit points.
Its purpose is to function as a context engine, helping traders understand WHEN the market is operable and IN WHICH DIRECTION it is statistically reasonable to look for opportunities.
🧠 Methodology & Conceptual Framework
Wyckoff NTA evaluates the combined behavior of price, volume, and volatility, following the core principles of the Wyckoff method to interpret institutional intent behind market movements.
The script analyzes market conditions through the following conceptual components:
1️⃣ Wyckoff Phase Identification
The indicator classifies the current market environment into the main institutional Wyckoff phases:
Accumulation
Distribution
Markup
Markdown
Reaccumulation
Redistribution
These phases describe where the market is within its cycle, not where to trade.
2️⃣ Institutional Intent Event Detection
Wyckoff NTA detects key events associated with Wyckoff methodology, such as:
Spring
Upthrust
Sign of Strength (SOS)
Sign of Weakness (SOW)
These events are treated as contextual confirmations, not standalone trade signals.
3️⃣ Market Operability Assessment
The script evaluates whether current conditions are operable or non-operable, based on the relationship between:
Structural development
Participation (volume behavior)
Price efficiency and volatility
This process filters out:
Low-intent environments
Transitional phases
Low-probability market conditions
🔢 Wyckoff Dynamic Score (0–100)
All evaluated components are aggregated into a Wyckoff Dynamic Score, which summarizes the quality of the current market context:
Below 40 → Non-operable context
40 to 60 → Weak context (A+ setups only)
60 to 80 → Operable context
Above 80 → Strong institutional context
This score does not trigger trades.
It is designed to enable or block decisions within a defined trading plan.
🎨 Visualization Modes
Wyckoff NTA includes multiple visualization modes to support different use cases:
DESK → Professional execution (minimal, no visual noise)
PRO → Active trading with enhanced visual context
EDU → Educational and learning-focused analysis
Each mode prioritizes clarity, objectivity, and controlled information density.
🎯 Intended Use
This script is designed for:
Institutional and advanced discretionary traders
Market Structure and Smart Money approaches
Swing and intraday trading
Contextual trade filtering and bias validation
Integration with execution systems such as NTC (NexTrade Concept)
It should always be used alongside:
A defined execution model
Proper risk management
Trading discipline
⚠️ Important Disclaimer
❌ No performance guarantees
❌ Not an automated trading system
❌ Does not constitute investment advice
✅ Contextual analytical tool only
All trading decisions remain the sole responsibility of the user.
🏷️ Credits
Developed by NexTrade Academy
Institutional Trading · Market Structure · Context First
Educational and professional analytical tool
Use at your own risk

Breakout PRO (B:Pro)Breakout PRO (B:Pro) is an invite-only, multi-filter breakout and trend suite for discretionary trading on any symbol and timeframe. It combines a custom EMA cloud, volatility and momentum filters, higher-timeframe bias, and signal quality scoring into a single framework, so there is no need to stack multiple separate indicators.
Core concept
The script builds a three-layer EMA cloud around price. The relative position of fast, mid, and slow EMAs, plus an ATR-based outer padding, defines:
Bull regime: EMAs bullishly stacked, cloud acting as dynamic support
Bear regime: EMAs bearishly stacked, cloud acting as dynamic resistance
Neutral regime: mixed or crossing EMAs, cloud fades to a neutral color
The cloud defines both the primary trend context and the breakout zones (cloud upper / cloud lower).
A higher-timeframe 200 EMA (user-defined timeframe) adds a long-term directional bias on top.
Support, resistance and structure
Last confirmed swing high and swing low are detected via pivot logic and drawn as dotted support / resistance lines.
These levels are invalidated with a small ATR buffer once price clearly breaks through.
Optional long-term EMA targets (T1 and T2, default 233 and 377) are plotted as future target lines, which can act as potential mean-reversion or trend-continuation objectives.
Filters used in entries
Long and short breakout signals are only shown when multiple, independent conditions align. Each filter can be turned on or off:
Volume: current volume vs volume SMA
MACD: line direction and histogram momentum
RSI: classic OB/OS behavior with sentiment-adjusted thresholds
Stoch RSI: K vs D direction inside valid zones
Bollinger Bands + Keltner Channels: squeeze state and BB breakouts
VWAP: price relative to intraday VWAP
ADX: minimum trend strength threshold
OBV & Ichimoku: optional extra trend confirmation layers
A dedicated Market Sentiment input (Standard, Bullish, Bearish, Consolidation) shifts RSI bands, ADX threshold, and volume requirements so the same logic adapts to different market conditions.
Signals and exits
Entry logic
Long signal: bullish EMA stack, breakout above the last pivot resistance and above the upper cloud, with all enabled long filters confirming.
Short signal: mirrored conditions below the last support pivot and below the lower cloud, with all enabled short filters confirming.
The script internally tracks trade state:
Sets an ATR-based stop level at entry, with mode-dependent ATR multipliers (Short / Mid / Long).
Applies an optional maximum trade duration (different per trade mode).
Plots exit markers when:
the ATR stop is hit
the cloud / EMA structure flips against the trade
MACD or RSI move against the position
or the time limit for the trade is exceeded
Additional icons highlight:
Strong breakouts / breakdowns with large ATR range and high volume
Squeeze releases after low-volatility phases
EMA cross events
Continuation and potential reversal zones around the cloud
Optional RSI divergence arrows based on a separate, mode-tuned RSI.
Quality and safety scoring
Every entry is evaluated on two simple scales (1–3):
Safety score (1–3): driven mainly by volume confirmation, ADX trend strength, distance from the cloud / structure, and overall trend alignment.
Quality score (1–3): reflects BB and MACD confirmation, RSI position, rough reward-to-risk context, and alignment with the selected Market Sentiment.
You can:
Show compact S/Q labels directly next to entry and exit signals.
Use the fixed signal history panel in the bottom-left corner to see the last 5 trade events (opens, closes, crosses, continuation) with their safety and quality scores.
Inputs and layout options
Key configurable inputs include:
Trade Mode: Short (e.g., 30m), Mid (e.g., 4h), Long (e.g., 1D+). This adjusts all core lengths (EMAs, ATR, divergence RSI).
Market Sentiment: Standard, Bullish, Bearish, Consolidation (dynamically retunes filters).
Per-filter toggles for Volume, MACD, RSI, Stoch RSI, BB, Ichimoku, ADX, OBV, VWAP, and HTF levels.
Panel size: Desktop, Phone, or None for the signal history panel.
Side labels: Desktop (full text labels on the price scale) or Phone (compact labels) for better chart space on smaller screens.
Usage notes
Breakout PRO is a technical analysis tool, not an automated trading system or financial advice.
Signals are calculated on closed data without intentional repainting, but values on the current bar can still evolve until the bar closes. Use this indicator as a structured way to read trend, breakout, and confluence – and combine it with your own trade plan, risk management, and testing.

Average Trading Range info box (today and historical)One small informational box, in the upper right of your chart to provide trading range information.
Line one (historical) tells you the trading range over a configurable period of time as a $ amount and as a %.
The second line (today) tells you where these values are today and the final line tells you as a %, where the values are today as a percentage of the configurable first line (14 days etc).
The third line changes color when you are 75% of the way to the historical value and red when you are at over 100% of the historical value.
Big DC scripts

Moon Phases & Declinations - Chronos Capital [BETA]High-Precision Lunar Cycles: Moon Phases & Declinations (Swiss Ephemeris)
Overview
This indicator provides institutional-grade astronomical data directly on your chart. Unlike standard scripts that use basic sine-wave approximations, this tool implements the **Swiss Ephemeris algorithm**, the gold standard for high-precision celestial calculations.
By tracking the Moon’s phases and its **Maximum/Minimum Declinations**, traders can identify potential "turning points" or "energy shifts" in market volatility often associated with lunar cycles.
---
Key Features
Ultra-High Precision: Calculations are accurate to within *seconds* of time, ensuring that the visual plot aligns perfectly with astronomical reality.
Moon Phase Tracking: Distinct markers for New Moon, Full Moon, and Quarters.
Lunar Declination Peaks: Automatically identifies when the moon reaches its *Maximum North* and *Maximum South* points (Lunar Extremes).
Customizable Visuals: Toggle between background highlights, vertical lines, or plot signals to suit your trading style.
---
Technical Accuracy
This script is built using a ported version of the Swiss Ephemeris
Positional Accuracy: Within 0.1 arcseconds.
Time Accuracy: Within **~1-2 seconds** of official JPL data.
Algorithm: Integration of the *ELP2000-85* lunar theory for maximum reliability over decades of historical data.
---
### **How to Use**
1. **Reversal Zones:** Watch for the Moon’s *Max/Min Declination* points, which often coincide with local tops or bottoms in trending markets.
2. **Volatility Shifts:** Use the *New Moon* and *Full Moon* markers to anticipate periods of increased or decreased market liquidity and volume.
3. **Confluence:** Best used in combination with your existing price action or momentum indicators to add a "time-based" filter to your entries.
*Disclaimer: This tool is for educational and analytical purposes only. Lunar cycles are a study of time-based correlation, not a guaranteed financial signal.*

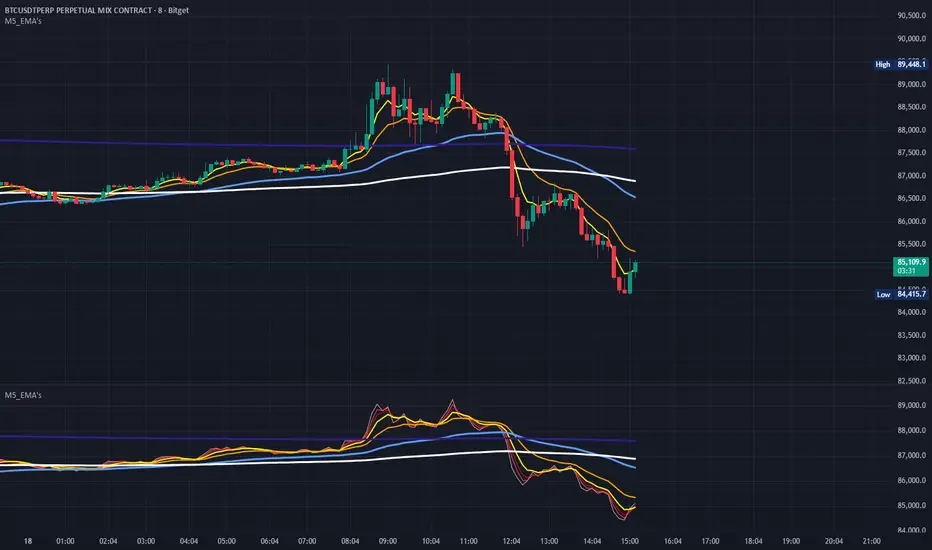
Metaltek5_EMA'sThis M5_EMA's script plots the 1,2,3,5,13,50,200,800 EMA's in bright and bold contrasting colors for easy viewing. Each plot can be toggled on/off individually. It can also be run in both the lower indicator and upper overlay sections of the chart.
QTheory [SSMT]QTheory –
This indicator is built on Quarterly Theory (developed by Daye)
🔹 Quarterly Theory
Markets often unfold in repeating quarterly cycles (Q1–Q4) across multiple timeframes — yearly, monthly, weekly, daily, 90-minute, and even micro cycles. By dividing price action into these quarters, traders can better anticipate structural shifts, accumulation/distribution phases, and liquidity runs.
🔹 Sequential SMT (SSMT)
Sequential SMT extends standard SMT (Smart Money Technique) by comparing multiple assets (such as FX majors) to identify divergences across quarters.
🔹 Features of QTheory
Automatic detection of quarterly cycles across multiple timeframes.
Visual cycle boxes & customizable dividers.
Integrated SSMT signals with divergence line visualization.
DFR (Defining Range) with Fibonacci levels.
Support for up to 5 comparison assets, with inversion options.
Auto-cycle selection for seamless multi-timeframe adaptation.
Extensive customization for colors, opacity, and signal display.
🔹 How it works
QTheory divides price data into consistent “quarters” across multiple timeframes. Within each cycle, it tracks highs, lows, and divergences, then overlays this information as boxes, dividers, and optional signals on your chart. Traders can use these visual cues to better align entries and exits with institutional market behavior patterns.
🔹 How to use it
Enable the desired cycle type (e.g., weekly, daily, 90-minute) from the settings.
Toggle boxes, dividers, and signals depending on your trading style.
Use SSMT divergences and DFR Fibs to anticipate a reversal
Compare against other assets (e.g., DXY or correlated pairs) to refine confluence.
Enable "Show Weekends" for Crypto.
⚠️ Disclaimer: This tool is for educational purposes only. It does not constitute financial advice. Always perform your own analysis and risk management.

Druckenmiller Alpha-Physics [Dual-Core]Stop trading in a vacuum. Start trading like a Macro Fund Manager.
The Druckenmiller Alpha-Physics engine is a professional-grade dashboard designed to solve the single biggest problem in trading: Context. Most traders buy a "dip" only to realize it was a crash, or sell a "rip" only to watch it fly higher.
This tool solves this by synthesizing Market Physics (Velocity & Acceleration) across two distinct timeframes (Weekly Macro & Daily Tactical) and filtering every signal through a Global Liquidity Shield.
It is engineered based on the trading philosophy of Stanley Druckenmiller: “I don’t care about the news. I care about the liquidity and the acceleration of the trend.”
How It Works (The Dual-Core Logic)
The engine runs 27 distinct sector assets through a dual-loop physics processor:
The Macro Core (Weekly): Analyzes the 18-month trend. Is the "Tide" coming in or going out?
The Tactical Core (Daily): Analyzes the 3-day price action. Is the "Wave" crashing or rising?
It then synthesizes these two data streams into a single Action Signal.
The Signals (How to Read)
The dashboard tells you exactly what to do based on the conflict between Macro and Micro:
🟢 BUY PULLBACK (The "Alpha" Trade):
Logic: Macro is RIPPING (Bullish) + Tactical is TOP/CRASH (Bearish).
Meaning: You are buying a long-term leader on a short-term discount.
🔵 STINK BID (The "Bottom" Trade):
Logic: Macro is TURNING UP + Tactical is CRASHING.
Meaning: The physics have shifted positive, but price is still dumping. Place limit orders -5% lower to catch the panic bottom.
🔴 SELL RIP (The "Trap" Trade):
Logic: Macro is TOPPING (Bearish) + Tactical is RIPPING (Bullish).
Meaning: The long-term trend is dead. Sell into this short-term rally immediately.
⚪ HOLD: All systems go. Sit on your hands and ride the trend.
The "Invisible" Liquidity Shield
The most dangerous time to buy is when the Fed is draining liquidity. This script monitors the 10-Year Treasury Yield (TNX) and VIX in real-time.
If Liquidity is OK (Navy Header): Signals are valid. Green means Go.
If Liquidity is TIGHT (Maroon Header): The entire dashboard enters "Defense Mode." Buy signals are tinted Maroon to warn you that you are fighting the Fed.
Included Universe (The "Ultimate" List)
Includes 27 institutional-grade tickers covering every corner of the market:
Growth: XLK, SMH, IGV, GRID, QTUM
Cyclical: JETS, XHB, KRE, XLI, XLF
Commodities: GDX, URA, XLE, XLB, TAN
Risk/Safety: IBIT, TLT, XLV, XLP
Note: This script uses dynamic request handling optimized for Pine Script v6. It is designed for Premium/Ultimate plans due to the high volume of data processing (54+ simultaneous streams).

Time Window Highlight📌 What this script does
Time Window Highlight highlights a specific intraday time window directly on your chart using a background color and optional vertical lines.
It was built for traders who focus on behavior around the US market open, where volatility, positioning, and false initial moves often occur.
The script does not generate signals.
It provides visual structure and timing clarity.
⸻
⏰ Default Use Case
By default, the window is set to:
• 15:40 – 16:00 (Europe/Rome time)
This time range is commonly used to observe:
• post-open fake moves
• early reversals
• stabilization after initial volatility
All times are fully customizable.
⸻
🎛️ Features
• ✅ Custom start & end time (hours and minutes)
• ✅ Background highlight for the active window
• ✅ Optional vertical start & end lines
• ✅ Option to include the full end candle
• ✅ Option to shift the end line to the end of the end candle
• ✅ Optional weekday filter (Monday–Friday only)
• ✅ Clean chart logic (historical background, live-day focus)
⸻
🧠 Designed Philosophy
This script was intentionally built to:
• avoid repainting
• avoid signals or bias
• avoid over-engineering
It is meant to support discretion, not replace it.
Use it to:
• stay patient outside your key window
• focus only when your session begins
• avoid forcing trades at random times
⸻
⚠️ Important Notes
• The script uses the chart’s timezone
→ Make sure your chart is set to Europe/Rome (or your preferred timezone).
• Background coloring works on full candles only (TradingView limitation).
• Vertical lines are time-anchored and align precisely with the session window.
⸻
🧪 Recommended Timeframes
• 1m / 2m / 5m (intraday)
• Not intended for daily or higher timeframes
⸻
❗ Disclaimer
This script is a visual aid only.
It does not provide buy or sell signals and should be used as part of a broader trading plan.


Key High/Low liquidity @sheershThe Key High/Low ICT by @sheersh169sharma indicator is designed to identify key liquidity levels across multiple timeframes and custom trading sessions. It provides precise visualization of historical highs and lows to assist in technical analysis.
## Key Features
* Multi-Timeframe Support: Automatically plots Previous Day, Week, 4-Hour, and 1-Hour levels.
* Custom Sessions: Supports up to 6 independently configurable time windows.
* Precise Anchoring: Lines originate exactly from the time the high or low formed.
* Mitigation Logic: Options to terminate lines upon price interaction or extend them indefinitely.
## Configuration Guide
### Standard Timeframes
Users can toggle and customize the following levels:
* Previous Day High/Low
* Previous Week High/Low
* Previous 4-Hour High/Low
* Previous 1-Hour High/Low
Each level allows for customization of visibility, color, and line style (Solid, Dashed, Dotted).
### Custom Sessions
The indicator supports 6 distinct custom sessions, ideal for defining specific market hours (e.g., Asia, London, New York).
Setup Instructions:
1. Navigate to the desired Session group in settings (e.g., Session 1).
2. Enable the session.
3. Define the time range in HHMM-HHMM format (e.g., 0930-1600).
4. Assign custom labels for identification.
5. Select line colors and styles.
### Extension Logic
The "Extend until Mitigated Only" setting controls how lines are drawn:
* Disabled (Default): Lines extend from the custom timeframe to the current chart bar.
* Enabled: Lines terminate strictly at the point where price touches the level.
### Visual Settings
* Line Width: Adjusts the thickness of all indicator lines globally.
* Labels: Text labels are positioned to the right of the lines to maintain chart clarity.

BTC Halving VWAP [Cycle Analysis]█ OVERVIEW
This indicator plots Anchored Volume Weighted Average Prices (VWAPs) from each Bitcoin halving date, revealing the "fair value" of each market cycle.
The key insight: When price closes below the current cycle's VWAP on the monthly chart (after 1+ year into the cycle), it historically signals the end of the bull market and continuation toward the previous halving's VWAP.
█ HALVING DATES
• H1: November 28, 2012 (Block 210,000)
• H2: July 9, 2016 (Block 420,000)
• H3: May 11, 2020 (Block 630,000)
• H4: April 19, 2024 (Block 840,000)
█ FEATURES
◽ Anchored VWAPs — VWAP lines calculated from each halving date
◽ Consolidation Bands — Adjustable percentage bands around each VWAP (default ±15%)
◽ Cycle Top Detection — Tracks the highest high before VWAP breakdown
◽ Breakdown Signals — Visual markers when price breaks below cycle VWAP (bearish confirmation)
◽ Interactive Dashboard — Shows cycle progress, VWAP levels, and historical comparison
◽ Alerts — Configurable alerts for VWAP crossovers and breakdowns
█ HOW TO USE
1. Apply to BTCUSD on the Monthly timeframe for best results
2. Watch the H4 VWAP (gold line) — this is the current cycle's fair value
3. When price is ABOVE the VWAP → Bullish bias
4. When price is BELOW the VWAP → Bearish bias, expect move to previous cycle VWAP
5. The ▼ signal marks confirmed cycle tops (VWAP breakdown after 1+ year)
█ DASHBOARD GUIDE
• Price — Current price and gain from halving
• Day — Days since halving and cycle progress %
• VWAP Levels — Current VWAP values with status (ABOVE/BELOW/CONSOL)
• Cycle Tops — Historical days to cycle top for H2 and H3
• Next Halving — Estimated date and countdown
█ SETTINGS
Display:
• Toggle dashboard, consolidation bands, vertical lines, cycle tops, breakdown signals
VWAPs:
• Show/hide individual halving VWAPs (H1-H4)
Settings:
• Dashboard text size
• Consolidation band percentage
• Cycle top label size
█ ALERTS
• VWAP Breakdown — Price breaks below any halving VWAP
• VWAP Reclaim — Price reclaims a halving VWAP
• Consolidation Zone — Price enters consolidation around VWAP
█ NOTES
• Best used on Monthly (1M) timeframe for cycle analysis
• Weekly timeframe also works for more granular view
• H1 VWAP disabled by default (requires data from 2012)
• Cycle top locks when price closes below VWAP after 365+ days into the cycle

Power Law of Diminishing Returns for BTC:USDTThis is a script to see if the Law of Diminshining Returns is applicable to BTC/USD
