RSI Dip Reversal Pro ScannerRSI Upside Reversal Scanner (High Accuracy)
This indicator is designed to detect early-stage upside reversals by identifying when RSI crosses upward from oversold levels while the price remains positioned in the lower portion of its recent range. It combines momentum shift with price location analysis to produce highly reliable reversal signals.
It uses 3 primary filters:
RSI Oversold Cross:
RSI must cross upward from the oversold threshold (default 30).
Price in Bottom Range:
Price must be located within the lower 40% of the last 20-bar range, indicating a discount zone.
Overbought Protection:
RSI must stay below the ceiling level (default 75) to prevent signals near top exhaustion.
When all criteria are met, the indicator plots a “GİRİŞ” (ENTRY) label below the candle.
This tool is ideal for:
Identifying accurate dip-buy zones
Capturing trend reversals early
Optimizing swing and scalp entries
Feeding systematic trading models or bots
It performs well on short- and mid-term timeframes.
วัฏจักร

Delbert SetupDelbert Setup is a clean, time-based session framework designed for traders who follow PNY, NYO, and evening market structure in IST (Asia/Kolkata) time.
It highlights key intra-day timing, PNY/NYO session highs/lows, and important schedule-based vertical markers for structured intraday planning.
🔍 What This Indicator Shows
1. PNY Session (09:30–18:55 IST)
Automatically draws:
PNY High (PNYH)
PNY Low (PNYL)
Thin solid levels from session start to session end
Vertical dotted lines at PNY open & close with timestamp labels
2. NYO Session (19:00–19:55 IST)
Displays:
NYOH / NYOL levels
NYO open/close vertical dotted lines
Session-only range levels (thin solid 1px)
3. 00:30 IST Marker
A dedicated vertical dotted line at 00:30 IST, useful for:
Timing bias
Session transitions
Trade management cutoffs
4. Optional NQ Reference Levels
If enabled, the script plots:
NQ open price at NYO start
Adjustable ± offset bands (default 100 points)
These assist traders correlating NQ behavior with their instrument.
🎨 Visual Style
All vertical lines → thinnest dotted black
PNY / NYO highs & lows → thin solid levels (1px)
Time labels → red, size-small, placed above chart structure
Designed for clean visual structure without clutter
🕒 Why IST Timing?
This indicator is tailored for traders who operate in India Standard Time, aligning PNY/NYO with local clock time without mental conversion.
All calculations use Asia/Kolkata timezone internally.
⚠ Notes
This indicator does not generate buy/sell signals.
It is meant as a market structure & session map, helping traders reference key liquidity and timing zones.
Works on any timeframe and across all assets.
✔ Ideal For Traders Who Use:
Session-based models (PNY, NYO, Pre-New York)
Liquidity sweeps near session highs/lows
Timing-based bias
Correlation models with NQ

BTC Macro Regime & Stoch RSI SignalThis script is designed for traders who want to combine macro context with precise momentum timing on Bitcoin.
Instead of looking at isolated indicators, it aggregates several independent data streams into a single bias score and then uses a stochastic RSI engine to time entries and exits.
The goal is simple:
Filter the market into long / neutral / short regimes,
Only act when momentum aligns with the current regime,
Avoid overtrading in noisy or highly leveraged conditions.
What the indicator does (conceptually)
The script builds an internal “macro + momentum score” for BTC by combining:
Cycle / valuation regime
Tracks where BTC sits in the broader cycle (discount vs overheating) and whether conditions are favorable for medium-term upside or downside.
Network & miner trend regime
Monitors the health and trend of network activity / miners to detect stress, capitulation and recovery phases.
Derivatives / leverage regime
Looks at futures positioning to identify when leverage is excessive or has been flushed out, acting as a risk filter rather than a standalone entry trigger.
Price momentum (Stochastic RSI)
Uses a Stochastic RSI engine on price to capture short-term swings and turning points, especially at extremes.
All of this is compressed into a single score between −1 and +1, where:
Values near +1 indicate a supportive macro environment with bullish momentum,
Values near −1 indicate a risk-off / bearish environment,
Values around 0 indicate indecision or transition.
The exact construction, weights and thresholds are handled internally by the script.
Signals & visuals
The indicator provides:
A Total Score line:
Above a configurable upper level → long bias
Below a configurable lower level → short bias
In between → neutral / low conviction
Background shading:
Green tint when the regime favors long setups
Red tint when the regime favors short setups
Stochastic RSI panel:
K and D lines plotted on a 0–100 scale
The 0–10 zone is highlighted in green (deep oversold)
The 90–100 zone is highlighted in red (deep overbought)
Extreme cross markers:
A green marker when Stoch RSI crosses up in the lower extreme zone
A red marker when Stoch RSI crosses down in the upper extreme zone
Entry / exit markers (optional visual guide):
Long entry markers appear when:
The macro score is in long-bias territory, and
Stoch RSI confirms an upward cross from oversold conditions.
Short entry markers appear when:
The macro score is in short-bias territory, and
Stoch RSI confirms a downward cross from overbought conditions.
Exit markers appear when momentum flips against the active bias or the macro score degrades.
These markers are guides, not mechanical trading rules.
How to use it
Typical workflow:
Start with the Total Score
Use it as a regime filter:
Only look for longs when the score shows a sustained positive bias.
Only look for shorts when the score shows a sustained negative bias.
Then look at Stoch RSI
Use it to time pullbacks and reversals within the current bias:
In a long bias → favor bullish crosses from low levels.
In a short bias → favor bearish crosses from high levels.
Respect leverage conditions
When the internal risk engine flags crowded leverage, treat signals more conservatively:
Reduce size,
Tighten risk,
Or skip trades entirely if conditions look unstable.
This script is not meant to create a high-frequency scalping system. It is a context + timing framework for swing and positional trades on BTC.
Timeframes
The macro components are designed with higher-timeframe logic in mind.
Recommended:
Use 1D as the primary perspective for the bias,
Optionally refine entries on 4H if you want more precise timing.
Important notes & disclaimer
This tool is specifically tuned for Bitcoin, not for altcoins.
The internal logic, data processing and weighting are intentionally abstracted to keep the focus on the final score and signals rather than on raw formulas.
As with any indicator, it can produce false signals and whipsaws, especially during violent news events or regime shifts.
This is not financial advice. Always combine the script with your own analysis, sound risk management and position sizing. Use at your own risk.


Previous Day Week Month Highs & Lows [MHA Finverse]Previous Day Week Month Highs & Lows is a comprehensive multi-timeframe indicator that automatically plots previous period highs and lows across Daily, Weekly, Monthly, 4-Hour, and 8-Hour timeframes. Perfect for identifying key support and resistance levels that often act as magnets for price action.
How It Works
The indicator retrieves the highest high and lowest low from the previous completed period for each selected timeframe. Lines extend forward into current price action, allowing you to see when price approaches or breaks these critical levels in real-time. The indicator tracks the exact bar where each high and low occurred, ensuring accurate historical placement.
---
Key Features
Multi-Timeframe Levels:
• Current Daily, Previous Daily, 4H, 8H, Weekly, and Monthly highs/lows
• Fully customizable colors and line styles (Solid, Dashed, Dotted)
• Adjustable line width and extension length
Visual Enhancements:
• Price labels showing exact level values
• Range position percentage (distance from high/low)
• Optional period boxes highlighting timeframe ranges
• Day and date labels for reference
Trading Tools:
• Breakout markers when price crosses key levels
• Touch count tracking (how many times price tested each level)
• Time at level display (consolidation detection)
• Customizable thresholds for touch and time analysis
Alert System:
• Individual alerts for each timeframe: Daily High/Low Break, 4H High/Low Break, 8H High/Low Break, Weekly High/Low Break, Monthly High/Low Break
• Toggle switches to enable/disable alerts per timeframe
• Clear messages showing which level was broken and at what price
---
How to Use
Setup:
1. Enable your preferred timeframes in "Highs & Lows MTF" settings
2. Customize colors and styles to match your chart
3. Turn on visual features like price labels and range percentages
4. Set up alerts by creating specific alert conditions or using toggle switches
Trading Applications:
Breakout Trading: Watch for strong momentum when price breaks above previous highs or below previous lows
Support/Resistance: Use these levels as potential reversal points for entry/exit signals
Range Trading: Trade between previous highs and lows using the range position indicator
Stop Loss Placement: Place stops just beyond previous highs (shorts) or lows (longs)
Multiple Timeframe Confirmation: Combine timeframes for stronger signals (e.g., Daily near Weekly support)
---
Best Practices
• Use Weekly/Monthly for swing trading, Daily/4H/8H for day trading
• Combine with volume or momentum indicators for confirmation
• Multiple timeframe levels clustering together create high-probability zones
• The more touches a level has, the more significant it becomes
---
Disclaimer
This indicator is a technical analysis tool for identifying price levels based on historical data. It does not guarantee profits or predict future movements. Trading involves substantial risk. Always use proper risk management and never risk more than you can afford to lose.

11-MA Institutional System (ATR+HTF Filters)11-MA Institutional Trading System Analysis.
This is a comprehensive Trading View Pine Script indicator that implements a sophisticated multi-timeframe moving average system with institutional-grade filters. Let me break down its key components and functionality:
🎯 Core Features
1. 11 Moving Average System. The indicator plots 11 customizable moving averages with different roles:
MA1-MA4 (5, 8, 10, 12): Fast-moving averages for short-term trends
MA5 (21 EMA): Short-term anchor - critical pivot point
MA6 (34 EMA): Intermediate support/resistance
MA7 (50 EMA): Medium-term bridge between short and long trends
MA8-MA9 (89, 100): Transition zone indicators
MA10-MA11 (150, 200): Long-term anchors for major trend identification
Each MA is fully customizable:
Type: SMA, EMA, WMA, TMA, RMA
Color, width, and enable/disable toggle
📊 Signal Generation System
Three Signal Tiers: Short-Term Signals (ST)
Trigger: MA8 (EMA 8) crossing MA21 (EMA 21)
Filters Applied:
✅ ATR-based post-cross confirmation (optional)
✅ Momentum confirmation (RSI > 50, MACD positive)
✅ Volume spike requirement
✅ HTF (Higher Timeframe) alignment
✅ Strong candle body ratio (>50%)
✅ Multi-MA confirmation (3+ MAs supporting direction)
✅ Price beyond MA21 with conviction
✅ Minimum bar spacing (prevents signal clustering)
✅ Consolidation filter
✅ Whipsaw protection (ATR-based price threshold)
Medium-Term Signals (MT)
Trigger: MA21 crossing MA50
Less strict filtering for swing trades
Major Signals
Golden Cross: MA50 crossing above MA200 (major bullish)
Death Cross: MA50 crossing below MA200 (major bearish)
🔍 Advanced Filtering System1. ATR-Based ConfirmationPrice must move > (ATR × 0.25) beyond the MA after crossover
This prevents false signals during low-volatility consolidation.2. Momentum Filters
RSI (14)
MACD Histogram
Rate of Change (ROC)
Composite momentum score (-3 to +3)
3. Volume Analysis
Volume spike detection (2x MA)
Volume classification: LOW, MED, HIGH, EXPL
Directional volume confirmation
4. Higher Timeframe Alignment
HTF1: 60-minute (default)
HTF2: 4-hour (optional)
HTF3: Daily (optional)
Signals only trigger when current TF aligns with HTF trend
5. Market Structure Detection
Break of Structure (BOS): Price breaking recent swing highs/lows
Order Blocks (OB): Institutional demand/supply zones
Fair Value Gaps (FVG): Imbalance areas for potential fills
📈 Comprehensive DashboardReal-Time Metrics Display: {scrollbar-width:none;-ms-overflow-style:none;-webkit-overflow-scrolling:touch;} ::-webkit-scrollbar{display:none}MetricDescriptionPriceCurrent close priceTimeframeCurrent chart timeframeSHORT/MEDIUM/MAJORTrend classification (🟢BULL/🔴BEAR/⚪NEUT)HTF TrendsHigher timeframe alignment indicatorsMomentumSTR↑/MOD↑/WK↑/WK↓/MOD↓/STR↓VolatilityLOW/MOD/HIGH/EXTR (based on ATR%)RSI(14)Color-coded: >70 red, <30 greenATR%Volatility as % of priceAdvanced Dashboard Features (Optional):
Price Distance from Key MAs
vs MA21, MA50, MA200 (percentage)
Color-coded: green (above), red (below)
MA Alignment Score
Calculates % of MAs in proper order
🟢 for bullish alignment, 🔴 for bearish
Trend Strength
Based on separation between MA21 and MA200
NONE/WEAK/MODERATE/STRONG/EXTREME
Consolidation Detection
Identifies low-volatility ranges
Prevents signals during sideways markets
⚙️ Customization OptionsFilter Toggles:
☑️ Require Momentum
☑️ Require Volume
☑️ Require HTF Alignment
☑️ Use ATR post-cross confirmation
☑️ Whipsaw filter
Min bars between signals (default: 5)
Dashboard Styling:
9 position options
6 text sizes
Custom colors for header, rows, and text
Toggle individual metrics on/off
🎨 Visual Elements
Signal Labels:
ST▲/ST▼ (green/red) - Short-term
MT▲/MT▼ (blue/orange) - Medium-term
GOLDEN CROSS / DEATH CROSS - Major signals
Volume Spikes:
Small labels showing volume class + direction
Example: "HIGH🟢" or "EXPL🔴"
Market Structure:
Dashed lines for Break of Structure levels
Automatic detection of swing highs/lows
🔔 Alert Conditions
Pre-configured alerts for:
Short-term bullish/bearish crosses
Medium-term bullish/bearish crosses
Golden Cross / Death Cross
Volume spikes
💡 Key Strengths
Institutional-Grade Filtering: Multiple confirmation layers reduce false signals
Multi-Timeframe Analysis: Ensures alignment across timeframes
Adaptive to Market Conditions: ATR-based thresholds adjust to volatility
Comprehensive Dashboard: All critical metrics in one view
Highly Customizable: 100+ input parameters
Signal Quality Over Quantity: Strict filters prioritize high-probability setups
⚠️ Usage Recommendations
Best for: Swing trading and position trading
Timeframes: Works on all TFs, optimized for 15m-Daily
Markets: Stocks, Forex, Crypto, Indices
Signal Frequency: Conservative (quality over quantity)
Combine with: Support/resistance, price action, risk management
🔧 Technical Implementation Notes
Uses Pine Script v6 syntax
Efficient calculation with minimal repainting
Maximum 500 labels for performance
Security function for HTF data (no lookahead bias)
Array-based MA alignment calculation
State variables to track signal spacing
This is a professional-grade trading system that combines classical technical analysis (moving averages) with modern institutional concepts (market structure, order blocks, multi-timeframe alignment).
The extensive filtering system is designed to eliminate noise and focus on high-probability trade setups.


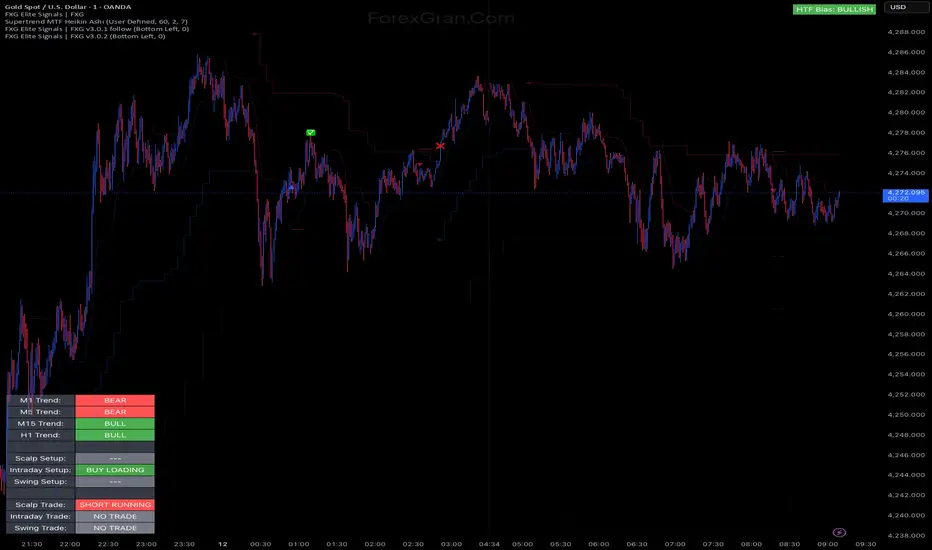
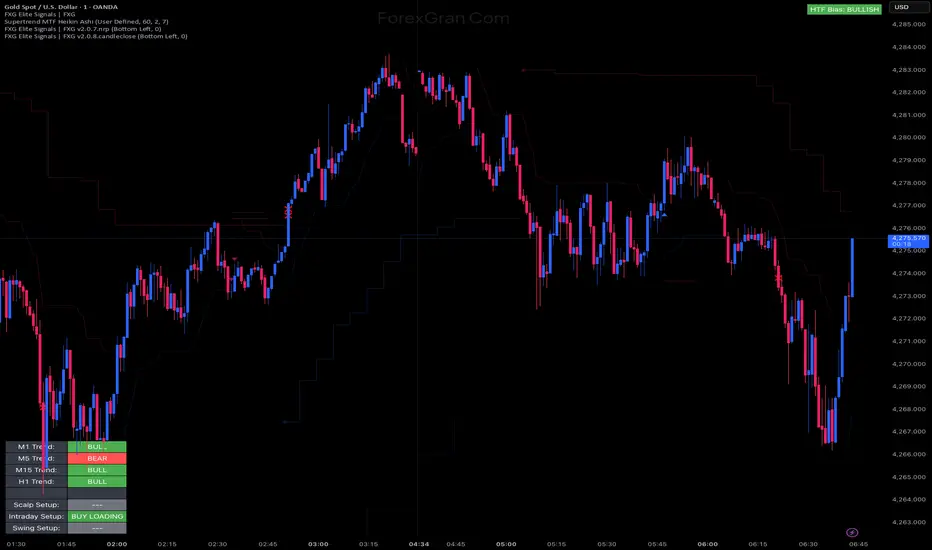
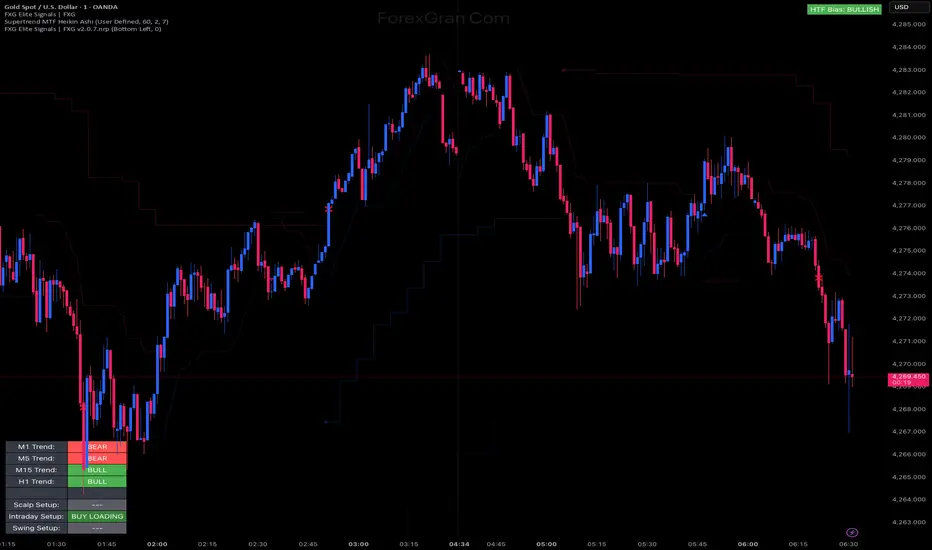
FXG Elite Signals | FXG v2.0.8.candlecloseReversal Zone Trading With Scalp , Intraday and Swing setups
Volume Crisis Created by Alphaomega18
🎯 What is the Crisis Detector Pro?
The Crisis Detector Pro is an advanced multi-component indicator that detects market crisis situations by simultaneously analyzing:
Volume: Anomalies and volume spikes
VIX: Volatility Index (S&P 500)
ATR: True volatility (all assets)
Open Interest: Estimated open interest (futures contracts)
The indicator calculates a Composite Crisis Score (0-100) that combines these elements to alert you to critical market moments.
📊 Indicator Components
1️⃣ Volume Analysis
Anomaly detection: Compares current volume to its moving average
Classification:
🟡 Moderate: 1.5x - 2x average
🟠 High: 2x - 3x average
🔴 Extreme: > 3x average
Bollinger Bands: Detects volume breakouts
Clusters: Identifies 3+ consecutive days of anomalies
2️⃣ VIX (Fear Index)
S&P 500 only
Default thresholds:
🟡 Moderate: VIX > 20
🟠 High: VIX > 30
🔴 Extreme: VIX > 40
3️⃣ ATR (Average True Range)
Measures true volatility
Compatible with all assets (stocks, futures, forex, crypto)
Compares current ATR to its average
4️⃣ Open Interest (OI)
Estimation based on Volume / 2
Detects changes > 25%
Inverted colors:
🔴 Red: OI increase (new positions)
🟢 Green: OI decrease (position closing)
⚙️ Main Parameters
Calculations:
Moving Average Period: 20 (default)
Standard Deviation Period: 20
ATR Period: 14
Volume Thresholds:
Moderate: 1.5x
High: 2.0x
Extreme: 3.0x
Composite Score (Weights):
Volume: 35%
VIX: 25%
ATR: 20%
Open Interest: 20%
📈 Visual Signals
Top of Chart:
🟡 Yellow triangle: Moderate alert (Score 50-70)
🟠 Orange triangle: High alert (Score 70-85)
🔴 Red triangle: EXTREME CRISIS (Score 85-100)
⚠️ Purple cross: Reinforced signal (Volume + Volatility simultaneous)
Bottom of Chart:
💎 Purple diamond: 50-day volume record
⬛ Fuchsia square: Cluster (3+ abnormal days)
Volume Bars:
Gray: Normal volume
🟡 Yellow: Moderate volume
🟠 Orange: High volume
🔴 Red: Extreme volume
Open Interest Curve:
🔵 Blue: Normal variation
🔴 Red: Increase > 25%
🟢 Green: Decrease > 25%
🎯 How to Use the Indicator
1. Initial Setup
For S&P 500 / US Indices:
Enable VIX ✅
Enable ATR ✅
Enable OI ✅
Composite Score ✅
For Other Assets (Forex, Crypto, Stocks):
Disable VIX ❌
Enable ATR ✅
Enable OI (optional)
Composite Score ✅
2. Crisis Score Interpretation
ScoreLevelMeaningAction0-50Normal ✅Calm marketNormal trading50-70Vigilance 🟡Volatility risingIncreased monitoring70-85Danger 🟠Critical situationReduce exposure85-100Crisis 🔴MAXIMUM ALERTCapital protection
3. Trading Strategies
Directional Trading:
Reinforced signal ⚠️ = Powerful move in progress
Enter in direction of movement with confirmation
Tight stops, quick targets
Risk Management:
Score > 70 → Reduce position size by 50%
Score > 85 → Stop trading or ultra-short positions
Cluster detected → Avoid new trades
Scalping/Day Trading:
Extreme volume 🔴 = Scalping opportunities
Wait for confirmation before entering
Exit quickly on spikes
Swing Trading:
Avoid opening swings during crises
Protect existing positions (trailing stops)
Wait for return to normal (Score < 50)
4. Open Interest (Futures):
OI Increase (🔴 Red):
New positions opened
Strong market conviction
Movement may intensify
OI Decrease (🟢 Green):
Position closing
Profit-taking or stop losses
Possible reversal
🔔 Configurable Alerts
The indicator includes 8 types of alerts:
🟡 Moderate Crisis Alert: Score 50-70
🟠 HIGH Crisis ALERT: Score 70-85
🔴 MAJOR CRISIS: Score 85-100
⚠️ REINFORCED SIGNAL: Extreme Volume + Volatility simultaneous
💎 RECORD Volume: Highest volume over 50 days
📊 Cluster DETECTED: 3+ consecutive abnormal days
📈 OI SPIKE >25%: Sharp Open Interest increase
📉 OI DECLINE >25%: Sharp Open Interest decrease
Setup: Right-click on chart → "Add Alert" → Select alert
💡 Optimization Tips
Scalping (1-5min):
MA Period: 10-15
Moderate Threshold: 1.3x
High Threshold: 1.8x
Volume Weight: 50%
Day Trading (15min-1H):
MA Period: 20 (default)
Thresholds: Default
Composite Score: Enabled
Swing Trading (4H-Daily):
MA Period: 30-50
StdDev Multiplier: 2.5
ATR Period: 20
Volatile Markets (Crypto):
Moderate Threshold: 1.8x
High Threshold: 2.5x
Extreme Threshold: 4.0x
ATR Weight: 30%
📊 Statistics Table
The real-time table displays:
Crisis Score: 0-100 with color coding
Current volume: Value and ratio
Volume Score: Contribution to total score
Open Interest: Estimated value and % change
VIX: Current value (if enabled)
ATR: Ratio to average
Global STATUS: Normal ✅ / Vigilance 🟡 / Danger 🟠 / Crisis 🔴
⚠️ Warnings and Limitations
❌ Limitations:
Open Interest is estimated (Volume / 2), not real value
VIX only works for S&P 500
False signals possible in very volatile markets
✅ Best Practices:
Always combine with classic technical analysis
Never trade solely on alerts
Adapt thresholds to your asset and timeframe
Backtest before using live
Respect your risk management plan
🎓 Real Use Cases
Example 1: Flash Crash
Extreme volume 🔴 + Extreme ATR 🔴 + Reinforced signal ⚠️
Composite score > 90
Action: No new trades, protect existing positions
Example 2: Fed Announcement
VIX > 35 + Moderate volume 🟡 + OI rising 🔴
Composite score: 65
Action: Reduce position size, widen stops
Example 3: Volatility Squeeze
Cluster detected + Volume record 💎 + OI declining 🟢
Action: Scalping opportunity in breakout direction
📈 Performance
Real-time detection (0 lag)
Compatible all markets and timeframes
Low resource consumption
Complete history preserved

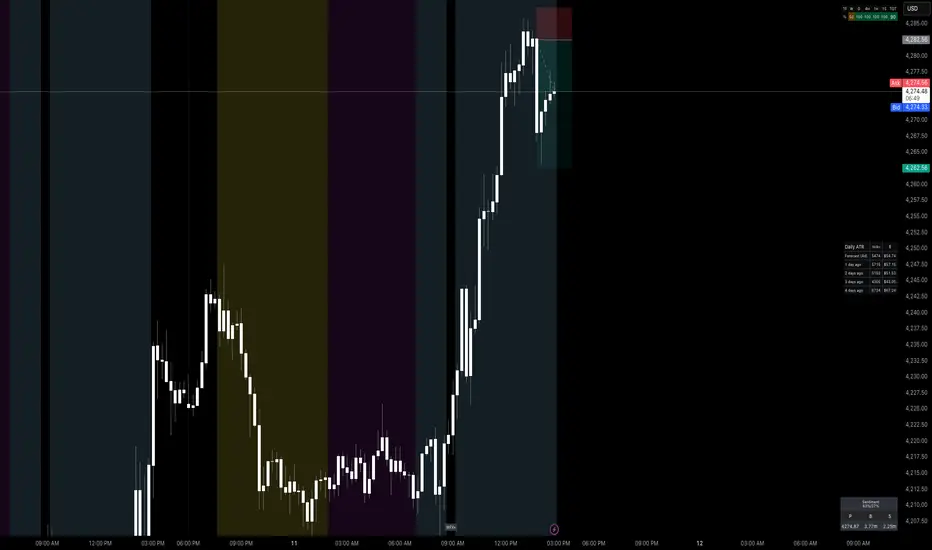
Worstfx Fractal Sessions 🧩 Worstfx Fractal Sessions Public — Features & Purpose
✔️ Includes clean session structure • Simple confluence • Built-in guardrails for your psychology
Worstfx Fractal Sessions Public is a stripped-back, clean version of the full Worstfx framework.
It’s designed to give every trader the core advantages of the fractal system:
• clear session structure
• simple trend/confluence read
• context from Daily ATR
• basic order-flow sentiment
• an on-chart help panel so nobody gets lost
All without overwhelming settings or “indicator soup.”
Use it to see the day as a story: Asia range → London expansion → Pre-NY setup → NY confirmation or reversal.
⸻
⚙️ Main Features
1️⃣ Session Shading (Asia / London / Pre NY / NY)
What it does
• Colors each session with soft, transparent shading:
• Asia – yellow tone
• London – purple tone
• Pre NY – light blue
• NY – light blue (separate time block)
• You can customize the session times and colors.
• Includes a 6:00 pm ET divider line to mark the start of a new “trading day” in your framework.
Why it matters (psychology)
• Your brain stops seeing random candles and starts seeing chapters:
• Asia = range / setup
• London = expansion / fakeouts
• NY = continuation / reversal
• This reduces FOMO and impulsive entries because you naturally ask:
“Which session am I in?”
“What is this session supposed to be doing?”
• The 6pm divider helps you mentally reset each day instead of carrying emotional baggage from yesterday into today.
⸻
2️⃣ Time-Frame Confluence Panel (Weekly → 15m)
What it does
• Checks a simple model on multiple timeframes (W, D, 4H, 1H, 15m):
• Above or below the 50 EMA
• RSI above or below 50
• Converts that into a 0–100% confluence score per TF.
• Gives a %TOTAL score that blends all TFs into a single number.
• Two display modes:
• Strip — horizontal bar with W/D/4H/1H/15m + %TOTAL
• Table — vertical list showing bull% / bear% per TF
• Mobile mode shrinks everything for smaller screens.
Why it matters (psychology)
• Instead of arguing with yourself about “trend,” you get a simple question:
“Are the higher timeframes mostly aligned or mixed?”
• Green/high %TOTAL = “permission” to press your bias, not to over-trade.
• Red/low %TOTAL = natural brake: “This is not the clean trend day. Size down or stay out.”
• It pulls you away from 1-minute tunnel vision and forces you to respect bigger structure.
⸻
3️⃣ Daily ATR Panel (Last 4–12 days + Forecast)
What it does
• Tracks true daily range (High–Low) over recent days.
• Shows:
• Last few days’ range in ticks and $
• Optional 4-day average forecast (projected typical daily move)
• Option to show just last 4 days, or full 12-day history.
• Two modes:
• Table – labeled rows with “ticks / $” columns
• Macro – compact text summary like “FC: 2000t | $20.00”
Why it matters (psychology)
• You stop expecting 5000-tick moves on a 600-tick average day.
• When the forecast is small, you naturally:
• avoid chasing huge targets
• respect partials
• recognize “maybe today just isn’t the big runner”
• On big ATR days, you recognize that volatility is here, so:
• you give your targets breathing room
• you’re less likely to panic when price swings
• This keeps your expectations in line with reality, which reduces tilt, frustration, and revenge trades.
⸻
4️⃣ Order-Flow Sentiment Panel (Compact OF Read)
What it does
• Estimates buy vs sell volume on the current and previous candles.
• Shows:
• Sentiment row with Buy% / Sell%
• Buy/Sell volumes (with “k/m” formatting if enabled)
• Optional extra rows for prior candles.
• Highlights imbalances when one side hits your imbalance threshold (e.g., 70%).
Why it matters (psychology)
• Gives you a quick “who’s in control right now” view without staring at raw volume.
• Imbalance flashes create micro-alerts:
• “This might be a stop run or strong continuation, pay attention.”
• Prevents you from blindly shorting into heavy buy pressure or buying into stacked sell pressure just because of greed or fear.
• Makes your entries feel more validated, which calms you during the trade.
⸻
🧠 Overall Psychological Goal
Worstfx Fractal Sessions Public is not just a visual skin for your charts.
It’s a behavior framework.
It tries to quietly enforce:
• Patience → by tying you to sessions and key time behavior.
• Selectivity → by checking multi-TF trend alignment.
• Realistic expectations → via ATR context.
• Non-impulsive entries → via order-flow imbalance checks.
• Accountability → via clear explanations and structure, not vibes.
Instead of chasing every move, you’re guided into a loop:
“What session am I in? What is ATR saying? Are TFs aligned? Is order-flow confirming? If not, I wait.”
🔋 The risk is minimized by structure & The reward is maximized by timing🔋
Worstfx Key Time Windows + 5 Day Journal🕒 Key Time Windows — Features & Purpose
✔️ Includes 6 Major Time Windows:
• 7:45 PM (Asia Open Overview)
• 12:00 AM (Daily Reset Liquidity Shift)
• 2:00 AM (London Accumulation / Manipulation)
• 7:00 AM (Pre-NY / Expansion Setup)
• 10:00 AM (NY Reversal Window)
• 2:00 PM (NY Power Move / Final Push) ← added
These windows are not random — they are the exact points in the day where:
• Liquidity resets
• Volatility compresses or expands
• Session trends form or reverse
• Market makers reposition
• High-probability setups appear
The panel shows:
➤ INSIDE
You are currently in the window.
Expect movement, structure breaks, or trap/reversal behavior.
➤ NEAR
Approaching a key window.
Prepare, observe order flow, plan entries.
➤ FAR
Out of the actionable range.
Ideal for reducing screen time and avoiding emotional trades.
➤ IDLE
The window passed.
High-probability moment is over — walk away or wait for the next one.
⚡ Why this matters
Most blown accounts come from trading outside high-probability times.
Your edge comes from timing, not randomness.
This panel keeps your brain aligned with the correct moments — not boredom, FOMO, or impulse.
📊 5-Day Performance Journal — Features
✔️ Enter daily P/L manually
• Monday → Friday
• Accepts positive or negative values
• Example: +2500, -300, 0
✔️ Auto-Calculated Weekly Total
• Shown right next to Friday
• Colored based on profit or loss
• Light highlight tint to stand out without distractions
✔️ Two Clean Layouts
• Vertical → For corner placement
• Horizontal → For header-like week summaries
✔️ Psychology Through Design
• Green = rewarded discipline
• Red = consequence of breaking plan
• White-dim = zero day → neutral, no shame, no heat
The goal is not the number —
It’s accountability, awareness, and emotional grounding.
🧠Consistency Over Drama
The weekly total next to Friday forces your brain to think in weeks, not minutes.
Bad day?
You stop early to protect weekly total.
Good day?
You don’t overtrade because the number is already green.
This shifts your psychology from:
“I need to win right now.”
to:
“I need to preserve my weekly edge.
🔋To unlock the full power of the framework, run this together with Worstfx Fractal Sessions🔋

ICT Key Levels Suite |MC|Parts of this script were created by TheTickMagnet, Bankulov, and others. Many thanks to them; credit is due to all of you. I simply compiled them into a suite...
🌟 Overview 🌟
This tool highlights key price levels, such as highs, lows, and session opens, that can influence market movements. Based on ICT concepts, these levels help traders spot potential areas for market reversals or trend continuations.
🌟 Key Levels 🌟
🔹 Week Open (at Sunday 6:00pm EST for Futures)
Marks the start of the trading week. This level helps track price direction and is useful for framing the weekly candle formation using ICT’s Power of 3.
🔹 (Trading) Day Open: 6:00pm EST for Futures or 5:00pm EST for Forex.
🔹 Midnight Open (True Day Open) (00:00 EST)
The Midnight Open (MNOP) marks the start of the new trading day. Price often retraces to this level for liquidity grabs, setting up larger moves in the daily trend. It's also key for framing the Daily Power of 3 and spotting possible market manipulation.
🔹 Previous Day High/Low (customizable)
These levels show where liquidity remains, often serving as targets for price revisits, ideal for reversals or continuation trades.
🔹 Daily divider lines with Weekday label (customizable)
🌟 Overview 🌟
The ICT Sessions & Ranges Indicator helps traders identify key intraday price levels by marking custom session highs/lows and opening ranges.
It helps traders spot potential liquidity grabs, reversals, and breakout zones by tracking price behavior around these key areas
🌟 Session Highs & Lows – Liquidity Zones 🌟
Session highs and lows often attract price due to stop orders resting above or below them. These levels are frequently targeted during high-volatility moves.
🔹 Asia session
- Usually ranges in low volatility.
- Highs/lows often get swept during early London.
- Price may raid these levels, then reverse.
🔹 London session
- First major volatility of the day.
- Highs/lows often tested or swept in New York.
- Commonly forms the day's true high or low.
🔹 NY AM, Lunch & PM Session
🌟 Customizable Settings 🌟
The indicator includes 5 configurable ranges, each with:
Start & End Time – Set any custom time window.
Display Type – Choose Box (highlight range) or Lines (mark high/low) or both (Box and extended Lines).
Color Settings – Set custom colors for boxes and lines.
🌟 Default Settings (according to ICT) 🌟
Range 1: 6:00pm - 2:00am (Asia Session)
Range 2: 02:00 - 07:00 (London Session)
Range 3: 07:00 - 12:00 (NY AM Session)
Range 4: 12:00 - 1:30pm (NY Lunch Session)
Range 5: 1:30pm - 5:00pm (NY PM Session)
Happy trading!
EMA Convergence EstimatorEMA Convergence Estimator is a tool designed to help traders visualize when two key trend EMAs—typically the 50-EMA and 200-EMA—are moving toward or away from each other. By analyzing slope, distance, and rate of convergence, the script estimates how many candles, hours, or days remain until the EMAs potentially touch.
This can be helpful for identifying upcoming trend shifts, tightening market conditions, or periods where momentum may be compressing before a larger move.
🔍 Features
Fast EMA & Slow EMA (default 50 / 200)
EMA distance tracking
Slope-based convergence calculation
Estimated time until EMAs meet in:
📍 Candles
⏱️ Hours
📅 Days
Real-time label panel showing all values
On-chart EMA cross markers
“+” printed directly on bullish EMA crosses
“–” printed directly on bearish EMA crosses
Fully transparent label background so it does not obstruct candles
📈 Use Cases
Identifying when EMAs are tightening (consolidation)
Spotting potential future crossovers earlier than normal indicators
Estimating momentum compression or expansion
Tracking longer-term trend dynamics on any timeframe
⚠️ Notes
The convergence estimate is mathematical, not predictive.
EMAs react to price — they do not forecast it.
Results depend on current slope and can change rapidly as new candles form.
Always use this tool as part of a broader analysis process.
This script is for educational purposes only and does not constitute financial advice.

Quality Detector (Buffett Style) + Beta [Solid]This indicator acts as an on-chart fundamental screener, designed to instantly evaluate the quality and financial health of a company directly on your price chart.
The concept is inspired by "Buffettology" principles: looking for large, profitable companies with low debt. Additionally, it includes a Beta calculation to assess market volatility risk.
The tool displays a panel in the bottom-right corner featuring four key metrics and a final verdict.
How it Works & Metrics Used
The script retrieves quarterly fundamental data ("FQ") and performs calculations to verify if the asset meets specific criteria.
1. Market Cap (Size)
What it is: The total market value of the company's outstanding shares.
Goal: To identify established, large-cap companies.
Default Threshold: Must be greater than $10 Billion.
2. ROE - Return on Equity (Quality)
What it is: A measure of financial performance calculated by dividing net income by shareholders' equity.
Goal: To find companies that are efficient at generating profits from shareholders' capital.
Default Threshold: Must be higher than 15%.
3. Total Debt to Equity (Health)
What it is: A ratio indicating the relative proportion of shareholders' equity and debt used to finance a company's assets.
Calculation: This script manually calculates this ratio by fetching TOTAL_DEBT and dividing it by TOTAL_EQUITY from fundamental data to ensure robustness across different symbols.
Goal: To ensure the company is not overly leveraged.
Default Threshold: Must be lower than 1.5.
4. Beta (Risk/Volatility)
What it is: A measure of a stock's volatility in relation to the overall market (S&P 500).
Calculation: It is calculated by comparing the asset's returns against SPY (S&P 500 ETF) returns over a 252-day period (approx. 1 trading year).
Goal: To understand if the stock is more volatile (Beta > 1) or less volatile (Beta < 1) than the market.
Note: Beta does not affect the final "Quality" score but serves as an extra risk indicator, highlighting in orange if Beta > 1.
The Verdict (Scoring System)
The indicator assigns a score from 0 to 3 based on the first three fundamental metrics (Size, ROE, and Debt/Equity).
If a metric passes the threshold, it gets a green background and +1 point.
If it fails, it gets a red background.
Final Verdict:
💎 QUALITY GEM: The company passed all 3 fundamental checks (Score = 3/3).
⚠️ DISCARD: The company failed one or more fundamental checks.
Settings
You can customize the thresholds to fit your own investment strategy in the indicator settings:
Minimum Market Cap (in Billions).
Minimum ROE (%).
Maximum Debt/Equity Ratio.
Disclaimer: This tool is for informational and educational purposes only. It relies on third-party fundamental data which may sometimes be delayed or unavailable. Do not base investment decisions solely on this indicator.

Smart Money Time by TMUSMT-Integrated Institutional Structure
This solution addresses a critical limitation in retail technical analysis: Fractal Blindness. While standard indicators operate linearly on a single timeframe, this script utilizes a Synchronous Multi-Timeframe (MTF) Architecture combined with SMT (Smart Money Time) logic to overlay higher-order market structure directly onto your execution chart.
It is engineered to align your entry triggers with the dominant institutional trend, effectively filtering out counter-trend noise that often leads to liquidity sweeps.
Core Technology: The "Fractal-Sync" Engine
1. Hierarchical Trend Propagation (MTF Logic) The script performs a real-time request.security analysis of user-selected higher timeframes to determine the "True State" of the market.
The Mechanism: Instead of repainting historical data, the algorithm uses a Step-Locked logic. It projects the confirmed Swing Highs and Lows of the Higher Timeframe (e.g., 4H) onto your Lower Timeframe (e.g., 5m or 15m).
Practical Value: You instantly visualize the "Big Picture" bias without switching tabs, ensuring your local trades are aligned with the global flow.
2. SMT-Grade Pivot Detection Integrating concepts from Smart Money analysis, the indicator identifies Key Swing Points that have a high probability of defense by large operators.
Technique: By calculating volatility-adjusted deviations (ATR) across multiple timeframes, the script distinguishes between a standard "pullback" and a genuine Structure Shift (MSS) or Break of Structure (BOS).
Benefit: It visually separates weak internal structure (inducement) from strong external structure (protected levels).
Technical Specifications & Filters
To satisfy strict stability requirements and provide objective signals, the engine incorporates unique validation methods:
Volatility Normalization: Structure breaks are validated against a dynamic ATR threshold. This ensures that low-volume consolidation does not trigger false structural resets.
Candle-Close Validation Protocol: A level is considered breached only if the candle body closes beyond the pivot. This filters out "Wick Fakeouts" and Stop-Hunts often seen during news events.
Conflict Resolution: When the Lower Timeframe trend contradicts the Higher Timeframe structure, the indicator visualizes this as a "Retracement Phase," advising caution.
Operational Workflow
This tool acts as a Market Context Filter, not a simple signal generator:
Trend Alignment: Use the visual cues to instantly recognize the dominant institutional flow.
Zone Identification: The script automatically plots "Strong Lows" (Invalidation Points) and "Weak Highs" (Targets).
Execution: Seek entries on your timeframe only when the higher timeframe structure (shown by this script) confirms the direction.
Note for Professional Use: This script is designed for precision execution. It minimizes chart clutter by displaying only confirmed structural points, providing a clean, logic-driven workspace for objective decision-making.

Reversal Pro v2 Reversal Pro v2 + Kernel Trend Line
© HighlanderOne – 2025
The ultimate confluence of institutional liquidity grabs + adaptive trend filtering.
Core Strategy – V-Reversal (Liquidity Sweep + Reclaim)
This indicator detects when price makes an aggressive move that sweeps nearly all recent lows (or highs) in the last 20 candles — a classic smart-money stop-hunt.
Once the sweep candle is identified, it waits for price to reclaim above the sweep low (bullish) or below the sweep high (bearish) within the next few bars.
That reclaim is the exact moment the real directional move begins.
Key improvements over classic versions:
• Uses ≥ (lookback – 2) instead of strict equality → catches more real sweeps without adding noise
• Optional true non-repainting mode (signal appears only on the close of the confirmation bar)
• Extremely clean, high-probability reversal signals (usually 2–6 per week on 1h–4h)
Smoothed Kernel Regression Trend Line (exactly like the legendary KTrend)
A secondary rational-quadratic kernel regression is plotted on top with a Gaussian lag filter.
The line changes colour based on short-term vs long-term kernel relationship:
• Teal/Green → Uptrend confirmed
• Maroon/Red → Downtrend confirmed
How to trade it (my exact rules – the way I actually use it every day)
Entry Rules
Long: Green V appears + Kernel line is green or turns green within 1–2 bars
Short: Red V appears + Kernel line is red or turns red within 1–2 bars
Trade Management – Stay in the trade using the Kernel line
• Trail your stop under the Kernel line (for longs) or above it (for shorts)
• Never exit just because of a new opposite V — wait for the Kernel line to actually change colour
• If the Kernel line stays your colour for 10–20+ bars, let the trade run — these become the massive 5:1 – 15:1 winners
• Only exit early if the Kernel line flips colour — that is your objective “trend over” signal
Best timeframes
• 15m & 1h → scalping / day trading
• 4h & Daily → swing trading monsters
Best markets
Works insanely well on: BTC/USD, ETH/USD, NAS100, SPX500, Gold, EURUSD, GBPUSD, USDJPY
This is not just another reversal indicator.
It’s institutional order-flow detection + adaptive trend filtering in one clean script.
High win-rate entries.
Objective trend-based exits.
Zero repainting (when enabled).
Pure price action.
Trade it exactly as described and you will never need another reversal system again.
Enjoy the edge.
– HighlanderOne

SMT [Advanced] by TMUThis is a proprietary technical analysis tool designed to detect SMT (Smart Money Time) Divergences with a specific focus on Time-Cycle Theory and advanced Data Visualization.
Originality & Technical Uniqueness Unlike standard open-source SMT indicators that simply compare Highs/Lows and clutter the chart with overlapping text, this script utilizes a custom-built "Label Registry & Stacking Engine". Standard indicators often fail when multiple divergences occur simultaneously on different timeframes. This script solves this problem using a proprietary deferred rendering algorithm:
Registry System: Instead of drawing signals immediately, the script calculates potential divergences across multiple assets/timeframes and pushes them into a dynamic array (registry).
Dynamic Stacking: A background sorting algorithm processes this stack every bar, groups signals by their timestamp and type, and renders them with calculated offsets. This ensures labels never overlap, providing a clean, professional workspace impossible to achieve with basic plotting functions.
Signal Rotation: It implements a "rotation manager" logic for 90-minute cycles. As price action evolves, the script automatically assesses whether to update an existing divergence line or create a new historical reference, keeping the analysis strictly relevant to the current cycle structure.
How it Works (Methodology) The script performs a relative strength analysis between two correlated assets (e.g., ES vs. YM) using request.security to fetch comparative data.
Pivot Analysis: It identifies structural Pivot Highs and Lows based on a configurable length, filtering out minor internal noise.
Divergence Logic:
Bearish SMT: Validated when the primary asset makes a Higher High while the comparison asset makes a Lower High.
Bullish SMT: Validated when the primary asset makes a Lower Low while the comparison asset makes a Higher Low.
Time-Cycle Isolation: The analysis is confined within strictly defined temporal windows (Daily, Weekly, and custom 90-minute intraday blocks). The script detects cracks in correlation specifically within these isolated sessions rather than looking at infinite history.
Features
Smart Filter: Advanced logic to filter out "Internal" structure and focus only on major external pivot breaches.
Multi-Cycle Dashboard: A real-time table monitoring the SMT status of Monthly, Weekly, Daily, and intraday cycles simultaneously.
Auto-Ticker Selection: Automatically detects the current asset class (Indices/Forex) and selects the appropriate comparison symbol (e.g., selects YM when viewing ES).
Settings
Comparisons: Manual or Auto-ticker selection.
Visuals: Custom colors, line styles, and label positioning modes.
Alerts: Customizable alerts for valid SMT formation on any monitored timeframe.

RTH Gap & Stdev [Sword & Shield]Dynamic RTH Gap & Stdev - Technical Description
Description
This script implements a specialized methodology for analyzing the Regular Trading Hours (RTH) Opening Gap, focusing on the "void" created between the previous session's RTH Close and the current session's RTH Open. Unlike standard gap indicators that may reference the Settlement or pre-market range, this tool isolates the specific liquidity gap formed by the primary session auction.
The script is designed to help traders identify:
The Gap Zone: The precise price range where no RTH trading occurred.
Internal Quartiles: Key harmonic subdivisions (25%, 50%, 75%) within the gap, often serving as intraday support/resistance.
Expansion Targets: Projected volatility levels (Standard Deviations) above and below the gap.
Mitigation State: Real-time tracking of how much of the gap has been "filled" by price action.
Underlying Concepts & Calculations
1. RTH Session Detection
The indicator strictly follows asset-specific timetables (e.g., Indices 09:30-16:00 ET). It detects the RTH Close of the previous day (closing print of the last RTH bar) and the RTH Open of the current day.
Gap High: Max(PrevClose, CurOpen)
Gap Low: Min(PrevClose, CurOpen)
2. Quartile & Harmonic Levels
We divide the gap range (GapHigh - GapLow) into quartiles. The 50% level (Consequent Encroachment) is a widely recognized equilibrium point in gap trading.
Formula: Level(x) = GapLow + (GapRange * x) where x is 0.25, 0.50, 0.75.
3. Volatility Projections (Standard Deviations)
The script offers two distinct volatility models for projecting targets:
Gap Range Basis: A harmonic expansion model where 1.0σ (Standard Deviation) is rigidly defined as 100% of the Gap Range. This assumes the market often expands in multiples of the initial opening impulse.
Calculation: +1.0σ Level = GapHigh + GapRange
VWAP Bands Basis: A statistical model estimating daily volatility using the deviation of price from the VWAP (Volume Weighted Average Price) from the previous session. This allows the bands to adapt to the broader market volatility rather than just the gap size.
4. Dynamic Extension & Clamping
Uniquely, this script uses a forward-projection bar-loop. Lines and labels are instantiated at the Open and extended incrementally with each new bar.
Clamping: The script calculates the precise timestamp of the RTH Close and clamps all drawing objects to this time. This prevents lines from extending into the post-market or next day, ensuring a clean chart layout.
5. Mitigation Tracking
The dashboard calculates the Unmitigated Percentage of the gap:
Logic: It tracks the session's Highest High and Lowest Low.
Calculation: FilledRange = PriceExtreme - GapBoundary.
Status: displayed as "Unmitigated, 100% rem" or "Mitigated XX%", providing a precise metric for gap-fill strategies.
Usage
Traders can use this tool to:
Target the 50% fill described as "Consequent Encroachment".
Fade extremes at +1.0σ gap expansions.
Monitor the "Mitigation %" to gauge trend strength (e.g., a gap that remains <20% filled often indicates a strong trend day).

Market Cycle VisualizerPlots a customizable time-based grid on your chart to visualize market cycles. Draws vertical boundaries at interval starts, horizontal opening lines, and tracks high/low ranges within each period. Ideal for identifying recurring patterns and structure across custom timeframes.

智能趋势-多周期动态信号 Smart Trend Oscillator MTF V1🚀 智能趋势-多周期动态信号 Smart Trend Oscillator MTF V1
—— 让交易像红绿灯一样简单直观 | Making Trading as Simple as Traffic Lights
告别复杂的参数设置,把市场噪音变成明确的信号。 Say goodbye to complex parameters. Turn market noise into clear signals.
🌟 它是做什么的? / What Does It Do?
“智能趋势管家” 就像您的私人交易副驾驶。它内置了一套先进的智能平滑算法,能够自动过滤掉市场中那些骗人的假动作,只把最核心的**“市场真实韵律”通过一条平滑的波浪线展示给您。它不只是一根线,它是一套会思考的系统**。
"Smart Trend Oscillator " is like your personal trading co-pilot. It features a built-in advanced smoothing algorithm that automatically filters out deceptive market "fake-outs," revealing the "true rhythm" of the market through a single, smooth wave. It’s not just a line; it’s a thinking system.
🔥 核心功能 / Core Features
1. 🌊 智能波浪引擎 / Smart Wave Engine
不要被K线的上蹿下跳迷惑。我们的引擎能识别市场内部的真实能量。 Don't be confused by erratic candlesticks. Our engine identifies the true internal energy of the market.
过滤噪音 (Filter Noise):自动忽略短暂的随机波动。
捕捉趋势 (Capture Trends):波浪上升代表买方主导,波浪下降代表卖方主导。
2. 🛡️ 自适应波动通道 / Adaptive Channels
市场有时候像乌龟(波动小),有时候像兔子(波动大)。指标拥有一个“弹性通道”,它会根据市场活跃度自动变宽或变窄,精准判断价格是否“过热”或“超卖”。 The market moves between low and high volatility. The indicator features an "elastic channel" that automatically widens or narrows, accurately judging if the price is "Overheated" or "Oversold."
3. 🌍 全局监控面板 / Global Dashboard
右上角的面板是您的战况指挥室。一眼看懂 6 个不同时间维度的状态。全绿代表多周期共振向上,全红代表多周期共振向下。 The panel in the top-right corner is your Command Center. Understand the status of 6 different time dimensions at a glance. All Green means upward resonance; All Red means downward resonance.
⚙️ 极致的个性化定制 / Ultimate Customization
v16 版本为您提供了前所未有的控制权,让指标完全适应您的交易风格。 Version 16 gives you unprecedented control to tailor the indicator to your trading style.
🕒 1. 时间周期,由你定义 (Customizable Timeframes)
不再局限于系统默认设置。您可以在设置面板中自由输入 6 个您最关心的周期(例如:5分钟、1小时、甚至 3天)。
短线手:设置为 1分/3分/5分/15分...
波段手:设置为 1小时/4小时/日线/周线...
Benefit: You can freely input the 6 timeframes that matter most to you in the settings panel, whether you are a scalper or a swing trader.
🎯 2. 灵敏度调节 (Adjustable Sensitivity)
想要更多交易机会?还是想要更稳健的信号?
高灵敏度:调高 Zone Sensitivity,捕捉每一次微小的回调(适合激进风格)。
低灵敏度:调低数值,过滤掉小波动,只抓大趋势(适合稳健风格)。
Benefit: Dial up the sensitivity to catch every minor pullback (Aggressive), or dial it down to filter noise and catch only big trends (Conservative).
📊 3. 两种平滑模式 (SMA vs. VWMA)
您可以选择通道的计算核心:
Standard (SMA):经典模式,适合大多数市场。
Volume Weighted (VWMA):成交量加权模式。在加密货币或股票市场,它能帮您过滤掉“无量空涨”或“无量空跌”的假信号。
Benefit: Choose Standard (SMA) for general markets, or Volume Weighted (VWMA) to filter out fake moves on low volume (great for Crypto/Stocks).
🚦 信号含义 / Signals Guide
我们把复杂的逻辑浓缩成了最简单的视觉标签: We have condensed complex logic into the simplest visual labels:
🟢 绿色 BUY 标签:市场“便宜”且能量向上。 (Market is "Cheap" & Energy is Up.)
🔴 红色 SELL 标签:市场“过热”且能量向下。 (Market is "Overheated" & Energy is Down.)
🔵 蓝色 HOLD 标签:趋势延续中,建议持仓。 (Trend is continuing, suggest holding position.)
📥 快速上手 / Quick Start
加载指标 (Load):添加到您的图表。
设置周期 (Set Timeframes):在输入选项里填入您习惯查看的 6 个时间周期。
选择模式 (Choose Mode):如果是成交量重要的资产,建议开启 VWMA 模式。
等信号 (Wait):等待带方框的 BUY 或 SELL 标签出现。
把复杂留给算法,把简单留给您。 Leave the complexity to the algorithms, and keep the simplicity for yourself.

Relative Strength Portofolio Strategy (RSPS) | DextraRelative Strength Portofolio Strategy (RSPS) | Dextra
Conceptual Foundation and Strategy Innovation
RSPS is a multi-asset rotation strategy that combines pairwise relative strength analysis across major cryptocurrencies with a robust market regime filter, along with an automatic safe-haven switch to Gold or USD (cash) during weakening market conditions. The strategy is designed to dynamically allocate capital to the cryptocurrency exhibiting the strongest relative dominance during bull phases, while significantly reducing exposure when overall crypto momentum fades—aiming to capture upside from the leading sector while limiting large drawdowns.
The core approach relies on a custom momentum indicator optimized for each asset pair, incorporating hysteresis to maintain signal stability and prevent excessive rotation (whipsaw). This creates a responsive rotation system that adapts to shifts in sector strength within the crypto market, focusing on capitalizing on the strongest prevailing momentum.
Market Regime Detection
Overall market regime is determined by a custom momentum indicator applied to the CRYPTO INDEX.
Gold strength is evaluated separately via a similar indicator on the Gold asset, serving as the trigger for safe-haven allocation during bearish conditions.
Pairwise Relative Strength Analysis
Relative strength is measured through pairwise comparisons between assets using custom indicator with period and threshold parameters tailored specifically to each pair—reflecting the unique volatility and historical behavior of each relationship.
Scoring System
Each asset receives a score (0–5) based on how many other assets it “outperforms” in the pairwise comparisons.
The highest score identifies the current relative leader.
During bull markets: allocation focuses on the top-scoring cryptocurrency.
During bear markets: the system switches to GOLD (if showing strength) or USD (cash) as a defensive position.
Allocation Guidance
The script defaults to suggesting 100% allocation to the selected asset to maximize exposure to the strongest momentum. However, traders can adjust exposure percentages based on personal risk tolerance—for example, allocating 70–90% to the dominant asset and keeping the remainder in USD or stablecoins to reduce portfolio volatility.
Equity Curve & Risk Metrics
Equity curve is calculated in real-time starting from a user-defined date.
Maximum Drawdown (MDD) is tracked and displayed as the primary risk metric.
Visualization and Dashboard Features
Equity Curve: Thick line plot with dynamic coloring based on the currently active asset.
Bar and Background Coloring: Transparent green during bull regime, red during bear.
Table in the bottom-right corner: Displays real-time scores for all assets (including USD and GOLD when relevant), with asset-specific background colors and highlighting for high scores.
Information Label: Shows the current active position, total ROI (as a multiplier), and MDD (%).
Assets Covered
Major cryptocurrencies: BTC, ETH, SOL, SUI, BNB, HYPE
Safe-haven assets: GOLD, USD (cash)
It performs best on the daily (1D) timeframe, where noise is reduced and signal reliability is higher.
Summary
RSPS | Dextra provides a fully automated asset rotation framework based on pairwise relative strength with pair-specific parameters, combined with clear market regime detection and risk-off mechanics. With its comprehensive visual dashboard (score table, colored equity curve, and real-time performance metrics), the script serves as a powerful decision-support tool for navigating crypto market dynamics—capturing upside from leading sectors while protecting capital during downturns.
