Institutional Execution Engine v3 [Nishith Rajwar]
Institutional Execution Engine v3
Market-Structure-Driven Execution Framework (Indicator + Strategy Hybrid)
The **Institutional Execution Engine v3** is a professional-grade execution framework designed to model **how institutional participants interact with liquidity, volatility regimes, and market structure**.
It is built for **index traders, crypto traders, and systematic intraday participants** who require **non-repainting, forward-validated signals** with strict risk control.
This is **not a mashup of indicators**.
Every module is purpose-built and interacts through a unified execution pipeline.
---
🔍 Core Concepts & Methodology
1️⃣ Market Structure & POI Engine
* Identifies **Points of Interest (POIs)** using swing structure, volatility context, and liquidity positioning
* POIs are **confirmed only after bar close** (strict non-repaint enforcement)
* Adaptive pivot sensitivity based on selected execution preset
2️⃣ Liquidity-Aware Scoring System
Each potential trade is filtered through a **multi-factor execution score**, including:
* Structural alignment
* Volatility normalization (ATR regime)
* Liquidity reaction quality
* Directional efficiency
Trades are only allowed when the **minimum institutional score threshold** is met.
3️⃣ Regime Detection (Forward-Walk Safe)
The engine dynamically classifies market conditions into execution regimes:
* Trending
* Rotational
* Mean-reverting
Regime detection is **forward-walk compatible** and does **not leak future data**.
4️⃣ Risk-First Execution Model
* ATR-normalized stop placement
* R-multiple-based take-profit targeting
* Optional **single-trade-per-session guard**
* Strategy engine includes **open-trade protection** to prevent over-execution
5️⃣ Strategy + Indicator Hybrid
This script can be used in **two ways**:
* **Indicator mode** → discretionary execution with visual POIs, signals, and context
* **Strategy mode** → systematic backtesting with full TradingView Strategy Tester support
Both modes share the **same execution logic** (no divergence).
---
⚙️ Preset-Driven Architecture
Built-in execution presets auto-configure internal parameters without changing core logic:
* **Scalp (Index)**
* **Daytrade (Index)**
* **Crypto Intraday**
* **Institutional Research (FWalk)**
Presets adjust pivot sensitivity, score thresholds, ATR behavior, and risk profile — while preserving execution integrity.
---
## 🚫 Non-Repainting & Data Integrity
* No look-ahead bias
* No future bar references
* No repainting signals
* VWAP and regime logic reset correctly per session
* Safe handling of strategy.opentrades to avoid execution errors
All signals are **bar-close confirmed**.
---
📊 Who This Is For
✔ Index traders (NIFTY / BANKNIFTY / SENSEX)
✔ Crypto intraday traders
✔ Systematic traders validating execution logic
✔ Traders who value **structure + liquidity + risk discipline** over indicators
---
⚠️ Disclaimer
This script is a **research and execution framework**, not financial advice.
Always forward-test and adapt risk parameters to your instrument and timeframe.
---
**Author:** Nishith Rajwar
**Version:** v3
**Execution Philosophy:** Trade where institutions execute — not where indicators react.
วัฏจักร

FTSE Santa - Late Dec 12d (Optimised Exit)Simple Santa Rally Strategy. Once a year, in late December, it waits for a sensible (non-spiky) day to get long FTSE, then either stops out around −4%, gets trailed out in profit if it rallies, or exits after about 12 trading days.

ARVEX V1“Failed Reversal – Opposite Candle Only (No Doji/Hammer/Hanging Man)”:
This strategy captures failed reversal attempts where the current candle is opposite to the previous candle and volume is higher. It enters long if a bearish candle fails to break a previous bullish candle’s low, and short if a bullish candle fails to break a previous bearish candle’s high. Signals are canceled for Doji, Hammer, or Hanging Man candles. Entries only, fully backtestable.

Deviation Burn + Pivots + Advanced stop + Midpoint CancelA session-based range strategy that places buy and sell orders at the session high and low, expecting price reactions from these levels.
Additional filters help avoid low-probability trades.

Follow the "Smart Money" to Capture Altcoin Super-Trends這不是一套普通的趨勢策略。大多數山寨幣 (Altcoins) 的突破策略之所以失效,是因為它們忽略了市場的真實驅動力——比特幣的機構資金流向。 ITAS (Institutional Triggered Alpha System) 是一套結合了「跨市場分析」與「波動率自適應」的量化系統。
核心運作邏輯:
機構資金濾網 (Institutional Filter): 我們監控比特幣 (BTC) 在頂級合規交易所(如 Coinbase)與全球流動性池之間的資金溢價 (Premium)。這是一個領先指標,用來判斷華爾街機構是在「吸籌」還是「派發」。
精準狙擊 (Precision Trigger): 只有當監測到**「機構資金正在買入 BTC」**的時刻,系統才會解鎖山寨幣的交易權限。
拒絕假突破 (False Breakout Rejection): 透過這個濾網,我們能過濾掉市場中 80% 由散戶情緒引起的「假突破」。如果比特幣沒有機構支撐,就算山寨幣漲得再兇,本策略也會判定為雜訊而拒絕進場。
波動率適配 (Volatility Adaptation): 針對高波動資產 (High Beta Assets) 優化的動態通道,確保在劇烈洗盤中能拿住單子,吃到完整的波段利潤。
This is not an ordinary trend-following strategy. Most Altcoin breakout strategies fail because they ignore the true driver of the market—Institutional Money Flow in Bitcoin. ITAS (Institutional Triggered Alpha System) is a quantitative system that combines "Inter-market Analysis" with "Volatility Adaptation."
How It Works:
Institutional Filter: We monitor the Premium Gap of Bitcoin (BTC) between top-tier regulated exchanges (like Coinbase) and global liquidity pools. This serves as a leading indicator to determine whether Wall Street institutions are "Accumulating" or "Distributing."
Precision Trigger: The system only unlocks trading permissions for Altcoins when it detects "Institutional Buying in BTC."
False Breakout Rejection: Through this filter, we effectively filter out 80% of "False Breakouts" driven solely by retail sentiment. If there is no institutional support behind Bitcoin, the strategy will identify any Altcoin pump as noise and refuse to enter.
Volatility Adaptation: Features a dynamic channel optimized for High Beta Assets, ensuring positions are held through aggressive shakeouts to capture the full trend.
免責聲明 (Disclaimer)
補充說明: 以上策略績效源自歷史數據回測,不代表對未來獲利的保證。加密貨幣市場風險極高,本策略僅供量化研究與邏輯分享,使用者應自行評估風險並自負盈虧,本人不承擔任何交易損失。
Disclaimer: The performance above is based on historical backtesting and does not guarantee future results. Cryptocurrency trading involves high risk. This strategy is shared for quantitative research and educational purposes only. Users are solely responsible for their own risk assessment and PnL. I assume no liability for any trading losses incurred.

TDZZ ETH 15min Vault: No-Loss Martin Gale StrategyStrategy Overview
The ETH 15min Vault is an enhanced, high-frequency Martin Gale strategy designed specifically for Ethereum on the 15-minute chart. Its core innovation lies in integrating pre-calculated margin management with a multi-layer exit system, transforming the traditional high-risk Martingale approach into a controlled, calculated growth engine. The strategy aims for sustainable compound growth of small capitals (e.g., 1000U) in ranging markets while systematically eliminating the risk of account blow-up.
Core Concept: The "No-Loss" Guarantee
Unlike conventional Martingale systems that risk infinite losses, this strategy pre-calculates and logically reserves the total margin required for all potential layers (configurable, e.g., up to 30) at the initial entry. This ensures sufficient capital is always available for the next averaging order, preventing liquidation due to margin shortage. Combined with intelligent, proactive take-profit and safety-net closures, it creates a theoretically "No-Loss" framework for the Martin Gale method.
Key Mechanisms
1、Smart Position Averaging:
Averaging distances expand geometrically (configurable multiplier), preventing rapid layer depletion during sharp drops.
Averaging order size increases progressively (configurable multiplier) to effectively lower the break-even point.
2、Dynamic Multi-Stage Exit Logic:
Rebound TP: Partially closes a position when price rebounds a certain percentage from its entry, locking in profits early during oscillations.
Cycle TP: Closes the remaining position upon reaching the primary profit target, which is dynamically recalculated after each average to reflect the new aggregate cost.
Safety-Net Close (Defense Mode): Activates after a defined number of averages. Triggers a full exit if price: a) rallies significantly from the lowest point, b) retraces from a recent high, or c) fails to make a new low within a set time. This forms the final protective layer for capital preservation.
Main Advantages
✅ True Risk Isolation: Transforms Martingale's "unlimited risk" into a "defined and manageable drawdown" via pre-calculated margins and safety-net exits.
✅ Active Profit Capture: The "Rebound TP" mechanism increases win rate and capital efficiency in ranging markets.
✅ Adaptive to Volatility: Adjustable parameters for averaging distance and size allow tuning for different market conditions.
✅ High-Frequency Compounding Potential: Operates on the 15-min timeframe, offering numerous opportunities to complete profit cycles in consolidating phases.
Configuration & Parameters
Key adjustable inputs include: Initial Capital %, Averaging Distance % and Multiplier, Order Size Multiplier, Max Layers, Take-Profit %, Rebound Close %, and all Defense Mode thresholds.
This strategy significantly reduces liquidation risk through its design but does not eliminate trading risk. Substantial drawdowns can occur during strong, sustained trends. "No-Loss" refers to prevention of margin-call liquidation, not guaranteed profitability. Always conduct thorough backtesting and forward testing in a simulated environment before committing real capital. Past performance is not indicative of future results. Trade responsibly.

Coinbase Institutional Flow Alpha1. 核心概念 (The Core Concept)
這不是一套傳統看圖形(如 RSI 或 MACD)的技術指標策略,而是一套基於**「籌碼面」與「市場微結構」的量化系統。 比特幣市場存在兩個平行世界:美國機構投資者(主要使用 Coinbase 美元對)與全球散戶**(主要使用 Binance USDT 對)。這套策略的核心邏輯在於捕捉這兩者之間的**「定價效率落差」**。
This is not a traditional technical analysis strategy based on lagging indicators like RSI or MACD. Instead, it is a quantitative system based on Order Flow and Market Microstructure. The Bitcoin market consists of two parallel worlds: US Institutional Investors (trading on Coinbase USD pairs) and Global Retail Investors (trading on Binance USDT pairs). The core logic of this strategy is to capture the pricing inefficiency gap between these two liquidity pools.
2. 運作原理 (How It Works)
Smart Money 追蹤: 當機構開始大舉買入時,Coinbase 的價格往往會比 Binance 出現短暫且顯著的「溢價(Premium)」。這通常是行情的領先指標。
統計套利模型: 我們開發了一套獨家的演算法,24 小時監控這個溢價缺口的變化。只有當溢價偏離程度達到特定的**統計學異常值(Statistical Anomaly)**時,系統才會判定為「機構進場信號」並執行交易。
過濾雜訊: 我們只抓取真正由資金推動的大趨勢,過濾掉市場上 80% 的無效波動。
Smart Money Tracking: When institutions accumulate heavily, the price on Coinbase often trades at a significant "Premium" compared to Binance. This serves as a powerful leading indicator for price trends.
Statistical Arbitrage Model: We utilize a proprietary algorithm that monitors this premium gap 24/7. Only when the gap deviation hits a specific Statistical Anomaly, does the system identify it as an "Institutional Entry Signal" and execute the trade.
Noise Filtering: The strategy is designed to capture significant trends driven by real capital flow, effectively filtering out 80% of random market noise.
免責聲明 (Disclaimer)
補充說明: 以上策略不保證獲利,僅提供量化交易的想法與實驗數據參考。請注意,市場沒有聖杯,交易結果盈虧自負,本人不承擔任何因使用此策略而產生的資金損失。
Disclaimer: The above strategy does not guarantee profits and is provided solely for sharing quantitative ideas and experimental data. Please note that there is no "Holy Grail" in trading. You are solely responsible for your own PnL, and I assume no liability for any financial losses incurred.


CRYPTO HELPERThis works on most large crypto currencies and beats a buy a hold strategy for the most part
it can work for some volatile stocks as well.
Try it out and adjust but 1 day seems to work best for time frames

S&P 500: 300-Day Trend FollowerSIMPLE STRAT FOR MACRO ETFs
The 300-day Moving Average is a very slow, long-term filter.
Pros: It keeps you in the market during massive bull runs (like 2013-2019) without shaking you out on minor dips.
Cons: It is slow to react. If the market crashes fast (like COVID in 2020), price might drop 15-20% before it crosses the line and tells you to sell.

Macro-Filtered Volatility Breakout (MVB)策略簡介:
這是一套專門針對高 Beta 值資產(如 ETH, SOL 等山寨幣)設計的趨勢跟隨系統。我們解決了傳統突破策略在山寨幣市場中「假突破(False Breakout)」過多的痛點。
核心邏輯:
市場體制過濾(Regime Filtering): 加密貨幣市場具有高度的相關性。本策略引入比特幣(BTC)作為**「宏觀市場指標」**,只有當 BTC 處於確立的多頭趨勢時,才允許執行山寨幣的做多信號。這有效規避了「大盤崩盤時,小幣假突破」的系統性風險。
動態波動率通道: 我們不使用固定價格止損,而是採用肯特納通道(Keltner Channels)。這利用 ATR(平均真實波幅)動態調整進出場區間:在市場平靜時通道收窄以敏銳捕捉啟動點,在劇烈波動時通道放寬以避免被雜訊洗出場。
風控特徵:
系統性避險: 透過 BTC 趨勢濾網,在熊市或大盤回調期間自動空手,降低回撤。
獲利奔跑(Let Profits Run): 採用基於波動率的移動止損(Volatility Trailing Stop),在大趨勢中能吃到完整的魚身。
免責聲明:
以上策略分享僅供學術研究、回測實驗與邏輯參考,並不代表對未來獲利的保證。 過往的回測績效不代表未來的行情表現。本文內容不構成任何投資建議。加密貨幣交易具有高度風險,使用者應自行評估風險承受能力並自負盈虧,本人不承擔任何因使用此策略而產生的資金損失。
Strategy Overview
This is a trend-following system specifically designed for high-beta assets, such as altcoins like ETH, SOL, and similar cryptocurrencies. The strategy addresses a key weakness of traditional breakout systems in altcoin markets—the high frequency of false breakouts.
Core Logic
Market Regime Filtering
The cryptocurrency market exhibits strong cross-asset correlation. This strategy uses Bitcoin (BTC) as a macro market indicator. Long signals on altcoins are only allowed when BTC is in a confirmed bullish trend, effectively avoiding the systemic risk of altcoin false breakouts during broader market downturns.
Dynamic Volatility Channels
Instead of fixed-price stop losses, the strategy employs Keltner Channels, which adapt dynamically using ATR (Average True Range).
During low-volatility conditions, the channel narrows to sensitively capture early trend initiation.
During high-volatility environments, the channel widens to prevent premature exits caused by market noise.
Risk Management Features
Systematic Risk Avoidance
By applying BTC trend filtering, the strategy automatically stays in cash during bear markets or major market pullbacks, significantly reducing drawdowns.
Let Profits Run
A volatility-based trailing stop is used to maximize profit capture during strong directional trends, allowing positions to benefit from the full trend structure.
Disclaimer
The strategy presented above is for academic research, backtesting experiments, and logical reference only. It does not constitute a guarantee of future performance. Past backtest results are not indicative of future outcomes. This content does not represent any investment advice. Cryptocurrency trading involves substantial risk, and users should assess their own risk tolerance and assume full responsibility for any gains or losses. The author bears no liability for any financial losses incurred from the use of this strategy.

Monarch Strategies Altcoin Optimized Cycle & Trend Strategy (1W)The Altcoin Optimized Cycle & Trend Strategy (1W) is a professional, long-term cycle and trend trading strategy designed specifically for altcoins such as Stellar (XLM). It is built for traders and investors who want to systematically capture explosive altcoin cycles while avoiding emotional decision-making and excessive trading.
The strategy operates on the weekly timeframe (1W) and focuses on identifying major accumulation zones, breakout phases, and distribution tops that typically define altcoin market behavior.

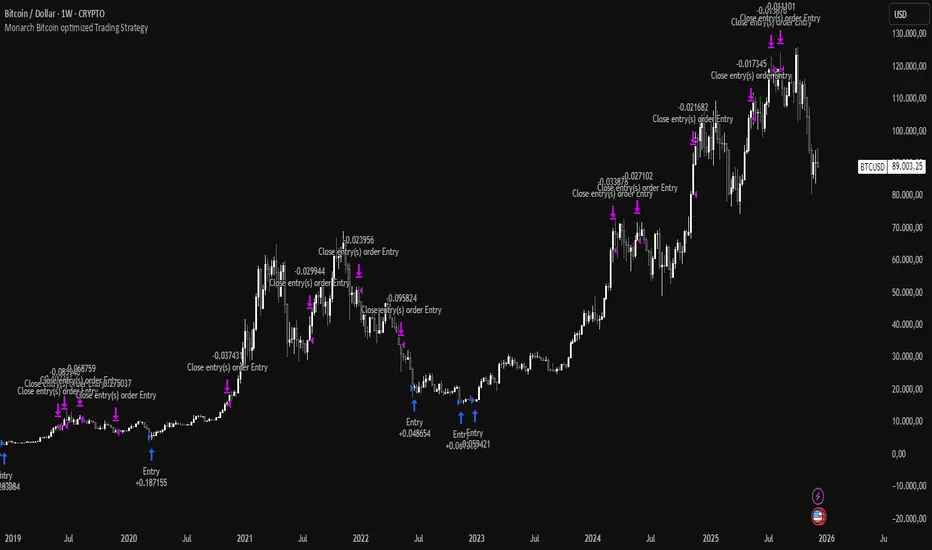
Monarch Strategies BTC Optimized Cycle & Trend Strategy (1W)The "BTC Optimized Cycle & Trend Strategy (1W)" is a high-quality, long-term optimized trading strategy for BTC/USD, designed for traders and investors who want to systematically trade major market cycles — without overtrading, without emotions, and without unnecessary complexity.
The strategy is specifically built for the weekly timeframe (1W) and focuses on what Bitcoin has historically done best: strong, multi-year trend movements.
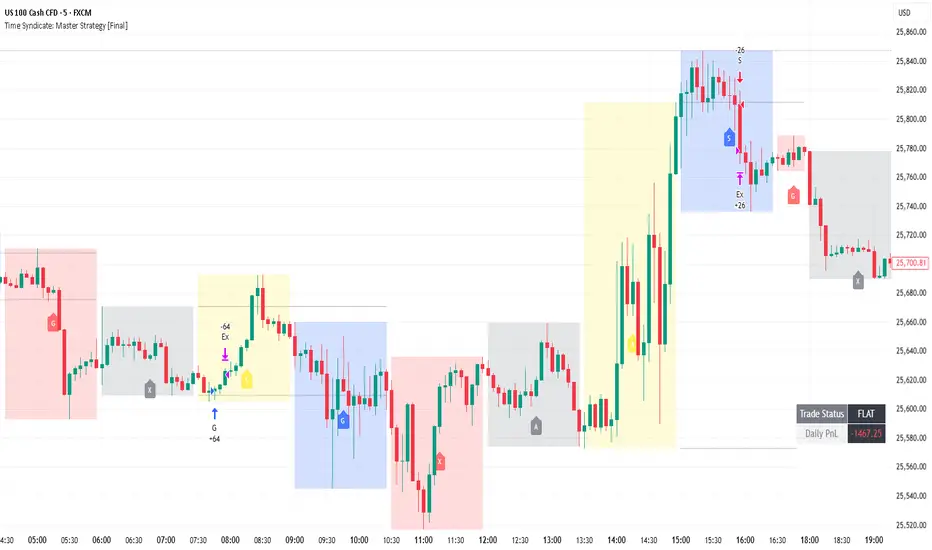
Time Syndicate: Prop Firm SpecialTime Syndicate – Prop-Firm Special (Exit-Focused Edition)
Overview
Time Syndicate – Master Strategy is a non-repainting, cycle-aware execution framework designed to trade structured market phases rather than random price movement.
This version has been specifically updated to focus on exit efficiency , trade management, and controlled trade churn.
The strategy is built to align trades with time-based market behavior and liquidity expansion, without relying on indicator stacking or repainting logic.
What This Version Is Optimized For
This update emphasizes:
• More structured exits
• Increased trade churning
• Improved realized profitability
• Mechanical trailing stop execution
The goal is not to increase entries, but to extract more value from correct ones .
Recommended Markets
• EUR/USD
• NASDAQ (NQ / US100 Cash CFD)
This strategy is primarily designed and tested for these instruments.
Recommended Cycles & Timeframes
90-Minute Cycle → Use 1-Minute chart
Session Cycle → Use 5-Minute chart
Do not mismatch cycle selection and chart timeframe.
Important Settings (Do Not Over-Optimize)
• Exit Mode: Trailing Stop (Default & Recommended)
• Max Trades Per Cycle: 1
• Target: 1 : 1.5
• Most other settings should remain unchanged
This is not a parameter-tuning strategy.
Trade Behavior
• Trade Status remains FLAT until a valid trade is triggered
• After entry, the dashboard displays:
– Entry Price
– Initial Stop Loss
– Trailing Trigger Level
– Live Trailing Stop (once activated)
In most cases, the entry candle’s low/high will act as the initial stop loss.
Exit Logic
Trailing Stop Mode
• Trailing activates only after price reaches the required expansion level
• Trailing is mechanical and non-emotional
• Live trailing stop updates are shown clearly on the chart
Fixed Target Mode
• Available for testing purposes
• Not recommended for live execution
Non-Repainting Logic
• All zones, cycles, and trade logic are non-repainting
• No historical shifting
• What appears live is final
Known Limitations (Current Version)
• Quantity calculation can be aggressive, especially on 1-minute charts
• Manual quantity is recommended for now
• Not every valid signal should be traded
These will be refined in future updates.
Recommended Trading Window
For US100 Cash CFD:
4:00 PM – 8:00 PM IST
Outside this window, liquidity behavior becomes inconsistent.
Advanced Usage Tip
Download strategy trade data and analyze:
• Time of day
• Cycle performance
• Trade outcomes
Use this data to determine the most effective trading hours for your instrument.
Purpose of This Strategy
This is not a signal-spamming indicator.
It is a professional execution framework built to:
• Enforce discipline
• Improve exit quality
• Reduce emotional decision-making
• Align trades with structured market phases
Final Note
This strategy does not predict the market.
It waits, reacts, and extracts.
Use it with patience, proper risk control, and respect for time-based structure.
Capitulation Detector StrategyA multi-factor capitulation detector designed to identify exhaustion points in extended trends. It focuses on fading capitulation moves after multi-leg trends with extreme volume and price extension.
━━━━━━━━━━━━━━━━━━━━━━━━━━━━━━━━━━━━━━━━
THE CONCEPT
Capitulation occurs when the last holders give up — panic selling into lows or euphoric buying into highs. These moments create asymmetric opportunities because:
Sentiment becomes maximally skewed
Weak hands are flushed out
Price deviates far from equilibrium
The "fuel" for continuation is exhausted
━━━━━━━━━━━━━━━━━━━━━━━━━━━━━━━━━━━━━━━━
THE 6 FACTORS
Trend Persistence — Price stays on one side of 38 EMA for 12+ bars, confirming a sustained directional move
Acceleration — Price stays on one side of 5 EMA for 3+ bars, showing the move is accelerating into exhaustion
Volume Spike — Current bar volume ≥ 2x the 20-bar average
Body Expansion — Candle body ≥ 1.5x average, showing conviction/panic in the move
Extension — Price is 2+ ATR away from the 38 EMA, indicating overextension from equilibrium
Multi-Leg Structure — At least 3 consecutive lower lows (for longs) or higher highs (for shorts)
━━━━━━━━━━━━━━━━━━━━━━━━━━━━━━━━━━━━━━━━
SIGNAL LOGIC
Bullish Capitulation: 4+ factors align + price below 38 EMA + down candle + volume spike
Bearish Capitulation: 4+ factors align + price above 38 EMA + up candle + volume spike
The strategy enters counter-trend, fading the exhaustion move.
━━━━━━━━━━━━━━━━━━━━━━━━━━━━━━━━━━━━━━━━
EXIT OPTIONS
ATR-based stop loss (default: 2 ATR)
ATR-based take profit (default: 3 ATR)
Optional trailing stop
Time filter for session-specific trading
━━━━━━━━━━━━━━━━━━━━━━━━━━━━━━━━━━━━━━━━
BEST PRACTICES
Works best on liquid instruments with clean trends
More reliable after 3+ legs in the trend
Higher conviction when daily AND intraday timeframes align
"The bigger and more extended, the better"
Consider VWAP as additional confirmation (not coded here)
━━━━━━━━━━━━━━━━━━━━━━━━━━━━━━━━━━━━━━━━
SETTINGS GUIDE
Min Score: Increase for fewer, higher-quality signals
Volume Spike Multiplier: 2x; increase for stricter filter
Extension ATR: Higher values = more overextended setups only
Trend Bars Min: Higher values = longer established trends required
━━━━━━━━━━━━━━━━━━━━━━━━━━━━━━━━━━━━━━━━
ALERTS
Bullish Capitulation (potential long)
Bearish Capitulation (potential short)
━━━━━━━━━━━━━━━━━━━━━━━━━━━━━━━━━━━━━━━━
DISCLAIMER
This is a counter-trend strategy — inherently higher risk than trend-following. Always use proper position sizing and risk management. Backtest thoroughly on your specific instruments and timeframes.

Strategy with VWRSI and SAVE orders Long or Short or BothVWRSI is very powerful indicator coded by Algo Alpha and I Make Strategy of it
But there is no stop loss instate the Strategy is using Save orders to minimize the market manipulation
The best to used is side way market with long and short enable
The Strategy trigger long or short market order -
long - ta.crossover(rsi, 20)
short - ta.crossunder(rsi, 80)
And if is not take profit from the first trade start with the save trades until will do
the sum of the first order - base order and the save order can be adjust from the user
as well the deviation from the first order
IF some user have questions let me know

Cerber Strategy ETH/BTC Cerber Strategy: High-Precision Crypto Trend Follower
The Cerber Strategy is a low-frequency, high-conviction trend following system designed to capture massive quarterly crypto moves while
filtering out 90% of consolidation noise. It combines a momentum-based "Sniper Entry" (entering only on verified breakouts) with a
"Trend Confirmation" filter (Weekly DEMA) to ensure capital is only deployed during macro bull runs.
Usage:
* Timeframe: Daily (1D) mandatory.
* Assets: Optimized for BTC and ETH, works on high-volatility alts.
* Style: Position Trading (holding for weeks/months).
* Risk: Extremely high efficiency (high Profit Factor), very low drawdown compared to Buy & Hold. Perfect for a "Set and Forget"
portfolio allocation.

Multi-MA + RSI Pullback Strategy (Jordan)1️⃣ Strategy logic I’ll code
From your screenshots:
Indicators
• EMAs: 600 / 200 / 100 / 50
• RSI: length 6, levels 80 / 20
Rules (simplified so a script can handle them):
• Use a higher-timeframe trend filter (15m or 1h) using the EMAs.
• Take entries on the chart timeframe (you can use 1m or 5m).
• Long:
• Higher-TF trend is up.
• Price is pulling back into a zone (between 50 EMA and 100 EMA on the entry timeframe – this approximates your 50–61% retrace).
• RSI crosses below 20 (oversold).
• Short:
• Higher-TF trend is down.
• Price pulls back between 50 & 100 EMAs.
• RSI crosses above 80 (overbought).
• Exits: ATR-based stop + take-profit with adjustable R:R (2:1 or 3:1).
• Max 4 trades per day.
News filter & “only trade gold” you handle manually (run it on XAUUSD and avoid news times yourself – TradingView can’t read the economic calendar from code).

SMC Pro [Stansbooth]
🔮 SMC × Fibonacci Confluence Engine — The Hidden Algorithm of the Markets
Welcome to a level of chart analysis where mathematics , market psychology , and institutional logic merge into one ultra-intelligent system.
This indicator decodes the true structure of price delivery by combining Smart Money Concepts with the timeless precision of Fibonacci ratios , revealing what retail traders can’t see — *the algorithmic heartbeat of the market*.
✨ What Makes This Indicator Different
Instead of drawing random lines or reacting to late signals, this tool **anticipates** market behavior by reading the footprints left behind by institutional algorithms. Every element is placed with purpose — every zone, every shift, every fib level — all forming a seamless narrative that explains *why* price moves the way it does.
🔥 Core Intelligence Features
Advanced BOS/CHOCH Auto-Detection — Spot structure shifts before momentum even forms.
Institutional Liquidity Mapping
— Identify liquidity pools, engineered sweeps, equal highs/lows, and trap zones designed by smart money.
Fibonacci-Aligned Precision Zones
— Auto-generated fib grids synced with SMC levels for pinpoint reversal and continuation setups.
Imbalance Engine
— FVGs, displacement, inefficiencies, and mitigation blocks displayed with crystal clarity.
Premium/Discount Algorithm
— Understand instantly whether price is in a zone of accumulation or distribution.
🚀 Designed for Traders Who Want an Edge
Whether you're scalping fast moves, capturing intraday swings, or holding higher-timeframe plays, this indicator provides a professional lens into the market. It turns complex price action into a structured, predictable system where every move has logic and every entry has confluence.
You don’t just see the chart —
you see the intention behind every push, pull, manipulation, and reversal.
💎 Why It Feels Like a Cheat Code
Because it mirrors the way institutions analyze the market:
— Identify liquidity
— Seek equilibrium
— Deliver price
— Create inefficiency
— Mitigate
— Continue the narrative
Using SMC and Fibonacci together unlocks the “algorithmic geometry” behind price movement, giving you clarity where others see chaos.
⚡ Trade With Confidence, Confluence & Control
This indicator isn’t just a tool.
It’s a complete trading framework — structured, intelligent, and deadly accurate.
Master the markets.
Decode the algorithm.
Trade like smart money .

Strategia S&P 500 vs US10Y YieldThis strategy explores the macroeconomic relationship between the equity market (S&P 500) and the debt market (10-Year Treasury Yield). Historically, rapid spikes in bond yields often exert downward pressure on equity valuations, leading to corrections or bear markets.
The goal of this strategy is capital preservation. It attempts to switch to cash when yields are rising too aggressively and re-enter the stock market when the bond market stabilizes.

Elliott Wave Full Fractal System v2.0Elliott Wave Full Fractal System v2.0 – Q.C. FINAL (Guaranteed R/R)
Elliott Wave Full Fractal System is a multi-timeframe wave engine that automatically labels Elliott impulses and ABC corrections, then builds a rule-based, ATR-driven risk/reward framework around the “W3–W4–W5” leg.
“Guaranteed R/R” here means every order is placed with a predefined stop-loss and take-profit that respect a minimum Reward:Risk ratio – it does not mean guaranteed profits.
Core Idea
This strategy turns a full fractal Elliott Wave labelling engine into a systematic trading model.
It scans fractal pivots on three wave degrees (Primary, Intermediate, Minor) to detect 5-wave impulses and ABC corrections.
A separate “Trading Degree” pivot stream, filtered by a 200-EMA trend filter and ATR-based dynamic pivots, is then used to find W4 pullback entries with a minimum, user-defined Reward:Risk ratio.
Default Properties & Risk Assumptions
The backtest uses realistic but conservative defaults:
// Default properties used for backtesting
strategy(
"Elliott Wave Full Fractal System - Q.C. FINAL (Guaranteed R/R)",
overlay = true,
initial_capital = 10000, // realistic account size
default_qty_type = strategy.percent_of_equity,
default_qty_value = 1, // 1% risk per trade
commission_type = strategy.commission.cash_per_contract,
commission_value = 0.005, // example stock commission
slippage = 0 // see notes below
)
Account size: 10,000 (can be changed to match your own account).
Position sizing: 1% of equity per trade to keep risk per idea sustainable and aligned with TradingView’s recommendations.
Commission: 0.005 cash per contract/share as a realistic example for stock trading.
Slippage: set to 0 in code for clarity of “pure logic” backtesting. Real-life trading will experience slippage, so users should adjust this according to their market and broker.
Always re-run the backtest after changing any of these values, and avoid using high risk fractions (5–10%+) as that is rarely sustainable.
1. Full Fractal Wave Engine
The script builds and maintains four pivot streams using ATR-adaptive fractals:
Primary Degree (Macro Trend):
Captures the large swings that define the major trend. Labels ①–⑤ and ⒶⒷⒸ using blue “Circle” labels and thicker lines.
Intermediate Degree (Trading Degree):
Captures the medium swings (swing-trading horizon). Uses teal labels ( (1)…(5), (A)(B)(C) ).
Minor Degree (Micro Structure):
Tracks short-term swings inside the larger waves. Uses red roman numerals (i…v, a b c).
ABC Corrections (Optional):
When enabled, the engine tries to detect standard A–B–C corrective structures that follow a completed 5-wave impulse and plots them with dashed lines.
Each degree uses a dynamic pivot lookback that expands when ATR is above its EMA, so the system naturally requires “stronger” pivots in volatile environments and reacts faster in quiet conditions.
2. Theory Rules & Strict Mode
Normal Mode: More permissive detection. Designed to show more wave structures for educational / exploratory use.
Strict Mode: Enforces key Elliott constraints:
Wave 3 not shorter than waves 1 and 5.
No invalid W4 overlap with W1 (for standard impulses).
ABC Logic: After a confirmed bullish impulse, the script expects a down-up-down corrective pattern (A,B,C). After a bearish impulse, it looks for up-down-up.
3. Trend Filter & Pivots
EMA Trend Filter: A configurable EMA (default 200) is used as a non-wave trend filter.
Price above EMA → Only long setups are considered.
Price below EMA → Only short setups are considered.
ATR-Adaptive Pivots: The pivot engine scales its left/right bars based on current ATR vs ATR EMA, making waves and trading pivots more robust in volatile regimes.
4. Dynamic Risk Management (Guaranteed R/R Engine)
The trading engine is designed around risk, not just pattern recognition:
ATR-Based Stop:
Stop-loss is placed at:
Entry ± ATR × Multiplier (user-configurable, default 2.0).
This anchors risk to current volatility.
Minimum Reward:Risk Ratio:
For each setup, the script:
Computes the distance from entry to stop (risk).
Projects a take-profit target at risk × min_rr_ratio away from entry.
Only accepts the setup if risk is positive and the required R:R ratio is achievable.
Result: Every order is created with both TP and SL at a predefined distance, so each trade starts with a known, minimum Reward:Risk profile by design.
“Guaranteed R/R” refers exclusively to this order placement logic (TP/SL geometry), not to win-rate or profitability.
5. Trading Logic – W3–W4–W5 Pattern
The Trading pivot stream (separate from visual wave degrees) looks for a simple but powerful pattern:
Bullish structure:
Sequence of pivots forms a higher-high / higher-low pattern.
Price is above the EMA trend filter.
A strong “W3” leg is confirmed with structure rules (optionally stricter in Strict mode).
Entry (Long – W4 Pullback):
The “height” of W3 is measured.
Entry is placed at a configurable Fibonacci pullback (default 50%) inside that leg.
ATR-based stop is placed below entry.
Take-profit is projected to satisfy min Reward:Risk.
Bearish structure:
Mirrored logic (lower highs/lows, price below EMA, W3 down, W4 retrace up, W5 continuation down).
Once a valid setup is found, the script draws a colored box around the entry zone and a label describing the type of signal (“LONG SETUP” or “SHORT SETUP”) with the suggested limit price.
6. Orders & Execution
Entry Orders: The strategy uses limit orders at the computed W4 level (“Sniper Long” or “Sniper Short”).
Exits: A single strategy.exit() is attached to each entry with:
Take-profit at the projected minimum R:R target.
Stop-loss at ATR-based level.
One Trade at a Time: New setups are only used when there is no open position (strategy.opentrades == 0) to keep the logic clear and risk contained.
7. Visual Guide on the Chart
Wave Labels:
Primary: ①,②,③,④,⑤, ⒶⒷⒸ
Intermediate: (1)…(5), (A)(B)(C)
Minor: i…v, a b c
Trend EMA: Single blue EMA showing the dominant trend.
Setup Boxes:
Green transparent box → long entry zone.
Red transparent box → short entry zone.
Labels: “LONG SETUP / SHORT SETUP” labels mark the proposed limit entry with price.
8. How to Use This Strategy
Attach the strategy to your chart
Choose your market (stocks, indices, FX, crypto, futures, etc.) and timeframe (for example 1h, 4h, or Daily). Then add the strategy to the chart from your Scripts list.
Start with the default settings
Leave all inputs on their defaults first. This lets you see the “intended” behaviour and the exact properties used for the published backtest (account size, 1% risk, commission, etc.).
Study the wave map
Zoom in and out and look at the three wave degrees:
Blue circles → Primary degree (big picture trend).
Teal (1)…(5) → Intermediate degree (swing structure).
Red i…v → Minor degree (micro waves).
Use this to understand how the engine is interpreting the Elliott structure on your symbol.
Watch for valid setups
Look for the coloured boxes and labels:
Green box + “LONG SETUP” label → potential W4 pullback long in an uptrend.
Red box + “SHORT SETUP” label → potential W4 pullback short in a downtrend.
Only trades in the direction of the EMA trend filter are allowed by the strategy.
Check the Reward:Risk of each idea
For each setup, inspect:
Limit entry price.
ATR-based stop level.
Projected take-profit level.
Make sure the minimum Reward:Risk ratio matches your own rules before you consider trading it.
Backtest and evaluate
Open the Strategy Tester:
Verify you have a decent sample size (ideally 100+ trades).
Check drawdowns, average trade, win-rate and R:R distribution.
Change markets and timeframes to see where the logic behaves best.
Adapt to your own risk profile
If you plan to use it live:
Set Initial Capital to your real account size.
Adjust default_qty_value to a risk level you are comfortable with (often 0.5–2% per trade).
Set commission and slippage to realistic broker values.
Re-run the backtest after every major change.
Use as a framework, not a signal machine
Treat this as a structured Elliott/R:R framework:
Filter signals by higher-timeframe trend, major S/R, volume, or fundamentals.
Optionally hide some wave degrees or ABC labels if you want a cleaner chart.
Combine the system’s structure with your own trade management and discretion.
Best Practices & Limitations
This is an approximate Elliott Wave engine based on fractal pivots. It does not replace a full discretionary Elliott analysis.
All wave counts are algorithmic and can differ from a manual analyst’s interpretation.
Like any backtest, results depend heavily on:
Symbol and timeframe.
Sample size (more trades are better).
Realistic commission/slippage settings.
The 0-slippage default is chosen only to show the “raw logic”. In real markets, slippage can significantly impact performance.
No strategy wins all the time. Losing streaks and drawdowns will still occur even with a strict R:R framework.
Disclaimer
This script is for educational and research purposes only and does not constitute financial advice or a recommendation to buy or sell any security. Past performance, whether real or simulated, is not indicative of future results. Always test on multiple symbols/timeframes, use conservative risk, and consult your financial advisor before trading live capital.

Keltner Channels Strategy NewThe strategy is chenging the same as an original copy, but this one is for tests, so I will publish it and check results

Trend Flow & Breakout Professional [Strategy]Description:
🌪️ Overview
Stop guessing. Start following the flow.
The Trend Flow & Breakout Professional is a high-precision visual trading system designed to solve the biggest problem traders face: Choppy Markets & Fakeouts.
Instead of relying on lagging indicators that generate false signals, this engine uses a proprietary "Momentum Alignment Algorithm" to identify when price action is entering a genuine expansion phase. It transforms complex trend data into a clean, easy-to-read visual roadmap, allowing you to catch the meat of the move while filtering out the noise.
🔮 Key Features
1. The "Traffic Light" Visual System Trading is 90% psychology. This script reduces mental fatigue by coloring the chart background to reflect the dominant market state:
🟢 Green Zone (Bullish Flow): Momentum is accelerating upwards. The system suggests holding long positions and ignoring minor pullbacks.
🔴 Red Zone (Bearish Flow): Structure has broken down. The system suggests defensive measures or short entries.
Note: The background remains active as long as the trend structure holds, preventing you from exiting trades too early.
2. Smart Noise Filtering Unlike standard crossover strategies that get destroyed in sideways ranges, this system includes a Multi-Layer Trend Filter. It only triggers a signal when:
Short-term momentum aligns perfectly with the medium-term direction.
Volatility expands significantly (breakout confirmation).
Price successfully clears key long-term structural resistance (The "Blue Sky" Zone).
3. Built-in "Smart Strategy" Backtester We have integrated a professional-grade position management module. You can customize how the strategy executes trades in the settings:
Mode A: Sniper (Trend Reversal): Enters heavily on the first confirmed breakout and holds until the trend reverses. Ideal for swing traders.
Mode B: Builder (Pyramiding): Adds to the position incrementally as the trend confirms its strength, maximizing profit during strong runs.
4. Cooldown Mechanism To prevent over-trading, the algorithm includes a smart "Cooldown Period" that prevents signal spamming during high-volatility consolidations.
⚙️ How to Trade This System
Wait for the Signal:
Look for the "Buy" / "Sell" labels accompanied by a bright Neon Candle.
Ensure the background color shifts (e.g., from Grey/Red to Green).
Ride the Zone:
Do not exit just because of one red candle. As long as the Background remains Green, the trend is healthy.
The background color acts as your "psychological anchor," helping you let profits run.
Exit / Reversal:
A complete background color flip (e.g., Green to Red) indicates a structural trend failure. This is your signal to close positions or flip directions.
⚠️ Disclaimer
This tool is for educational and technical analysis purposes only. Past performance does not guarantee future results. Always use proper risk management.
