CM Time Based Vertical LinesCM Time Based Lines
Requested by codetrader to Visually Show Day Change on Intra-Day Charts.
Custom Indicator: Ability To Plot Recurring Time Lines On Chart!
Example of Uses:
Plot Lines at Midnight to Show Daily Change.
Plot Lines at Opening of Different Sessions.
Plot Lines at Opening and Closing of Sessions.
Plot Lines Every 4 Hours (Forex) To See 4-Hour Price Action!
Ability to Change Times!
Ability to Plot Up To 6 Recurring Time Based Lines!
Plus Many Other Uses!
Ability To Turn On/Off Any of the 6 Customizable Lines in Inputs Tab!
Ability To Change Thickness of Lines to Cover Multiple Bars!
Custom-indicator

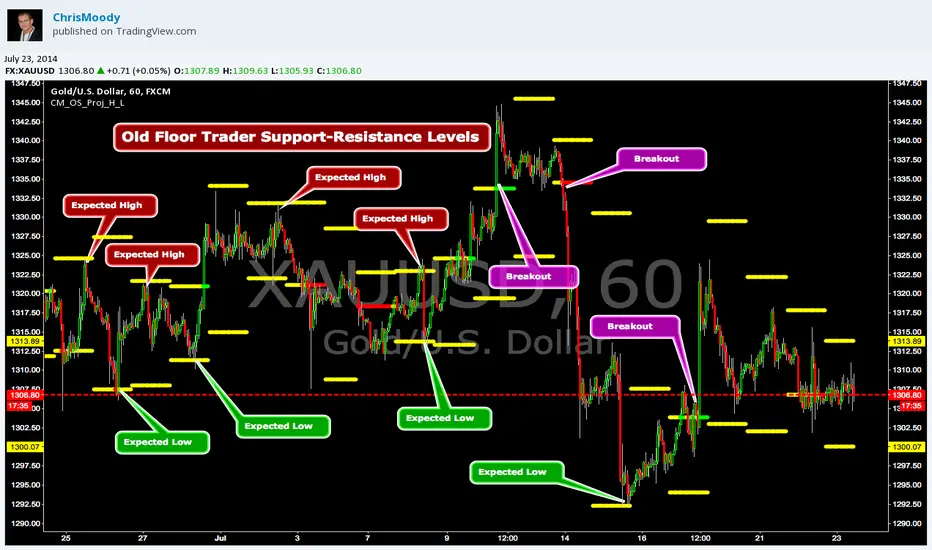
CM_OldSchool_Projected_high_LowHeard this story from Larry Williams…the trader who holds the record for winning the U.S. Trading Championship by turning $10K in to 2 Million.
A trader named Owen Taylor developed this formula as a Floor Trader before to calculate the Projected High and Low of the next day.
The formula worked so well…Owen charged other Traders 1K to get it.
I was pretty impressed with the results…so I coded it for the Weekly, Monthly, Quarterly, and Yearly Projected High Low.
While Owen considered these levels to be major support and resistance, Larry has developed many strategies based on the Breakout of the Projected High Low.
Therefore I coded it so the Levels would plot Yellow, and change to Green if the Projected High was taken out, and Red if the Projected Low was taken out.
***I’ve noticed on many instruments, Stocks, Index’s, Forex etc., depending on the instrument it works great as Support/Resistance or Breakouts.
***On a Daily Chart put the Quarterly and Yearly levels on SPY and EURUSD and go back about 10 years. Levels are pretty accurate.
CM_Pivot Points_CustomCustom Pivots Indicator - Plots Yearly, Quarterly, Monthly, Weekly, and Daily Levels.
I created this indicator because when you have multiple Pivots on one chart (For Example The Monthly, Weekly, And Daily Pivots), the only way to know exactly what pivot level your looking at is to color ALL S1 Pivots the same color, but create the plot types to look different. For example S1 = Bright Green with Daily being small circles, weekly being bigger circles, and monthly being even bigger crosses for example. This allows you to visually know exactly what pivot levels your looking at…Instantly without thinking. This indicator allows you to Choose any clor you want for any Pivot Level, and Choose The Plot Type.

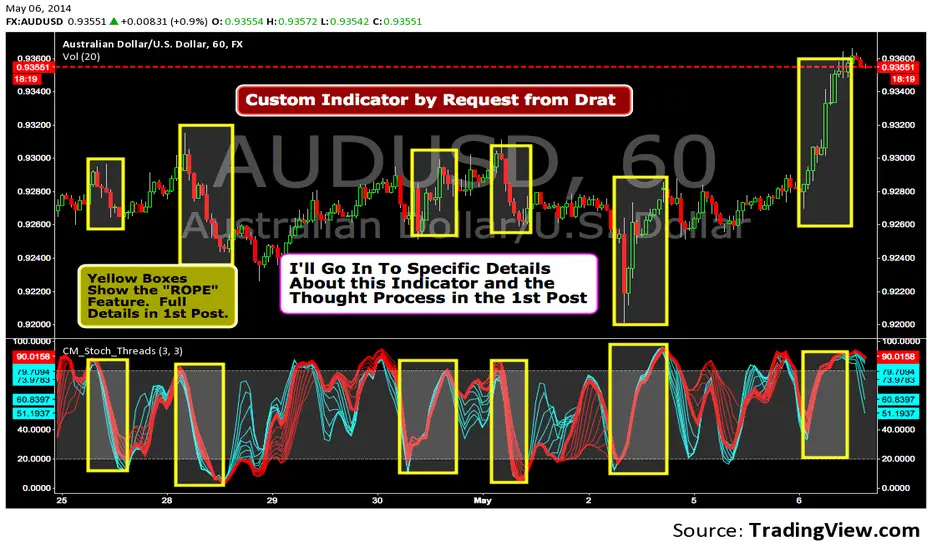
Custom Indicator--Interesting Thought Process!I was asked to create this Indicator by TV user Drat. In the 1st Post I go into Specific Details of the Indicator. The Concept is Valid and the 1st Post is Worth Reading.
Found $13K Profit-Simple Strategy-Highlights Days Of The WeekSee 1st Chart Post For Specific Details. Custom Indicator Highlights Bars for Specific Days of Week. Works on Daily Charts and Intraday Charts. Option to Highlight One Day or Multiple Days.

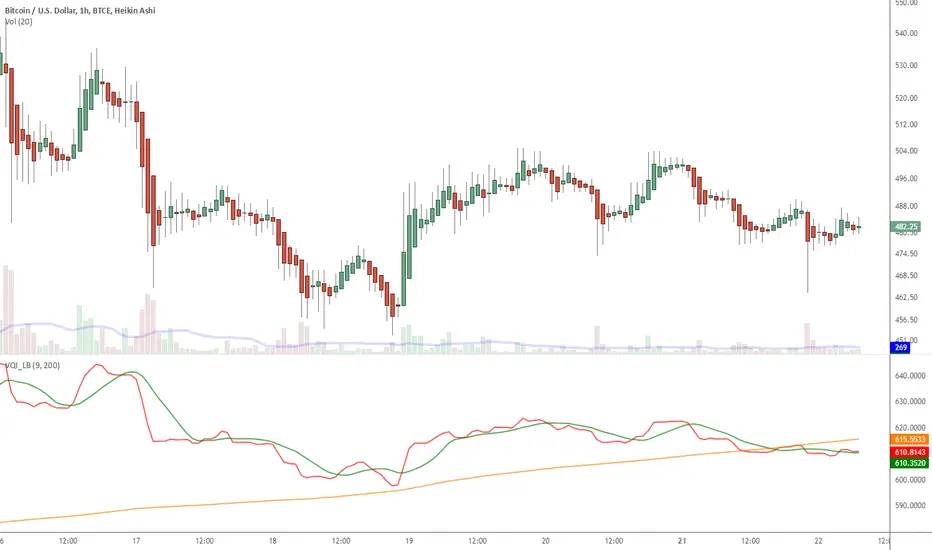
Indicator: Volatility Quality Index [VQI]Volatility Quality Index (VQI), by Thomas Stridsman, points out the difference between bad and good volatility in order to identify better trade opportunities in the market.
This plots 3 lines:
- Red line is the VQI (actually, sum of VQI).
- Green line is the 9-period SMA of sum_of_VQI.
- Orange line is the 200-period SMA of sum_of_VQI.
Stridsman suggested to buy when VQI has increased in the previous 10 bars (use the SMAs) and sell when it has decreased in the previous 10 bars. IMO, use this with your other indicators as a confirmation signal.
More info: www.3pips.com
To use this indicator in your charts, click on "Share" button (top right on the chart). Click on "Make it mine" button on the dialog that pops up. Now, you will have a copy of this chart with the indicator's source code in it. Click on "{}" to open the source code of VQI_LB and save it to your custom scripts section.
MacD Custom Indicator-Multiple Time Frame+All Available Options!This MacD Indicator has every feature available. See First Post for Details.
