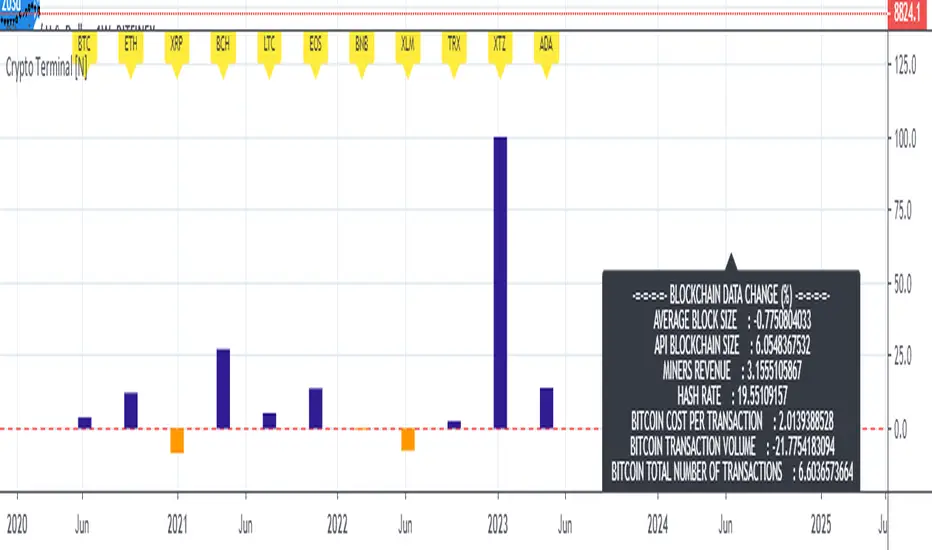
Live Mini Terminal 7 : Major Cryptocurrencies Change DataThis script displays relative data changes occurring in the adjustable period and/or adaptive automatic period in U.S Dollar based Major Cryptocurrencies.
This script was inspired by the data terminals used by commercial traders.
Period selection can be set in the menu.
This script uses the adaptive period algorithm used by Autonomous LSTM and Relativity scripts.
Or you can set the period manually from the menu.
For more information about adaptive period:
This script works only for 1 day (1D) and 1 week (1W) time frames.
Since usage of Blockchain Data, the most efficient time frame is 1 week (1W) .
Features
Value changes on a percentage basis (%)
The Info Panel contains percentage-based blockchain data changes.
CRYPTOCURRENCIES
BTC : Bitcoin
ETH : Ethereum
XRP : Ripple
BCH : Bitcoin Cash
LTC : Litecoin
EOS : EOS
BNB : Binance Coin
XLM : Stellar
TRX : Tron
XTZ : Tezos
ADA : Cardano
INFO PANEL
Average Blockchain Size change data
API Blockchain Size change data
Miners Revenue change data
Hash Rate change data
Bitcoin Cost Per Transaction change data
Bitcoin Transaction Volume change data
Bitcoin Total Number of Transactions change data
USAGE
The script can be used as an indicator by putting it under the chart as shown above.
It is necessary to enlarge to see clearly.
Since it is not often looked at,
such use is the best method for healthy interpretation.
Best regards.
สกุลเงินดิจิตอล
[astropark] Support Resistance Trendlines Swing PointDear Followers,
I'm very happy to publish this new tool, which will help you easily find
basic trend momentum (red if a bearish momentum is found, green viceversa)
Support Levels (where you can place your buy orders or short targets)
Resistance Levels (where you can place your sell orders or long targets)
Trendlines , known as diagonal supports and resistances (if price breaks a green one, then it's time to buy/long! otherwise if price breaks a red one, then it's time to sell/short)
Donchian Channel , which will memorize for you latest highs and lows, which may get retested for example
Swing Point , very useful point where to open a position while price holding above or below it
This script:
works on all timeframes
lets you edit each support-resistance cloud settings
lets you activate a third support-resistance cloud if you like
lets you choose if enable only one or disable all of them or whatever combination...
lets you choose to enable or disable trendlines, basic trend, donchian channel, swing point, etc... So very customizable user experience!
This is a premium indicator , so send me a private message in order to get access to this script.

PpSignal DiNapoli Stochastic Oscillatorthis di napoli stoch version is with candle style, buy when the candle is aqua and sell when de candle is red.
Please don't forget to use support, resistance and Fibonacci level to determine one trade.

Bitcoin CoP - Overlay V1A good estimate of what it would cost in electricity to mine 1 whole bitcoin with your preferred mining equipment. The cost of production overlay allows to change a few ASIC related variables like hash rate, device wattage, and electrical cost by KW/h. Defaults are set for the Antminer S17 Pro, which hashes at 53 Th/s and consumes 2.1 KW at 7.5 cents a KW/h. The overlay also considers halvings and plots CoP in those events.
This overlay can include other business related costs via "Other Costs" as a percentage of electrical cost USD/KW.h. Keep that value to 0 if you don't want to include it in your overlay.
The bubbles in the chart example is when mining devices came online. Pretty interesting to see difficulty adjust as new hashrate is added to the network.

Bitcoin Production Cost OscillatorFor Trav,
Oscillator version of "Bitcoin Production Cost".
Based on raw data from CBECI.
Follow me to read more about the calculation logic.

PpSignal RSI Haiken ashiPpSignal rsi Heiken Ashi is rsi smooth by elder formula and Heiken Ashi calculation.
Buy when the price is above on the RSI offset line (yellow).
Sell when the price is bellowed of RSI offset line (yellow).
for best results use the chart in bars style and turn on the bar color.

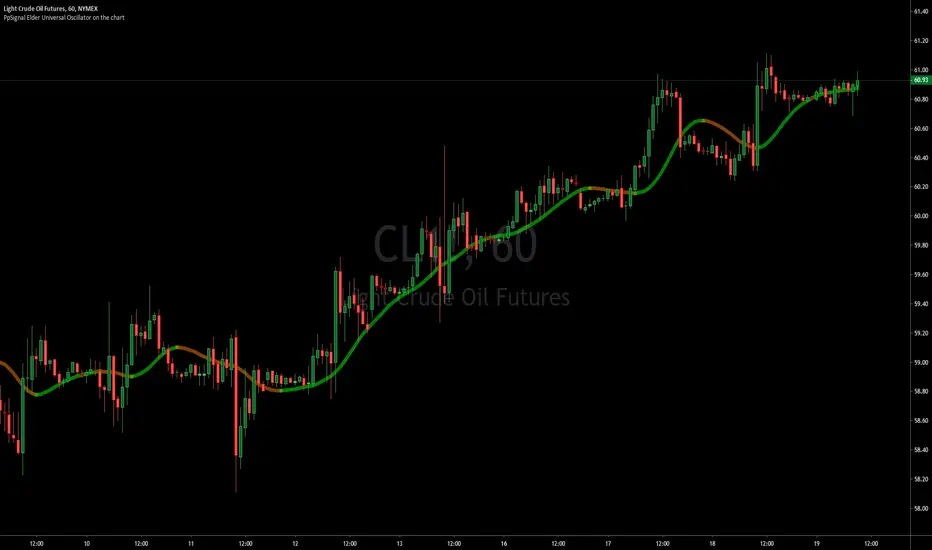
PpSignal Elder Universal Oscillator on the chartwe have the universal oscillator on the chart indicator.
is very simple to trade.
buy when the UO is green and sell when the UO is red.
The indicator has offset move average color yellow and super smooth elder move average...
Bitcoin Production CostBitcoin's Production Cost
Based on raw data from CBECI.
Follow me to read more about the calculation logic.

PpSignaldouble rsi cross alertthis indicator is rsi open and rsi close in the same chart and qqe move average.
open is green rsi line and close is red, when close is above open and qqe ma is blue for examples is a good signal, and vice-versa.
have got oversold and overbought background alert too.
Consider rsi divergences and the trend before entering to the market
Buy when rsi is oversold and qqe ma is in blue color.
sell when the rsi is overbought red background and qqe is red.

BEST Mayer MultipleHello traders
I'm not a HODLer by any means. I know when to sell (or I think I know....) when an asset starts going against me too much.
Even if it's a "long-term" investment.
My mentor used to telling me this: "If a short-term trade becomes a long-term investment, then you're in for a hell of a ride".
I have no clue if Bitcoin/BTC will go back up or not - I don't even care because I'm an intraday trader.
What if BTC was actually a way to accumulate more fiat? Satoshi fooled us
I coded this Mayer Multiple according to the specifications below. By the way, I'm a big fan of Willy Woo. I've been monitoring all his work since I learned about crypto (10 minutes ago.... it's a joke come on)
charts.woobull.com
Scaling
To respect the Mayer's multiple model, I recommend to select the Logarithmic scaling as shown below
imgur.com
What Mayer's model says
Using the reference below, the model says we're in the oversold zone. But, we can be in that zone for months/years...
When a model says an asset could bounce in a 1000-7000 USD range... well... I don't know how I would be able to perform optimally with that insight. This is very subjective and not a recommendation.
Mayer's Multiple model reference
All the BEST
Dave

(12) Pass Band Muti VS-97PBM transforms volatile and conflicting candles into obvious and easy trading decisions. It’s this simple; stocks trending in an upward direction will be above the zero line (1) in the chart below. Stock trending downward will be below the zero line (2). Zero line crossovers are indicating turning points and trading opportunities (3). This gives you advanced warning of when your trades are approaching the next turning point, as the indicator will migrate back toward the zero line. Momentum, Volatility and Rate-of-Change are each unique and distinctive attributes of stocks in strong trends. The Pass Band Multi indicator provides the trader with a collective or merged indication of these attributes, all reflected by this indicator as the height or distance the Pass Band, sin-wave, signal line is from the zero line (4).
When a stock’s PBM indicator advances rapidly, moving far above or far below the zero line you are seeing stocks in a strong trend with strong momentum. This strength and correspondingly the momentum will diminish over time in the absence of new market motivating factors such as rumors, news or earnings. As this occurs, the signal line will again drift down and approach the zero line even if the price has not moved against this most recent trend(5). This is a function of most oscillators and is referred to as detrending.
The closer your trade comes to the zero line the more likely you are to see a reversal in the stock's price in the near future. The PBM signal moving inside the center band (gold lines/blue fill)(6) indicates to you that this upward momentum has neutralized and an exit may be required as the stock’s price approaches the zero line. If you have a strong convection of this stock’s long term potential, then you can hold the stock as long as the Pass Band signal does not move below the zero line.
Stocks approaching the zero line, moving inside of the blue center band with gold boarders or tracking very near to the zero line indicate to traders that some action may be required by them to preserve capital in the near future. Short signals are exactly the opposite of the above description.
Over extended prices are signaled by green or red background flags and periods of consolidation are flagged with gold a background color.
Pass Band Multi is an excellent indicator for any class of equity, but as you can see from the example chart, it is also an excellent crypto trading indicator.
Access this Genie indicator for your Tradingview account, through our web site. (Links Below) This will provide you with additional educational information and reference articles, videos, input and setting options and trading strategies this indicator excels in.

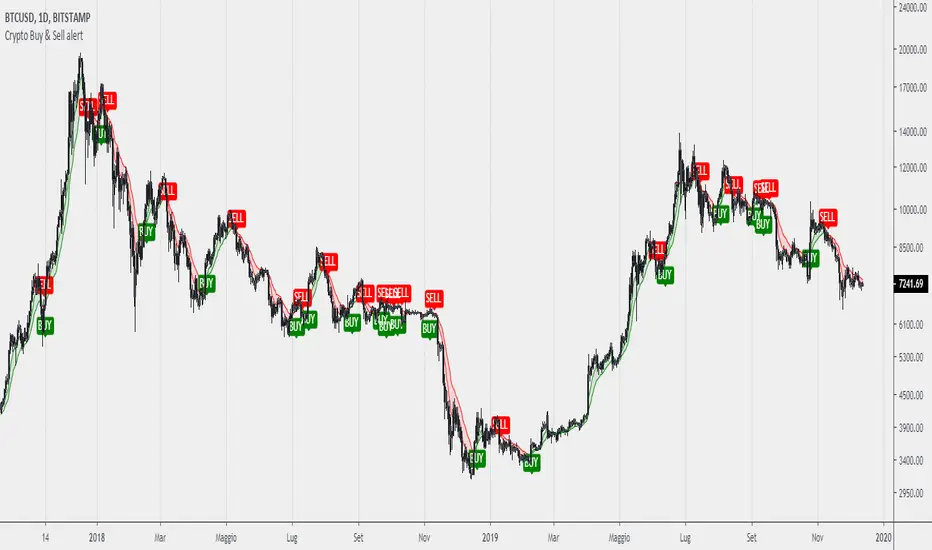
Crypto Buy & Sell alertCreated a simple study/trend indicator using small ema cross with 7/16 period and added some function like buy and sell plotshape and ALERT CONDITION FOR THEM!
This indicator works great for analyzing and catch bull/bear trend on macro view of crypto market. IT WORKS ONLY FOR 4H AND DAILY CHARTS.
[astropark] Renko RSI divergencesDear Followers,
today a new great Scalper Tool , which works excellent from 1 minute timeframe Renko chart , which is the best and more secure timeframe to use on a Renko chart. But of course it works great on all timeframes (included the 1D timeframe)!
This tool has some cool features:
it works on all timeframes , starting from 1 minute: so you can enjoy high-frequency trading by using a 24/7 running bot and a proper money and risk management strategy;
it shows you both bullish and bearish divergences with a triangle up or down respectively
when it finds a strong bullish/bearish divergence , a flag will be displayed instead of a triangle
This script will let you set all notifications you may need in order to be alerted on each triggered divergence.
You may like to use it together with my Renko Scalper V2
On Bitmex/ByBit/Binance Bitcoin/USD chart best settings is Traditional Renko chart with 10$ box size, while 0.5$ box size is suggested on Ethereum/USD pair.
This is a premium indicator , so send me a private message in order to get access to this script.

Heiken Ashi Triangles at the Top and Bottom of ScreenHeiken Ashi Triangles at the Top and Bottom of Screen
The image below shows the comparison to actual Heiken Ashi candles
(Though changing from candles to Heiken Ashi tends to smooth the triangles a little)

Directional Movement Index + Average Directional IndexPersonal DMI and ADX script
ADX color change from positive vs negative momentum
DMI Color fill based on DMI+/- positive momentum
No fill color during lack of momentum

Bitcoin Power Law CorridorOpen-source live tracker of Harold Burger's Bitcoin "Power Law Corridor".
Added optional chart fill and labels to show the percentage delta to the regression center-line, support and resistance.

PpSignal RSI Bands Version 2This the mtf Rsi on the chart version
look at the picture and you can understand everything.
You have on the chart the middle line 50 overbought 70 and oversold lever 30 , like the oscillator in bellow out the chart.
we added Bollinger band 20, 1 and qqe move average, rsi on the chart (green and red line with circles), Heiken Ashi rsi style and rsi offset move average (yellow color).
Enjoy it

PpSignal RSI MTF 3.19This Rsi oscillator have a donichian channel en middle move average included.
have got a QQE or atr move average.
Show new high and new low according to the pivot point.
Show Rsi divergence.
MTF option.

[SignalFI] H0dl2100K HA Trailer [V1]Welcome! It's my pleasure to bring a fully customized indicator based on @h0dl2100K's HA candle trading system. Through concerted efforts to bring automated trading systems from some of the best technical traders around, SignalFI provides the following features that were approved by @h0dl2100K:
Background
This system is based on the popular HA candle system and using several key levels and indicators of price action that can help identify entry, exit, and trailing stop levels for trading any asset (crypto, stocks, etc). The system is built to be used with HA candles, and provides the following key abilities:
1) HA Candle Doji Detector - HA candles are notorious for their ability to identify trend direction and changes in momentum. One of the easiest ways to identify these trend changes is when HA candles print "Doji candles" or candles that have long wicks on either side of the candle body. This signifies indecision in the market, and after a sustained up or down trend, usually marks a reversal in momentum. The Doji Detector will print label tags identifying potential bull or bear doji's which can be used as entry and exit signals or for identifying confluence with other indicators.
2) MTF Trail Lines - Using previous close levels for higher time frame candles is a cornerstone of trading fundamentals. Levels from the daily timeframe are respected on lower timeframes and can provide key levels to watch for entry or exit conditions to be "just right." The Trail lines are enabled by default and provide static levels on the chart in accordance with the following timeframes (4H, 12H, 1D, 3D, 1W). Both HIGH and LOW values for each timeframe are provided on the chart for easy of determining trailing stop levels or Take Profit levels depending on your trading system and confluence with other indicators.
3) EMA 50/200 - We've also included the notorious EMA trend lines that govern market sentiment from both short- and long-term investors (50 EMA, 200 EMA). These lines change color based on the price being above or below these levels and the levels can be fine-tuned within the settings to your EMA levels of choice.
4) MACD Crosses - We've also included signal tags where default MACD crosses occur to ensure that the trend direction is always presented on one graph. MACD crosses represent a significant sentiment score for trading all assets, and taken with the EMA trend, the HA candle trend, and the MTF Trail Levels can give a very consistent view of where price may be heading.
5) Alerts – It wouldn’t be a system unless we provided alerts to use for ease of notification of the data coming out of the script. For that reason, we have built-in alerts for both the MACD crosses and the Doji Detector. In addition, each Trail level be selected and alerted on to receive updates of when these key levels are crossed above or crossed below.
The H0dl2100K system is the result of years of market analysis and is mean to be a tool for guiding trading decisions in unison with or independently of other indicators. It works remarkably well with IchiEMA, AO and RSI PRIME as they all provide confluence to trading decisions, especially when using HA candles.
SignalFI was created to help traders and investors to effectively analyze the market based on the Golden Mean Ratio (Fibonacci numbers), plan a trade and ultimately execute it. To help inform and educate market decisions we developed a set of Trading Indicators which are available on TradingView.
SignalFI indicators are just that, indicators. Our indicators are generally configured to use completely historical data (negating repaint), and we advise all alerts created with SignalFI indicators to be fired upon "close" of the current candle. Our indicators can provide valuable context and visualization support when performing market analysis and executing buy and sell decisions. However. we are not financial experts, and all information presented on this site or our other media outlets are for educational purposes only.

[astropark] Crypto Swing Trading [alarms]Dear Followers,
today a Swing Trading Strategy , runnable on a bot , which works great from 30m timeframe and above. Best suggested timeframes are 1h and 4h.
If you are a scalper, you will love suggested entries for fast profit. You can run it from 1 minute timeframe if you are used to scalp trading and close each trade whenever you fell happy (a proper trailing stop strategy is suggested anyway).
This indicator can trigger till 5 or 20 buy or sell signals in a row before reverting (it changes greatly depending on timeframe you use), so use a proper money management .
This script will let you set alarms whenever a Buy or a Sell signal is drawn on chart. This way you can set all notifications you may need in order to be alerted on each triggered signal.
The backtesting-strategy version of this script can be found here below or by searching for "Crypto Swing Trading" and then choosing the "strategy" version.
Strategy results are calculated on the timeframe from January 2018 to now, so on about 2 years, using 10000$ as initial capital and working at 3x leverage (very safe leverage!).
This is not the "Holy Grail", so use a proper risk management strategy.
This is a premium indicator , so send me a private message in order to get access to this script.

Cracking Cryptocurrency - ParalloxParallox
Many traders are familiar with or utilize the Relative Strength Index ( RSI ) and/or the Commodity Channel Index ( CCI ). For good reason, these classic and simple to understand indicators have made their way into many traders indicator bays with mixed results. As we often do with our trading style and indicators here at Cracking Cryptocurrency is take things that traders have used one way and attempt to view it in a different light to improve our trading efficiency and performance. That is what we have done with Parallox.
Parallox harnesses the calculations of both the Relative Strength Index and Commodity Channel Index , but through a calculation for a new breed of trader and a new market. RSI and CCI were designed to work in the stock markets of old, and their effectiveness nowadays is more-so due to the "self fulfilling prophecy" concept of so many traders using them rather then their technical applicability to any particular market or market circumstance. Moreover, because so many retail traders now utilize the RSI and CCI , trading it the traditional way, for reversals, has created a golden zone of opportunity for larger traders, institutions, and whales to come in and grab the liquidity of counter-trend retail traders basing their signals off of overbought and oversold conditions in the market utilizing RSI and CCI .
What Parallox does is quite different. Instead of relying on the readings of RSI and CCI , it looks at the value of RSI relative to the value of CCI . By looking at the convergence or divergence of these two indicators, a much more accurate reading of the directional trend can be established. No more using these oscillators to pick false tops and bottoms, instead we can utilize their relative conditions to determine market trend. Not only that, but we can identify objective signals when we cross the barrier between convergence and divergence, therefore giving us clear buy and sell signals for any trading asset.
However, we haven't left reversal traders completely by the way side. What is often an "entry" point for reversal traders, when one has determined that the particular direction of the market is at it's extreme, is where Parallox crosses back the other way, identifying an "overbought" and "oversold" region of sorts, from which we can utilize as an exit indicator when in deeply profitable trending trades.
How to Use
Using Parallox is quite simple. It can be utilized as an Initiator or Confirmer, or also as a longer-term directional marker on any time frame. In it's most simple form, the Parallox Line will cross zero from below and the line will turn green. This is an indication that the market has moved from a bearish zone of control to a bullish zone of control, and can be viewed as a potential buy signal. Conversely, when the line crosses zero from above, the line will turn red, indicating the opposite and can be viewed as a potential short sell signal.
For exit indications in strongly trending markets, when the line goes below the lower dashed line when bearish , and above the upper dashed line when bullish , and comes either back below or back above, those can be seen as trend exhaustion signals and often represent great moments to take profit or to go flat in the market until another trend establishes itself.
Settings
Let's take a look at the settings of Parallox.
First, we can input the look back length we want for our RSI and CCI indicators. You will notice that the defaults are unnatural, that is because they are tuned specifically for the BTC USD market. When trading a different asset, you will want to experiment with the optimum look back length for the best signals.
We then take a moving average of our indicators to have plotted values to work with. As above, the look back lengths for the two moving averages are optimized for BTC USD. The same caveats for optimization apply.
Then we can select the smoothing, or type of moving average we wish to utilize. Parallox performs well with different types of moving average smoothing, and I recommend that you experiment with your style of trade to find the signals that best suit your trading system.
We can also select the source of our indicator values. By default, this is hl2 , which I find to be the best for most indicators, in a close tie with hlc3.
Strategy
Please let me know of your success stories, as well as any features you think would be helpful to add. If you notice any errors within it, please notify me so I can fix them. Trade Safely.

CryptoEngineering 🔥Isn’t It Time You Made Your Crypto Portfolio Great Again? 🔥
The falling knives, the heartbreaking crashes, the devastating feeling of watching a missed trade soar all the way to the moon.
The markets aren’t fair, which means you need a tool that gives you an edge. So,It is time to try EngineeringRobo.
The Engineeringrobo is a great ally in a crypto market - when the price moves the algorithm will automatically show Buy and Sell orders when there is a best opportunity to make a profit. It is a just SMART trading system script on TradingView that brings the easiest approach to trading with a high profitability rate.
I created EngineeringRobo to help you on your traders as a robo advisor , It will "not " trade on behalf of you on exchanges via API. It is not an AI robot,It is am ALGO Trading robot. You can use it on any trading markets (BIST, S&P 500,Commodities ,Forex, Crypto ) with any time frame!
My unique algorithm find profitable altcoins based on their Ichimoku, McGinley, MA, RSI, MACD, Stochastic, Volumes and Price Changes gives you BUY and SELL signals. The EngineeringRobo indicator displays two different signals for entry and exit on a coin to maximize its profitability on the chart. The signals can appear at any time during an open candle, but once closed the signal is final and wont change in the future.
One of the biggest advantages of algo trading is removing human emotion from the crypto markets,humans trading are susceptible to emotions that lead to irrational decisions.Robo doesn't have to think or feel good to make a trade. If conditions are met, it enters.When the trade goes the wrong way or hits a profit target, It exits. It doesn't get angry at the market or feel invincible after making a few good trades. The two emotions that lead to poor decisions that algo traders aren't susceptible to are fear,and greed.
That's why It makes money but most of you not!
What Are the Advantages of using it as a ROBO Advisor?
🔴Reduce your required screen-time
🔴Reduce anxiety over missing setups when you are busy
🔴Turn existing indicators into alerts (eg. Whenever RSI goes overbought)
🔴Find comfort in knowing that you have me on your side
To get the maximized results from @EngineeringRobo
Open tradingview
Decide the coin/BTC
Pick 1M
Draw the Support & Resistance lines
Change the 1W
Draw the lines - Support & Resistance
Find out Chart Patterns
Change to 3D/1D / 3H
Check Robo' signals
Set your orders
Enjoy your profits💰
***Even the best automated day trading software can trigger false trends.
In August 2012 by Knight Capital group;who lost over $440 million in just half an hour when their trading software went rogue in response to market conditions. That's why it is a Robo advisor not trading bot! Engineeringrobo is not a get-rich-quick scheme as well!
Disclaimer
Information on EngineeringRobo should not be seen as a recommendation to trade BIST, S&P 500,Commodities ,Forex, Crypto.
EngineeringRobo is not licensed nor authorized to provide advice on investing and related matters.
Information on the page is not, nor should it be seen as investment advice.Any trading decisions that you make are solely your responsibility. Clients without sufficient knowledge should seek individual advice from an authorized source.
Crypto and Forex trading entails significant risks and there is a chance that clients lose all of their invested money. Past performance is not a guarantee of future returns. Before trading with any of the Algos, clients should make sure they understand the risks.
EngineeringRobo nor its agents or partners are not registered and do not provide any services on the US territory.
***I have been trading since 2016 . Got my first bitcoin in 2013

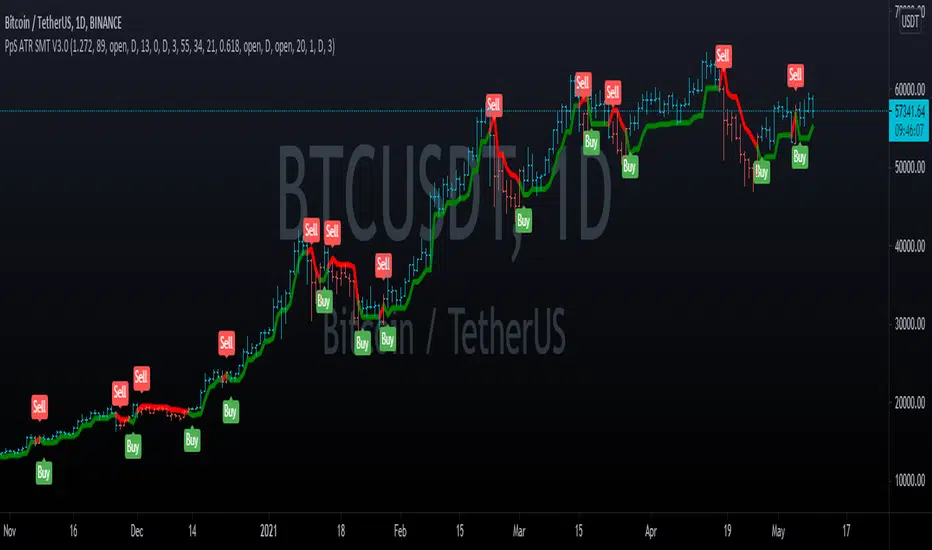
PpSignal ATR Trainling Stop Smooth Version 3.0This indicator is a mix between Ppsignal CFB and ATR smoothe indicators.
It is a very very assertive indicator if you want to operate with a volatile and tendency strategy.
Use other trading tools like channel, triangle, head & shoulder, and Fibonacci extension/retracement.
we added super smooth elder move average with alarm for scalping trade.
cfb and atr INDICATE HAVE ALARM too.
we added ATR move average.
Buy when the price is aqua and sell when the pice is orange.